

The Function of the Hypothalamic-Pituitary-Adrenal Axis During Experimental Autoimmune Encephalomyelitis: Involvement of Oxidative Stress Mediators
- PMID: 34220419
- PMCID: PMC8248369
- DOI: 10.3389/fnins.2021.649485
The Function of the Hypothalamic-Pituitary-Adrenal Axis During Experimental Autoimmune Encephalomyelitis: Involvement of Oxidative Stress Mediators
Abstract
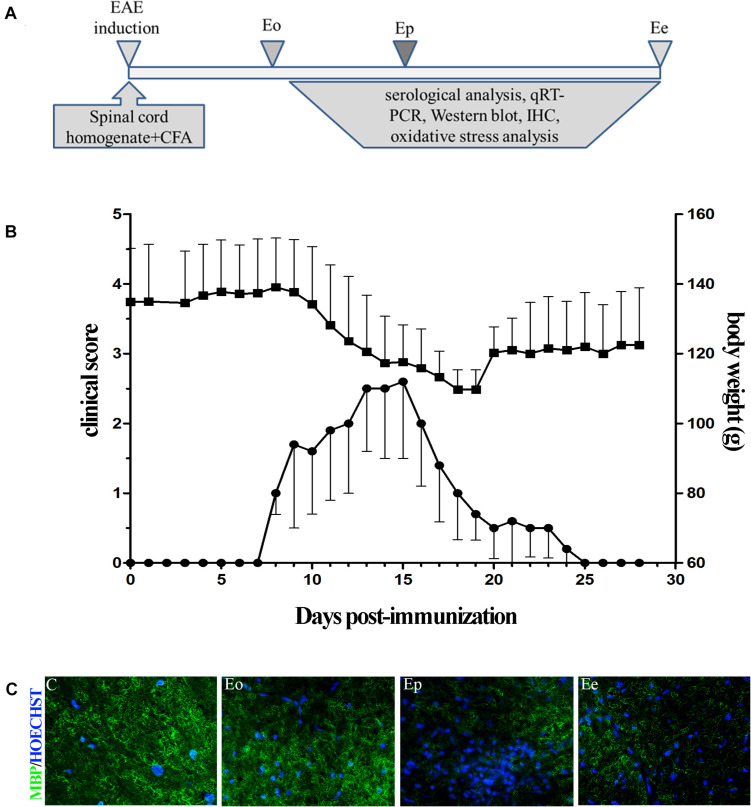
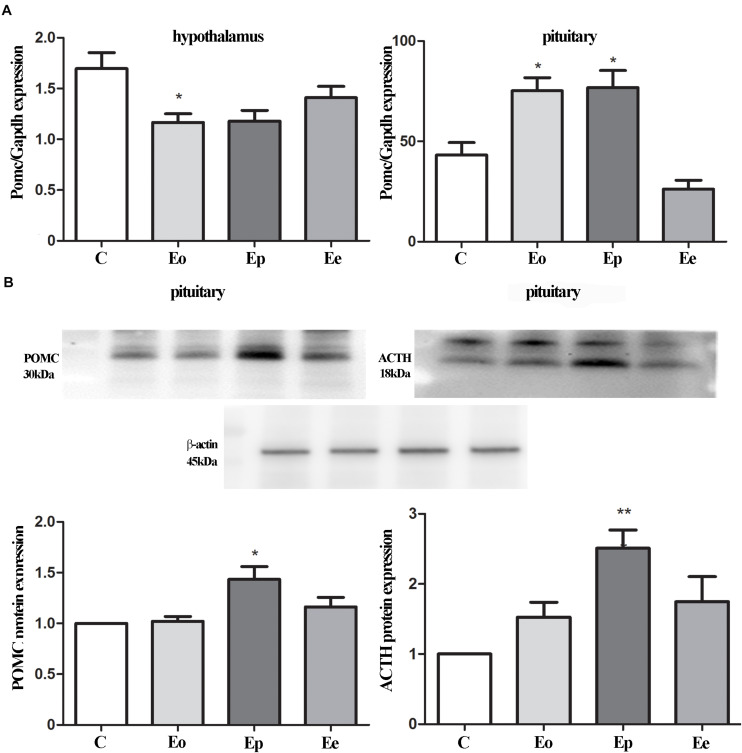
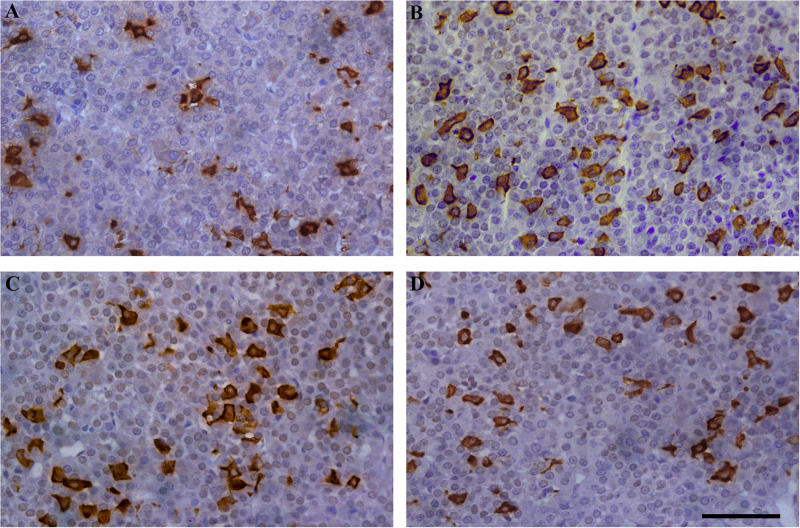
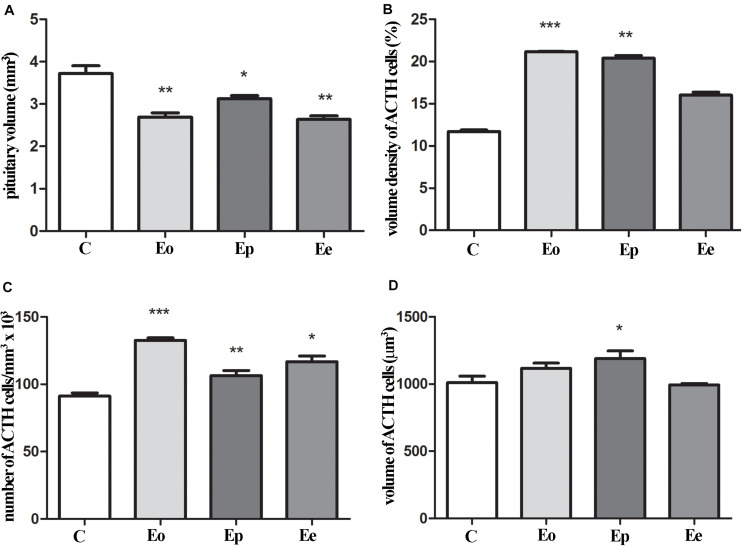
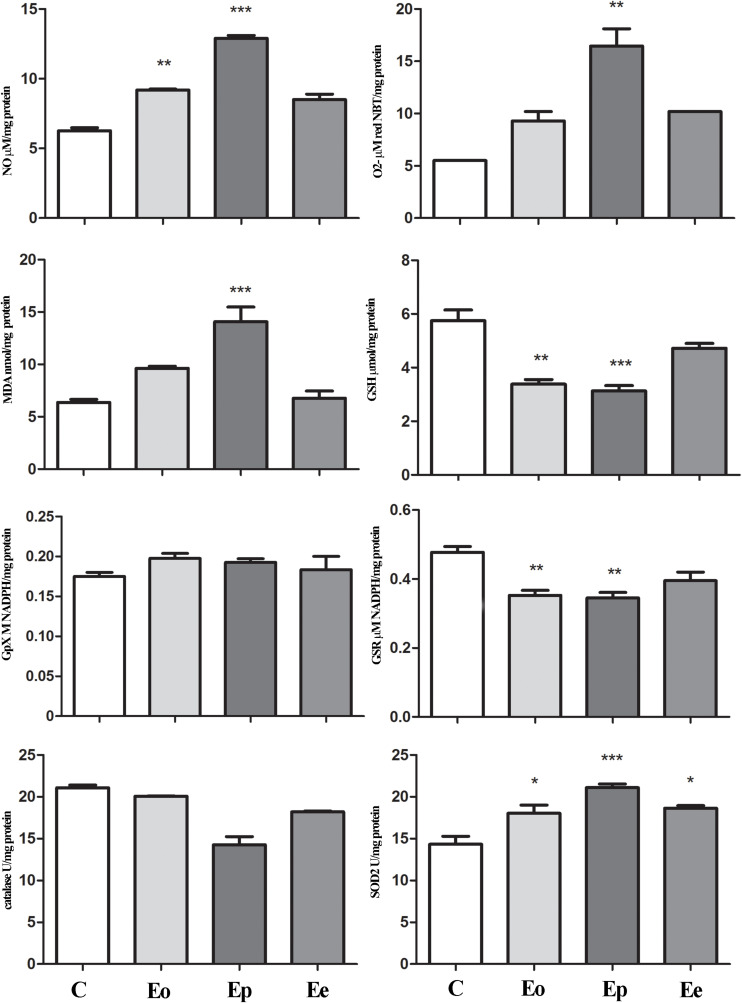
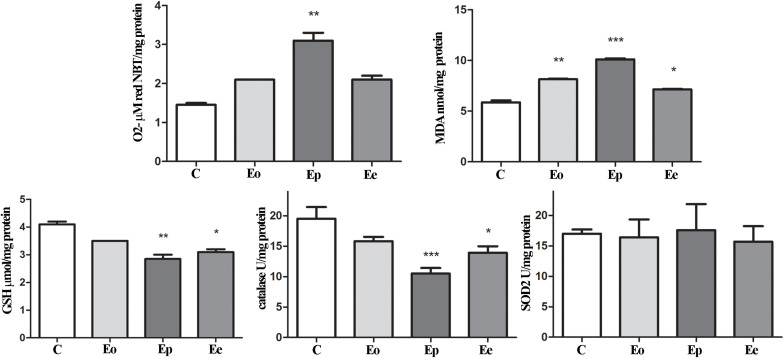
Multiple sclerosis (MS) is an inflammatory, demyelinating disease with an unknown origin. Previous studies showed the involvement of the hypothalamic-pituitary-adrenal (HPA) axis to susceptibility to autoimmune diseases, including MS, and its best-characterized animal model, experimental autoimmune encephalomyelitis (EAE). During MS/EAE, innate immune cells are activated and release cytokines and other inflammatory mediators, leading to a vicious cycle of inflammation. In response to inflammation, the activated HPA axis modulates immune responses via glucocorticoid activity. Because the mechanisms involving oxidative stress to the HPA axis are relatively unrevealed, in this study, we investigate the inflammatory and oxidative stress status of HPA axis during EAE. Our results reveal an upregulation of Pomc gene expression, followed by POMC and ACTH protein increase at the peak of the EAE in the pituitary. Also, prostaglandins are well-known contributors of HPA axis activation, which increases during EAE at the periphery. The upregulated Tnf expression in the pituitary during the peak of EAE occurred. This leads to the activation of oxidative pathways, followed by upregulation of inducible NO synthase expression. The reactive oxidant/nitrosative species (ROS/RNS), such as superoxide anion and NO, increase their levels at the onset and peak of the disease in the pituitary and adrenal glands, returning to control levels at the end of EAE. The corticotrophs in the pituitary increased in number and volume at the peak of EAE that coincides with high lipid peroxidation levels. The expression of MC2R in the adrenal glands increases at the peak of EAE, where strong induction of superoxide anion and malondialdehyde (MDA), reduced total glutathione (GSH) content, and catalase activity occurred at the peak and end of EAE compared with controls. The results obtained from this study may help in understanding the mechanisms and possible pharmacological modulation in MS and demonstrate an effect of oxidative stress exposure in the HPA activation during the course of EAE.
Keywords: cytokines; experimental autoimmune encephalomyelitis; hypothalamic–pituitary–adrenal axis; multiple sclerosis; oxidative stress.
Copyright © 2021 Trifunovic, Stevanovic, Milosevic, Ristic, Janjic, Bjelobaba, Savic, Bozic, Jakovljevic, Tesovic, Laketa and Lavrnja.
Conflict of interest statement
The authors declare that the research was conducted in the absence of any commercial or financial relationships that could be construed as a potential conflict of interest.
Figures
Similar articles
-
Hypothalamic-Pituitary-Adrenal Hypofunction in Myalgic Encephalomyelitis (ME)/Chronic Fatigue Syndrome (CFS) as a Consequence of Activated Immune-Inflammatory and Oxidative and Nitrosative Pathways.Mol Neurobiol. 2017 Nov;54(9):6806-6819. doi: 10.1007/s12035-016-0170-2. Epub 2016 Oct 20. Mol Neurobiol. 2017. PMID: 27766535 Review.
-
Alterations in the Hypothalamic-Pituitary-Adrenal Axis as a Response to Experimental Autoimmune Encephalomyelitis in Dark Agouti Rats of Both Sexes.Biomolecules. 2024 Aug 17;14(8):1020. doi: 10.3390/biom14081020. Biomolecules. 2024. PMID: 39199407 Free PMC article.
-
Susceptibility and resistance to experimental allergic encephalomyelitis: relationship with hypothalamic-pituitary-adrenocortical axis responsiveness in the rat.Endocrinology. 1999 Nov;140(11):4932-8. doi: 10.1210/endo.140.11.7109. Endocrinology. 1999. PMID: 10537116
-
Stress and hypothalamic-pituitary-adrenal axis function in experimental autoimmune encephalomyelitis and multiple sclerosis - a review.Psychoneuroendocrinology. 2007 Jul;32(6):604-18. doi: 10.1016/j.psyneuen.2007.05.002. Epub 2007 Jun 29. Psychoneuroendocrinology. 2007. PMID: 17602841 Review.
-
Multiple sclerosis is associated with alterations in hypothalamic-pituitary-adrenal axis function.J Clin Endocrinol Metab. 1994 Sep;79(3):848-53. doi: 10.1210/jcem.79.3.8077372. J Clin Endocrinol Metab. 1994. PMID: 8077372
Cited by
-
The Model of Interstitial Cystitis for Evaluating New Molecular Strategies of Interstitial Regeneration in Humans.Int J Mol Sci. 2024 Feb 15;25(4):2326. doi: 10.3390/ijms25042326. Int J Mol Sci. 2024. PMID: 38397003 Free PMC article. Review.
-
Revisiting the Pathogenesis of Type 1 Diabetes: Importance of Neural Input to Pancreatic Islets and the Therapeutic Capability of Stem Cell Educator TM Therapy to Restore Their Integrity.Biomedicines. 2023 Feb 16;11(2):594. doi: 10.3390/biomedicines11020594. Biomedicines. 2023. PMID: 36831130 Free PMC article. Review.
-
Chronic Ouabain Prevents Radiation-Induced Reduction in the α2 Na,K-ATPase Function in the Rat Diaphragm Muscle.Int J Mol Sci. 2022 Sep 18;23(18):10921. doi: 10.3390/ijms231810921. Int J Mol Sci. 2022. PMID: 36142836 Free PMC article.
-
Mechanism of N6-Methyladenosine Modification in the Pathogenesis of Depression.Mol Neurobiol. 2025 May;62(5):5484-5500. doi: 10.1007/s12035-024-04614-6. Epub 2024 Nov 18. Mol Neurobiol. 2025. PMID: 39551913 Review.
-
Lipid metabolism is dysregulated in endocrine glands upon autoimmune demyelination.J Neuroimmunol. 2024 Jun 15;391:578366. doi: 10.1016/j.jneuroim.2024.578366. Epub 2024 May 7. J Neuroimmunol. 2024. PMID: 38733741 Free PMC article.
References
-
- Auclair C., Voisin E. (1985). “Nitroblue-tetrazolium reduction,” in Handbook of Methods for Oxygen Radical Research, eds Greenwald R. A. (Boca Raton: CRC Press; ), 123–132.
-
- Berg D., Youdim M. B. H., Riederer P. (2004). Redox imbalance. Cell Tissue Res. 318 201–213. - PubMed
LinkOut - more resources
Full Text Sources
Miscellaneous