. 2021 Jun 17:14:658339.
doi: 10.3389/fnmol.2021.658339. eCollection 2021.

Broad Influence of Mutant Ataxin-3 on the Proteome of the Adult Brain, Young Neurons, and Axons Reveals Central Molecular Processes and Biomarkers in SCA3/MJD Using Knock-In Mouse Model

Affiliations

Broad Influence of Mutant Ataxin-3 on the Proteome of the Adult Brain, Young Neurons, and Axons Reveals Central Molecular Processes and Biomarkers in SCA3/MJD Using Knock-In Mouse Model

Kalina Wiatr et al. Front Mol Neurosci. .

Abstract

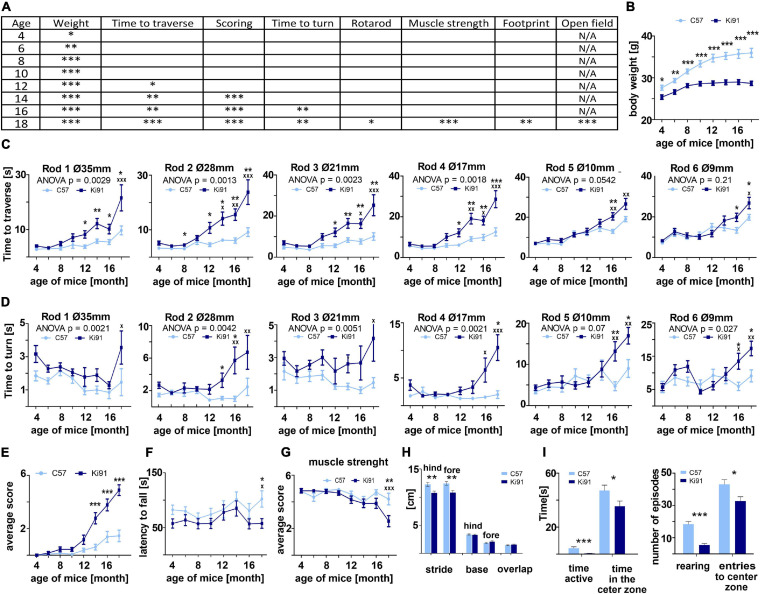
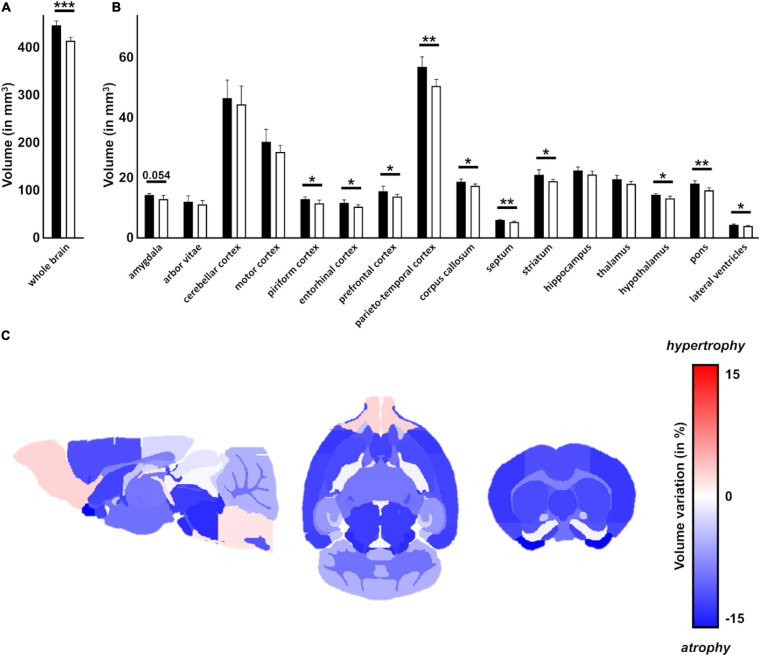
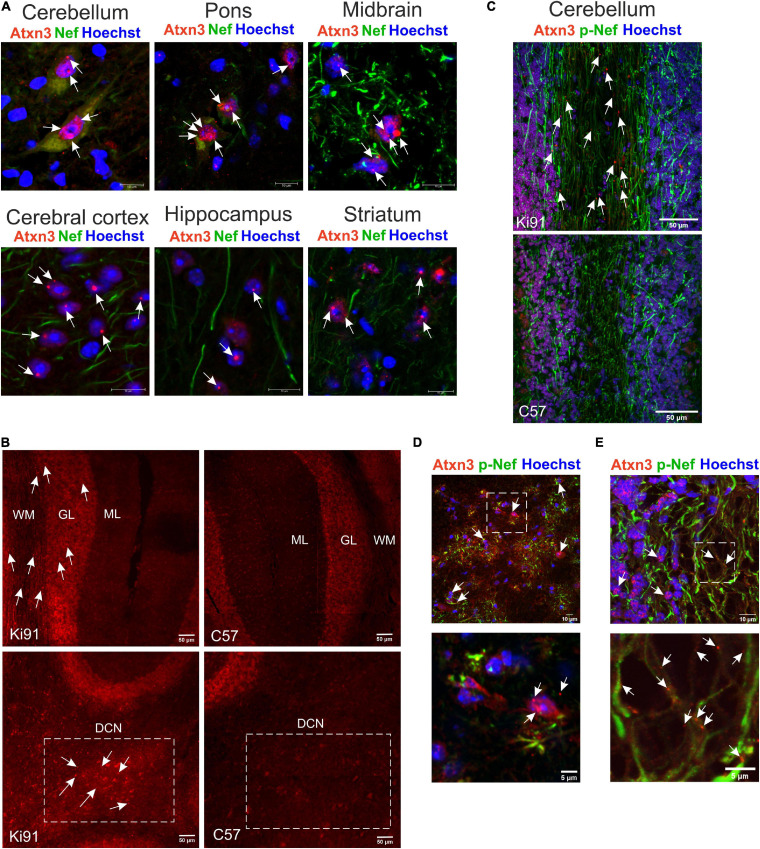
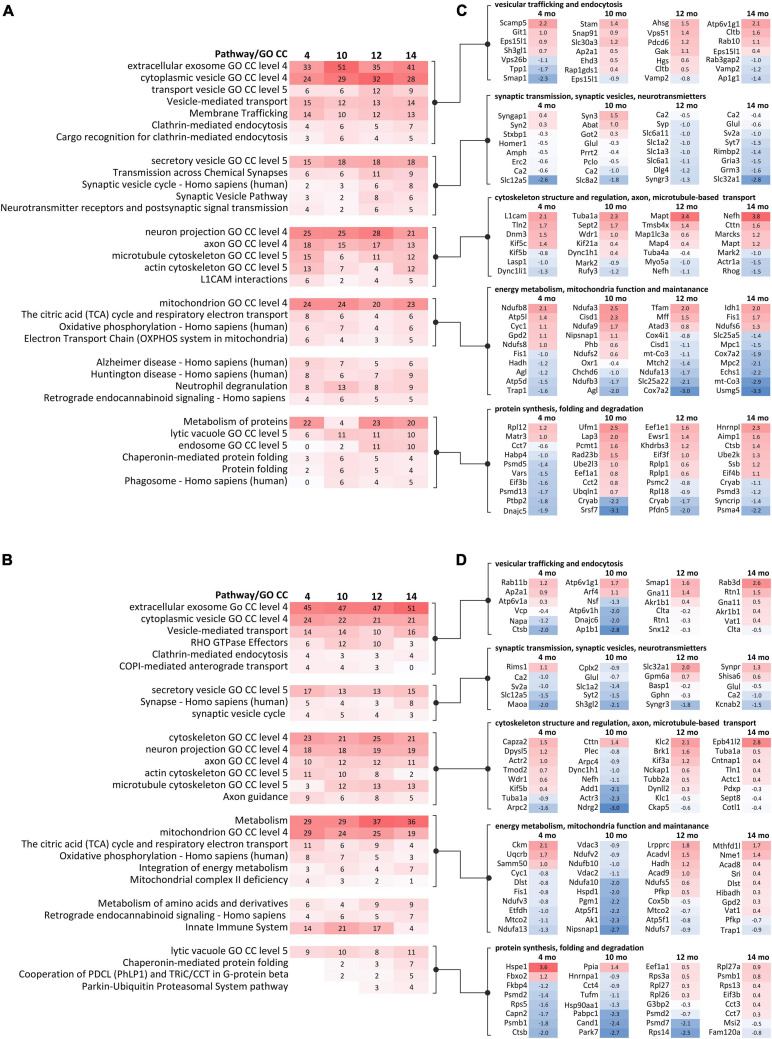
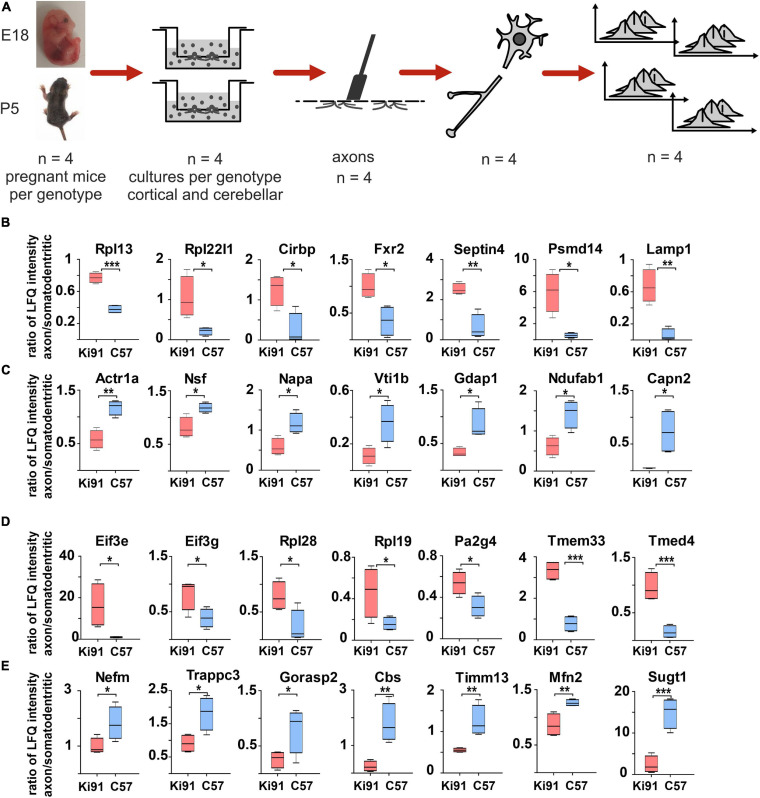
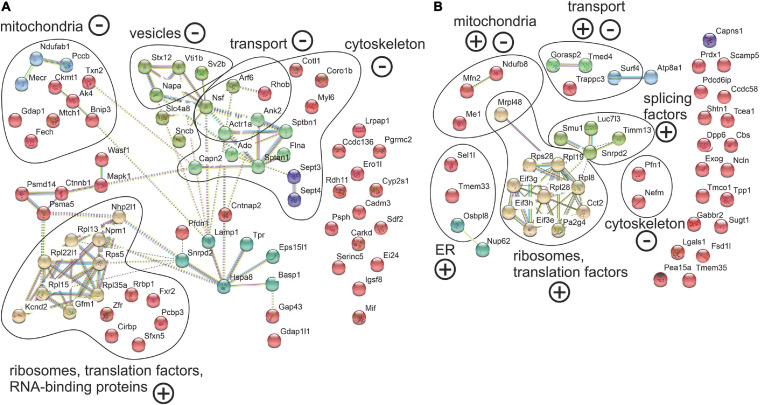
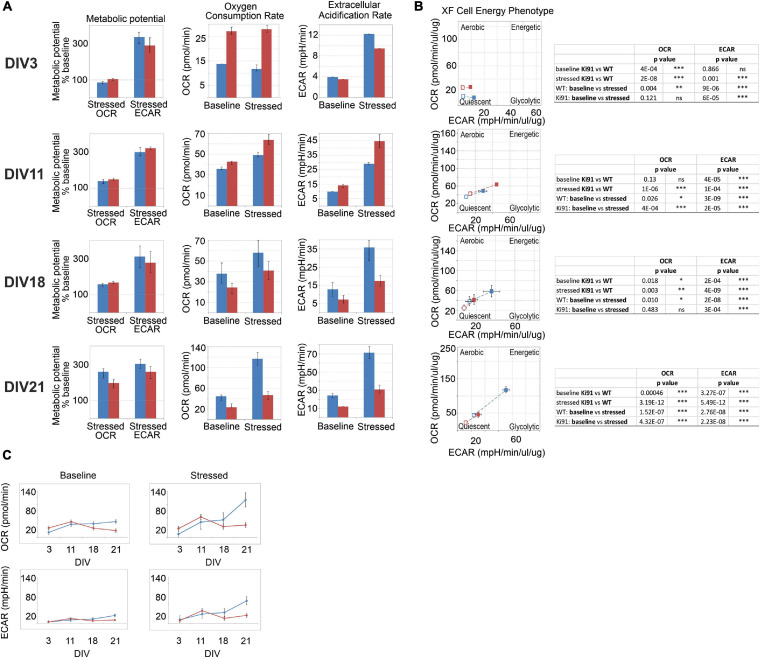
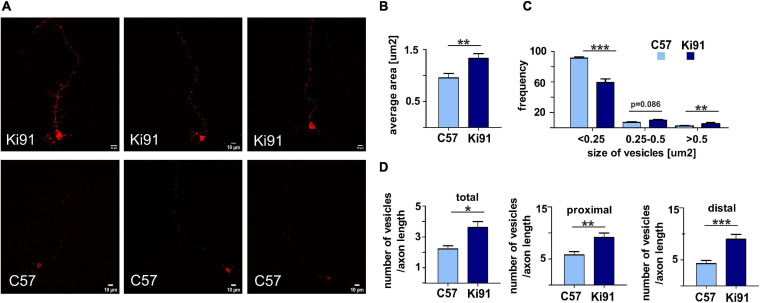
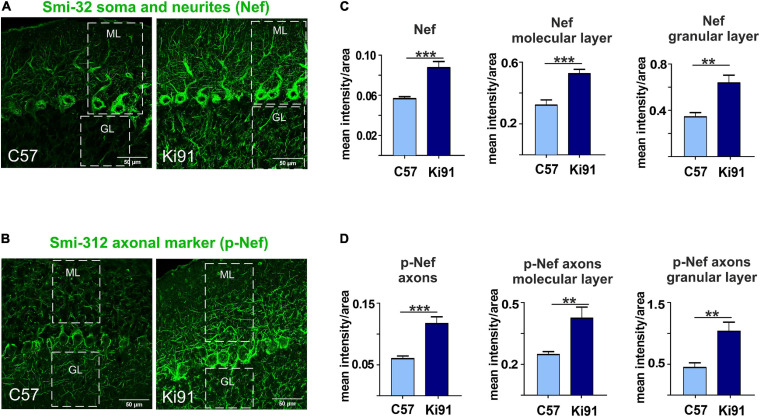
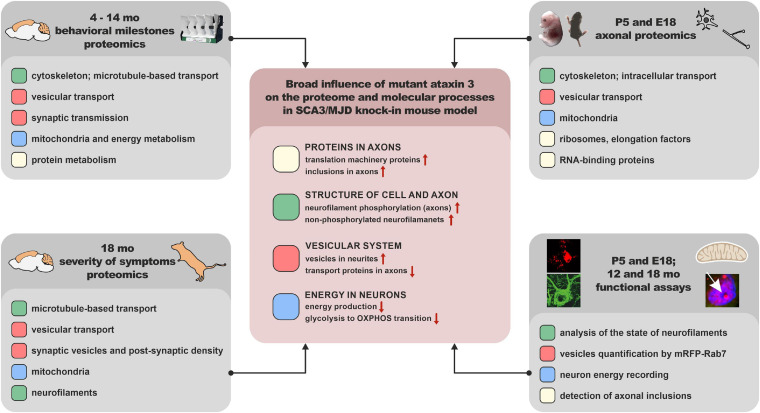
Spinocerebellar ataxia type 3 (SCA3/MJD) is caused by CAG expansion mutation resulting in a long polyQ domain in mutant ataxin-3. The mutant protein is a special type of protease, deubiquitinase, which may indicate its prominent impact on the regulation of cellular proteins levels and activity. Yet, the global model picture of SCA3 disease progression on the protein level, molecular pathways in the brain, and neurons, is largely unknown. Here, we investigated the molecular SCA3 mechanism using an interdisciplinary research paradigm combining behavioral and molecular aspects of SCA3 in the knock-in ki91 model. We used the behavior, brain magnetic resonance imaging (MRI) and brain tissue examination to correlate the disease stages with brain proteomics, precise axonal proteomics, neuronal energy recordings, and labeling of vesicles. We have demonstrated that altered metabolic and mitochondrial proteins in the brain and the lack of weight gain in Ki91 SCA3/MJD mice is reflected by the failure of energy metabolism recorded in neonatal SCA3 cerebellar neurons. We have determined that further, during disease progression, proteins responsible for metabolism, cytoskeletal architecture, vesicular, and axonal transport are disturbed, revealing axons as one of the essential cell compartments in SCA3 pathogenesis. Therefore we focus on SCA3 pathogenesis in axonal and somatodendritic compartments revealing highly increased axonal localization of protein synthesis machinery, including ribosomes, translation factors, and RNA binding proteins, while the level of proteins responsible for cellular transport and mitochondria was decreased. We demonstrate the accumulation of axonal vesicles in neonatal SCA3 cerebellar neurons and increased phosphorylation of SMI-312 positive adult cerebellar axons, which indicate axonal dysfunction in SCA3. In summary, the SCA3 disease mechanism is based on the broad influence of mutant ataxin-3 on the neuronal proteome. Processes central in our SCA3 model include disturbed localization of proteins between axonal and somatodendritic compartment, early neuronal energy deficit, altered neuronal cytoskeletal structure, an overabundance of various components of protein synthesis machinery in axons.

Keywords: Machado-Joseph disease (MJD); ataxin-3; axon; energy metabolism; neurodegenerative; proteome; spinocerebellar ataxia type 3 (SCA3); vesicular transport.


Conflict of interest statement

The authors declare that the research was conducted in the absence of any commercial or financial relationships that could be construed as a potential conflict of interest.

Figures

FIGURE 1
FIGURE 1
Progressive motor deficits and other disease symptoms in Ki91 SCA3/MJD mice. Ki91 mice presented a gradual decline in several motor and non-motor functions measured by elevated beam walk, rotarod, monitoring of body weight, muscle weakness, and other tests. (A) Progressive reduction of body weight gain was observed starting from 4-month-old mice; on average, mut/mut animals at 12 months of age displayed 16.4% less body weight compared to WT animals (p < 0.001; two-sample t-test) (B). In the elevated beam walk test (C,D) “time to turn” and “traverse time” parameters were measured on six rods with decreasing diameter (diameter of rods are indicated by Ø in mm). A total of 12-month-old Ki91 mice needed significantly more time to traverse on rods 1–4, whereas older 16-month-old mice also needed more time on rods 5–6. (C) A total of 16-month-old animals needed more time to turn on all rods (D). In the scoring test, 14-month-old Ki91 mice presented symptoms characteristic for SCA3: incoordination, gait disturbances, kyphosis, and hind limb clasping (E). A total of 18-month-old mice showed motor incoordination in accelerated rotarod (4–40 rpm in 9.5 min) (F), muscle weakness (G), and differences in stride length in footprint test (H). A total of 18-month-old mice also presented a cognitive deterioration marked by a decreased amount of time spent in the center zone in the Open field test and a decreased number of rearing (I). Two-way ANOVA with Bonferroni post hoc test (p ≤ 0.05; total number of biological replicates: n = 36, n = 18 per genotype), error bars: SEM. Asterisks denotes a two-way ANOVA calculated separately for each test consisted of 4 days at each age (*p < 0.05, **p < 0.01, ***p < 0.001); x-symbol represent two-way ANOVA calculated after completion of testing all ages (xp < 0.05, xxp < 0.01, xxxp < 0.001).
FIGURE 2
FIGURE 2
Atrophy of multiple regions including white matter in the Ki91 SCA3/MJD brain. MRI image segmentation was used to measure whole brain volume ex vivo of 18-month-old Ki91 and WT mice (n = 6 per genotype) and revealed significant global atrophy (–7%, p < 0.001) (A) and reduction of volume of many regions, such as parieto-temporal cortex (–11%, p < 0.01), entorhinal, piriform and motor cortexes (–11% each, p < 0.05), corpus callosum (–7,5%, p < 0.05), striatum (–11%, p < 0.05), septum (–11%, p < 0.01), pons (–12%, p < 0.01) and hypothalamus (–8%, p < 0.05) (B). Schematic representation of brain regions atrophy in Ki91 mice (C). Atrophy of many brain regions might suggest impaired connections between those structures. The gradient of red color is for hypertrophy, the gradient of blue color for the atrophy. Two-sample t-test (*p < 0.05, **p < 0.01, ***p < 0.001), error bars: SEM.
FIGURE 3
FIGURE 3
The presence of multi-region intra-nuclear and intra-axonal inclusions in Ki91 SCA3/MJD brain. The ataxin-3 immunostaining of the 18-month-old Ki91 brain sections revealed a large number of cells within the cerebellum, midbrain, pons, cerebral cortex, hippocampus, and striatum with ataxin-3 (red; rabbit anti-ataxin-3 antibody) localizing mainly in the cell nucleus (blue; Hoechst 33342) (A). White arrows indicate large intra-nuclear inclusions; however, many smaller inclusions throughout the brain were present. A rich representation of Atxn3 aggregates (red; rabbit anti-ataxin-3 antibody) was present in DCN, granular layer (gl), and white matter (wm) of the Ki91 cerebellum (B–D). A significant number of small and large ataxin-3 inclusions were detected in the neurites (green; Smi-32, pan-neuronal or Smi-312, axon-specific antibody) of the Ki91 cerebellum (C,E). White box and arrows in (D) mark prominent Atxn3 aggregates in the DCN area (lower panel represents the magnification of selected region in the upper panel). White box and arrows in (E) mark the magnified area containing multiple intra-axonal inclusions of Atxn3 (lower panel). Scale bars: 50 μm (B,C); 10 μm (A); 5 μm on inserts (D,E). N = 4 biological replicates; at least 4 pictures per brain region of each kind were collected.
FIGURE 4
FIGURE 4
GO term and pathway analysis of dysregulated proteins identified in proteomics at behavioral milestones in the Ki91 SCA3/MJD mouse brain implicate vesicular transport, cytoskeleton, protein metabolism, and mitochondrial function. Bioinformatic analysis of biological pathways and subcellular localization of dysregulated proteins (p < 0.05; two-sample t-test, n = 4 per genotype) during disease progression in the cerebral cortex (A) and cerebellum (B) was assessed using ConsensusPath database (CPDB; pathways p-value cut-off < 0.01; GO terms cellular component, p-value cut-off < 0.01, level 3, 4). The heatmaps present changes of pathways and subcellular localization involving dysregulated proteins (p < 0.05; two-sample t-test) over the course of the disease in four tested ages (4, 10, 12, and 14-month-old) by showing what percentage of dysregulated proteins in each set is assigned to the particular pathway or subcellular region (numbers). The gradient of red color denotes a higher percentage of dysregulated proteins (more intense color) to a lower percentage of dysregulated proteins (less intense color). The five groups of pathways and GO terms arranged in blocks in (A,B) are linked to the corresponding lists of dysregulated proteins (p < 0.05; two-sample t-test) with the highest log2-FC in each tested age, assigned to five arbitrary categories in the cerebral cortex (C) and cerebellum (D). The categories were formed based on the analysis of pathways and GO terms and are as follows: (1) vesicular trafficking and endocytosis; (2) synaptic transmission, synaptic vesicles, and neurotransmitters; (3) cytoskeleton structure and regulation, axon, and microtubule-based transport; (4) energy metabolism, mitochondria function, and maintenance; and (5) protein synthesis, folding, and degradation. The lists of dysregulated proteins are also presented as heatmaps with numbers representing log2-FC (C,D). The gradient of red color is for upregulated proteins, blue color for downregulated proteins.
FIGURE 5
FIGURE 5
Targeted axonal proteomics reveals sets of proteins enriched or depleted in the Ki91 SCA3/MJD cerebellar and cortical axons. Identification of proteins differentially localized in SCA3 neuronal compartments was performed by isolating two neuronal fractions (axonal and somatodendritic) from the same culture (Boyden chambers) obtained from E18 embryo (cortical) or P5 pups (cerebellar) – derived neurons. In brief, neurons were seeded on the inner side of the Boyden chamber inserts with a 1-μm porous filter. After the period of neuronal differentiation and axonal growth through and toward the outer side of the insert membrane, both the inner side of the insert (somatodendritic) and the outer side (axonal) were scraped, and the fractions were collected for MS/MS analysis (A). Graphs present proteins with abnormal localization between axon and soma with the highest ratio between those compartments (p < 0.05; two-sample t-test) in the primary cerebellar (B,C) and cortical Ki91 neurons (D,E). In the P5-derived Ki91 cerebellar axons, there were enriched proteins related to ribosomes (Rpl13 and Rpl22l1), RNA-binding (Cirbp and Fxr2), and proteasome or lysosome (Psmd14 and Lamp1) (B). Proteins depleted in the Ki91 cerebellar axons involved important modulators of vesicular transport (Actr1a, Nsf, Napa, and Vti1b) (C). In the E18-derived Ki91 cortical axons, there were enriched translation factors (Eif3e and Eif3g), ribosome subunits (Rpl28 and Rpl19), RNA-binding (Pa2g4), and ER and Golgi (Tmed4 and Tmem33) (D). Proteins that were depleted in the Ki91 cortical axons included neurofilament (Nefm), related to intracellular trafficking (Trappc3 and Gorasp2), and mitochondria (Timm13 and Mfn2) (E). two-sample t-test (*p < 0.05, **p < 0.01, ***p < 0.001), n = 36, n = 4 per phenotype, error bars: SEM.
FIGURE 6
FIGURE 6
Abnormal localization between axon and soma in the cerebellar and cortical neurons of Ki91 SCA3/MJD build an intensely interconnected network of proteins of translation machinery, vesicles, and transport machinery, cytoskeletal and mitochondrial proteins. The network of proteins displaying altered ratio between axon and soma in cerebellar (A) and cortical neurons (B) of Ki91 mice were generated using String database and clustering (https://string-db.org/). Number of proteins enriched in cerebellar axons n = 34 (ratio axon/soma > 1, p < 0.05; two-sample t-test); reduced in cerebellar axons n = 41 (ratio axon/soma < 1, p < 0.05; two-sample t-test); enriched in cortical axons n = 27 (ratio axon/soma > 1, p < 0.05; two-sample t-test); reduced in cortical axons n = 20 (ratio axon/soma < 1, p < 0.05; two-sample t-test), four biological replicates per genotype. Distinct colors denote clusters of proteins generated by the String algorithm, which grouped functionally associated proteins into specific sets, such as translational machinery (ribosomes and translation factors), cytoskeletal-modulators, and vesicular proteins. Functional groups are marked and named based on GO annotations (BP, M Level 3, 4, and 5; q < 0.01) using CPDB or GO term search if not available in CPDB. “+” and “–” denote for enrichment or depletion of protein groups in axons based on F.C. of the majority of proteins in the group. Blue and pink edges represent known interactions, green, red, and dark blue represent predicted interactions, while black and purple are other interactions.
FIGURE 7
FIGURE 7
The energy metabolism measured by Seahorse XFp Cell Energy Phenotype Test is impaired in the P5 cerebellar neurons of Ki91 SCA3/MJD. The assays were performed with cerebellar neurons at DIV3, 11, 18, and 21. The rate of mitochondrial respiration (OCR, oxygen consumption rate) and glycolysis (ECAR, extracellular acidification rate) were measured under baseline and stressed conditions, which were evoked by specific stressors: 1 μM of oligomycin and 1 μM of FCCP. The bioenergetic parameters are shown for OCR (pmol/min), ECAR (mpH/min), and metabolic potential [(stressed OCR or ECAR/baseline OCR or ECAR) × 100%)] in (A). In DIV3 and DIV11, OCR in neurons is elevated in Ki91 compared to WT (p < 0.001; two-sample t-test), but in later stages (DIV21), both OCR and ECAR are severely decreased in Ki91 neurons (p < 0.001; two-sample t-test) under both baseline and stressed conditions (A). WT cerebellar neurons transform from the quiescent phenotype in DIV3 toward energetic in DIV21, but Ki91 does not undergo such transformation (B). The profiles of OCR and ECAR during tested developmental stages in vitro are presented in (C). The blue color is for WT neurons; red is for Ki91 neurons. Experiments were performed in n = 6 per genotype and stage. Two-sample t-test (*p < 0.05, **p < 0.01, ***p < 0.001), error bars: SEM.
FIGURE 8
FIGURE 8
Accumulation and enlargement of vesicles in Ki91 SCA3/MJD P5 cerebellar neurons. To investigate if the consensus vesicular and transport process identified by various types of proteomics in Ki91 impacts vesicle appearance and number, we transfected the primary cerebellar neurons (DIV8-9) with RFP-labeled Rab7. The Rab7 was selected as a useful vesicle tag since it is often recruited to several types of vesicles, including late endosomes and lysosomes (red). Representative images show fluorescently tagged vesicles in cerebellar neurons from Ki91 mice (upper panel) and WT neurons (lower panel) (A). The sizes and the number of tagged vesicles were quantified using ImageJ. The average area of fluorescently tagged vesicles was 1.33 μm2 (n = 45) for Ki91, 0.95 μm2 (n = 34) for WT (p < 0.01; two-sample t-test) (B). The size distribution of tagged vesicles in Ki91 cerebellar neurons showed a shift from smaller to larger sizes in comparison to WT (p < 0.001; two-sample t-test) (C). The number of vesicles per axon length was higher in Ki91 neurons, also measured separately for both proximal and distal parts (defined as 1/8 of the axon length starting either from the axon hillock or axon tip) (D). The measurements were from five independent experiments, with 5–10 cells analyzed each time. Scale bars: 10 μm. Two-sample t-test (*p < 0.05, **p < 0.01, ***p < 0.001), error bars: SEM.
FIGURE 9
FIGURE 9
Accumulation of neurofilaments in the cerebellar neurons of Ki91 SCA3/MJD brain. Immunofluorescent staining of the cerebellar sections from 12-month-old mice evaluates the condition of neuronal cytoskeleton and phosphorylation state of neurofilaments in axons. The staining shows the accumulation of phosphorylated neurofilaments in SCA3 cerebellar axons, which is often a sign of axonal stress. Also, the non-phosphorylated pan-neuronal neurofilaments also show increased staining intensity indicating altered cytoskeleton in SCA3 neurons. Scale bars: 50 μm (A,B). Non-phosphorylated heavy neurofilaments (Nef) detected with SMI-32 antibody (pan-neuronal) are presented in panel (A). Phosphorylated neurofilaments H and M detected with SMI-312 (p-Nef; axon-specific) are shown in (B). White boxes inside pictures (A,B) mark the area, which was used for measuring the mean intensity of the fluorescence comprising the molecular and granular layer of the cerebellum. Measurement of mean intensity of fluorescence using ImageJ and statistics (p < 0.05; two-sample t-test) performed for sections as a whole and for both layers separately is presented on the graphs (C,D). Axon-specific SMI-312-positive neurofilaments were highly phosphorylated in both layers in the cerebellum of the Ki91 animals (molecular layer, p < 0.001; granular layer, p < 0.01; two-sample t-test) (B,D). Moreover, the level of dephosphorylated neurofilaments was also elevated in both cerebellar layers of the Ki91 (p < 0.01; two-sample t-test) (A,C). N = 3 biological replicates and 10 confocal images per genotype were collected. Two-sample t-test (*p < 0.05, **p < 0.01, ***p < 0.001), error bars: SEM.
FIGURE 10
FIGURE 10
The graphical summary of broad influence of mutant ataxin 3 on the proteome and molecular processes in SCA3/MJD knock-in mouse model.

Similar articles

Cited by

References

    1. Baleriola J., Hengst U. (2015). Targeting axonal protein synthesis in neuroregeneration and degeneration. Neurotherapeutics 12 57–65. 10.1007/s13311-014-0308-8 - DOI - PMC - PubMed
    1. Banker G. A., Cowan W. M. (1979). Further observations on hippocampal neurons in dispersed cell culture. J. Comp. Neurol. 187 469–493. 10.1002/cne.901870302 - DOI - PubMed
    1. Bettencourt C., Lima M. (2011). Machado-Joseph disease: from first descriptions to new perspectives. Orphanet J. Rare Dis. 6:35. 10.1186/1750-1172-6-35 - DOI - PMC - PubMed
    1. Breuer M., Guglielmi L., Zielonka M., Hemberger V., Kölker S., Okun J. G., et al. (2019). QDPR homologues in Danio rerio regulate melanin synthesis, early gliogenesis, and glutamine homeostasis. PLoS One 14:e0215162. 10.1371/journal.pone.0215162 - DOI - PMC - PubMed
    1. Casella C., Lipp I., Rosser A., Jones D. K., Metzler-Baddeley C. (2020). A critical review of white matter changes in Huntington’s disease. Mov. Disord. Off. J. Mov. Disord. Soc. 35 1302–1311. 10.1002/mds.28109 - DOI - PMC - PubMed