. 2021 Jun 17:12:668877.
doi: 10.3389/fneur.2021.668877. eCollection 2021.

Genetic Deletion of mGlu3 Metabotropic Glutamate Receptors Amplifies Ischemic Brain Damage and Associated Neuroinflammation in Mice

Affiliations

Genetic Deletion of mGlu3 Metabotropic Glutamate Receptors Amplifies Ischemic Brain Damage and Associated Neuroinflammation in Mice

Federica Mastroiacovo et al. Front Neurol. .

Abstract

Backgroud: Type-3 metabotropic glutamate (mGlu3) receptors are found in both neurons and glial cells and regulate synaptic transmission, astrocyte function, and microglial reactivity. Here we show that the genetic deletion of mGlu3 receptors amplifies ischemic brain damage and associated neuroinflammation in adult mice. An increased infarct size was observed in mGlu3-/- mice of both CD1 and C57Black strains 24 h following a permanent occlusion of the middle cerebral artery (MCA) as compared to their respective wild-type (mGlu3+/+ mice) counterparts. Increases in the expression of selected pro-inflammatory genes including those encoding interleukin-1β, type-2 cycloxygenase, tumor necrosis factor-α, CD86, and interleukin-6 were more prominent in the peri-infarct region of mGlu3-/- mice. In contrast, the expression of two genes associated with the anti-inflammatory phenotype of microglia (those encoding the mannose-1-phosphate receptor and the α-subunit of interleukin-4 receptor) and the gene encoding the neuroprotective factor, glial cell line-derived neurotrophic factor, was enhanced in the peri-infarct region of wild-type mice, but not mGlu3-/- mice, following MCA occlusion. In C57Black mice, the genetic deletion of mGlu3 receptors worsened the defect in the paw placement test as assessed in the contralateral forepaw at short times (4 h) following MCA occlusion. These findings suggest that mGlu3 receptors are protective against ischemic brain damage and support the way to the use of selective mGlu3 receptor agonists or positive allosteric modulators in experimental animal models of ischemic stroke.

Keywords: focal ischemia; knockout mice; mGlu3 receptors; neuroinflammation; pro-inflammatory genes.


Conflict of interest statement

The authors declare that the research was conducted in the absence of any commercial or financial relationships that could be construed as a potential conflict of interest.

Figures

Figure 1
Figure 1
Schematic representation of the permanent occlusion of the middle cerebral artery and regional topography of ischemic infarct.
Figure 2
Figure 2
Infarct size and expression of housekeeping genes in the infarct core of CD1 mGlu3+/+ and mGlu3−/− mice subjected to permanent middle cerebral artery (MCA) occlusion. Nissl staining of sequential coronal brain sections of mGlu3+/+ and mGlu3−/− mice 24 h following MCA occlusion is shown in (A). Quantification of the infarct volume is shown in (B), where values are means ± S.E.M. of 11–13 mice per group. *p < 0.05 vs. mGlu3+/+ mice (Student's t test; tx = 2.967). The infarct core region dissected for measurements of housekeeping genes is indicated in (C). Hmbs, Rn18s, and Rpl13 mRNA levels in the ipsilaeral and contralateral sides of the two genotypes are shown in (D), where values are means ± S.E.M. of five determinations. p < 0.05 (two-way ANOVA + Fisher's least significant difference) vs. the contralateral side of the same genotype (*) or the corresponding side of mGlu3+/+ mice (#). Hmbs: genotype, F1,16 = 19.34, p = 0.0004; side, F1,16 = 24.67, p = 0.0001; interaction, F1,16 = 1.396, p = 0.2546; Rn18s: genotype, F1,16 = 17.48, p = 0.0007; side, F1,16 = 88.85, p < 0.0001; interaction, F1,16 = 1.086, p = 0.3167; Rpl13: genotype, F1,16 = 12.73, p = 0.0026; side, F1,16 = 243.3, p > 0.0001; interaction, F1,16 = 0.0936, p = 0.7636.
Figure 3
Figure 3
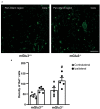
Iba1 immunostaining in the peri-infarct region and the corresponding contralateral region of CD1 mGlu3+/+ and mGlu3−/− mice subjected to middle cerebral artery occlusion. The density of Iba1+ cells was measured in three sections of the peri-infarct and contralateral regions of the two genotypes. Representative images are shown in (A). Values are means ± S.E.M. from five mice per group. #p < 0.05 vs. the peri-infarct region of mGlu3+/+ mice (two-way ANOVA + Fisher's least significant difference). Genotype, F1,16 = 11.22, p = 0.0041; side, F1,16 = 12.11, p = 0.0031; interaction, F1,16 = 0.6590, p = 0.4288. Scale bar = 50 mm.
Figure 4
Figure 4
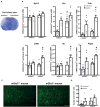
Expression of pro-inflammatory genes in the peri-infarct region and the corresponding contralateral region of CD1 mGlu3+/+ and mGlu3−/− mice subjected to middle cerebral artery (MCA) occlusion. The anatomical location of the dissected dorsomedial peri-infarct region and the corresponding contralateral region is shown in (A). The mRNA levels of the selected housekeeping and pro-inflammatory genes of the ipsilateral and contralateral sides of mGlu3+/+ and mGlu3−/− mice subjected to MCA occlusion is shown in (B). Values are means ± S.E.M. of five determinations. p < 0.05 (two-way ANOVA + Fisher's least significant difference) vs. the contralateral side of the same genotype (*) or the corresponding side of mGlu3+/+ mice (#). Rpl13: genotype, F1,16 = 3.652, p = 0.0741; side, F1,16 = 0.6079, p = 0.4470; interaction, F1,16 = 0.1461, p = 0.7074; Il1b: genotype, F1,16 = 15.26, p = 0.0013; side, F1,16 = 18.79, p = 0.0005; interaction, F1,16 = 1.756, p = 0.2038; Tnfa: genotype, F1,16 = 7.016, p = 0.017; side, F1,16 = 36.5, p > 0.0001; interaction, F1,16 = 1.11, p = 0.3078; Cd86: genotype, F1,16 = 4.826, p = 0.0432; side, F1,16 = 12.62, p = 0.0027; interaction, F1,16 = 0.0012, p = 0.97; Il6: genotype, F1,16 = 4.618, p = 0.0473; side, F1,16 = 4.584, p = 0.048; interaction, F1,16 = 2.142, p = 0.1627; Ptgs2: genotype, F1,16 = 10.09, p = 0.0012; side, F1,16 = 17.54, p = 0.0007; interaction, F1,16 = 0.0012, p = 0.97. Representative COX-2 immunostaining in the peri-infarct regions of the mGlu3+/+ and mGlu3−/− mice is shown in (C). The density of COX-2-expressing cells in three sections of the peri-infarct and contralateral regions of the two genotypes is shown in (D), where values are means ± S.E.M. from four mice per group. Statistical analysis was performed by two-way ANOVA + Fisher's least significant difference. Genotype, F1,14 = 2.284, p = 0.1529; side, F1,14 = 2.006, p = 0.1785; interaction, F1,14 = 0.001865, p = 0.966. Scale bar = 25 μm.
Figure 5
Figure 5
Expression of immunoregulatory, anti-inflammatory, and neuroprotective genes in the peri-infarct region of CD1 mGlu3+/+ and mGlu3−/− mice subjected to middle cerebral artery (MCA) occlusion. The mRNA levels of the selected immunoregulatory and anti-infammatory genes of the ipsilateral and contralateral sides of wild-type and mGlu3−/− mice subjected to MCA occlusion is shown in (A). The mRNA levels of the genes encoding GDNF and TGF-β are shown in (B). Values are means ± S.E.M. of five determinations. p < 0.05 (two-way ANOVA + Fisher's LSD) vs. the contralateral side of the same genotype (*) or the corresponding side of mGlu3+/+ mice (#). Arg1: genotype, F1,16 = 0.2441, p = 0.628; side, F1,16 = 3.639, p = 0.0746; interaction, F1,16 = 14.98, p = 0.0014; Mrc1: genotype, F1,16 = 43.5, p < 0.0001; side, F1,16 = 0.1896, p = 0.6691; interaction, F1,16 = 11.97, p = 0.0032; Il4ra: genotype, F1,16 = 0.037, p = 0.848; side, F1,16 = 20.81, p = 0.0003; interaction, F1,16 = 11.19, p = 0.0041; Socs3: genotype, F1,16 = 4.619, p = 0.0473; side, F1,16 = 22.29, p = 0.0002; interaction, F1,16 = 1.413, p = 0.252; Gdnf: genotype, F1,16 = 16.19, p = 0.001; side, F1,16 = 5.731, p = 0.029; interaction, F1,16 = 3.118, p = 0.0965; Tgfb: genotype, F1,16 = 3.771, p = 0.0472; side, F1,16 = 3.18, p = 0.093; interaction, F1,16 = 4.621, p = 0.0472.
Figure 6
Figure 6
Infarct size and performance in the paw placement test of C57Black mGlu3+/+ and mGlu3−/− mice subjected to permanent middle cerebral artery (MCA) occlusion. Nissl staining of sequential coronal brain sections of mGlu3+/+ and mGlu3−/− mice 24 h following MCA occlusion is shown in (A). Quantification of the infarct volume is shown in (B), where values are means ± S.E.M. of 13–16 mice per group. *p < 0.05 vs. mGlu3+/+ mice (Student's t test; tx = 3.501). The paw placement scores of the contralateral and ipsilateral forepaws are shown in (C,D), respectively. Means ± S.E.M. are indicated. Contralateral side: *p < 0.05 vs. the corresponding basal values (time 0) (Friedman non-parametric ANOVA test + Dunn's; Friedman statistical value = 20.65) or #p < 0.05 vs. values of mGlu3+/+ mice at 4 h (one-tailed Mann–Whitney non-parametric test).

References

    1. Rossi DJ, Brady JD, Mohr C. Astrocyte metabolism and signaling during brain ischemia. Nat Neurosci. (2007) 10:1377–86. 10.1038/nn2004 - DOI - PMC - PubMed
    1. Ginsberg MD. Adventures in the pathophysiology of brain ischemia: penumbra, gene expression, neuroprotection: the 2002 Thomas Willis lecture. Stroke. (2003) 34:214–23. 10.1161/01.STR.0000048846.09677.62 - DOI - PubMed
    1. Zhao W, Belayev L, Ginsberg MD. Transient middle cerebral artery occlusion by intraluminal suture: II. Neurological deficits, and pixel-based correlation of histopathology with local blood flow and glucose utilization. J Cereb Blood Flow Metab. (1997) 17:1281–90. 10.1097/00004647-199712000-00003 - DOI - PubMed
    1. Choi DW. Methods for antagonizing glutamate neurotoxicity. Cerebrovasc Brain Metab Rev. (1990) 2:105–47. - PubMed
    1. Friberg H, Wieloch T. Mitochondrial permeability transition in acute neurodegeneration. Biochimie. (2002) 84:241–50. 10.1016/S0300-9084(02)01381-0 - DOI - PubMed

LinkOut - more resources