

Lipoprotein-Associated Phospholipase A2: A Novel Contributor in Sjögren's Syndrome-Related Lymphoma?
- PMID: 34220834
- PMCID: PMC8253309
- DOI: 10.3389/fimmu.2021.683623
Lipoprotein-Associated Phospholipase A2: A Novel Contributor in Sjögren's Syndrome-Related Lymphoma?
Abstract
Background: B-cell non-Hodgkin's lymphoma (B-NHL) is one of the major complications of primary Sjögren's syndrome (SS). Chronic inflammation and macrophages in SS minor salivary glands have been previously suggested as significant predictors for lymphoma development among SS patients. Lipoprotein-associated phospholipase A2 (Lp-PLA2)-a product mainly of tissue macrophages-is found in the circulation associated with lipoproteins and has been previously involved in cardiovascular, autoimmune, and malignant diseases, including lymphoma.
Objective: The purpose of the current study was to investigate the contributory role of Lp-PLA2 in B-NHL development in the setting of primary SS.
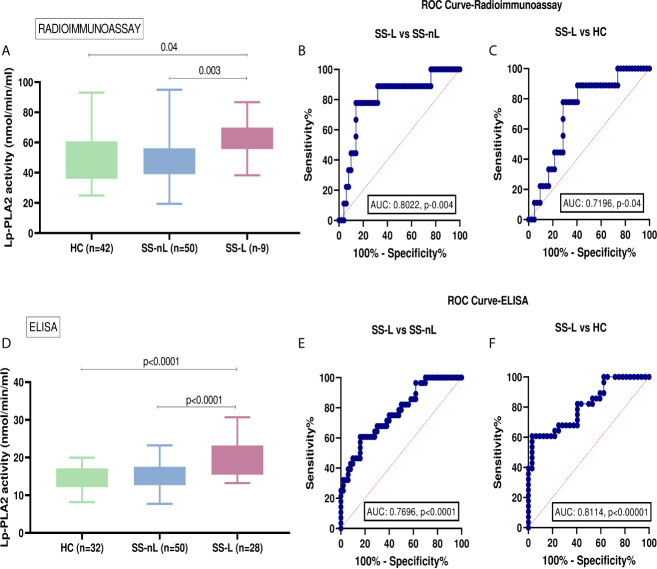
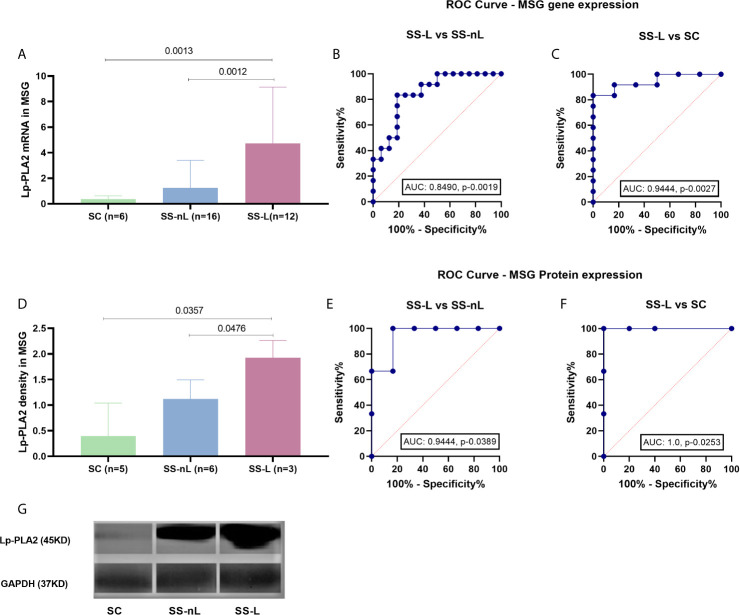
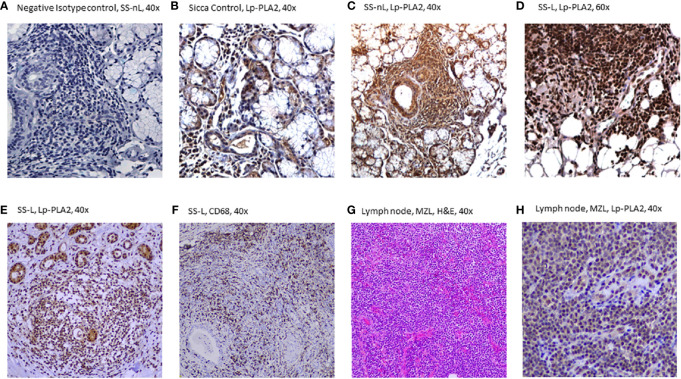
Methods: Lp-PLA2 activity in serum samples collected from 50 primary SS patients with no lymphoma (SS-nL), 9 primary SS patients with lymphoma (SS-L), and 42 healthy controls (HC) was determined by detection of [3H]PAF degradation products by liquid scintillation counter. Moreover, additional sera from 50 SS-nL, 28 SS-L, and 32 HC were tested for Lp-PLA2 activity using a commercially available ELISA kit. Lp-PLA2 mRNA, and protein expression in minor salivary gland (MSG) tissue samples derived from SS-nL, SS-L patients, and sicca controls (SC) were analyzed by real-time PCR, Western blot, and immunohistochemistry.
Results: Serum Lp-PLA2 activity was significantly increased in SS-L compared to both SS-nL and HC by two independent methods implemented [mean ± SD (nmol/min/ml): 62.0 ± 13.4 vs 47.6 ± 14.4 vs 50.7 ± 16.6, p-values: 0.003 and 0.04, respectively, and 19.4 ± 4.5 vs 15.2 ± 3.3 vs 14.5 ± 3.0, p-values: <0.0001, in both comparisons]. ROC analysis revealed that the serum Lp-PLA2 activity measured either by radioimmunoassay or ELISA has the potential to distinguish between SS-L and SS-nL patients (area under the curve [AUC]: 0.8022, CI [95%]: 0.64-0.96, p-value: 0.004 for radioimmunoassay, and AUC: 0.7696, CI [95%]: 0.66-0.88, p-value: <0.0001, for ELISA). Lp-PLA2 expression in MSG tissues was also increased in SS-L compared to SS-nL and SC at both mRNA and protein level. ROC analysis revealed that both MSG mRNA and protein Lp-PLA2 have the potential to distinguish between SS-nL and SS-L patients (area under the curve [AUC] values of 0.8490, CI [95%]: 0.71-0.99, p-value: 0.0019 and 0.9444, CI [95%]: 0.79-1.00, p- value: 0.0389 respectively). No significant difference in either serum Lp-PLA2 activity or MSG tissue expression was observed between SS-nL and HC.
Conclusions: Lp-PLA2 serum activity and MSG tissue mRNA/protein expression could be a new biomarker and possibly a novel therapeutic target for B-cell lymphoproliferation in the setting of SS.
Keywords: Sjögren’s syndrome; lipoprotein-associated phospholipase A2 (Lp-PLA2); lymphomagenesis; novel therapeutic target; serum biomarker.
Copyright © 2021 Nezos, Skarlis, Psarrou, Markakis, Garantziotis, Papanikolaou, Gravani, Voulgarelis, Tzioufas, Koutsilieris, Moutsopoulos, Kotsifaki and Mavragani.
Conflict of interest statement
The authors declare that the research was conducted in the absence of any commercial or financial relationships that could be construed as a potential conflict of interest.
Figures
Similar articles
-
Type I and II interferon signatures in Sjogren's syndrome pathogenesis: Contributions in distinct clinical phenotypes and Sjogren's related lymphomagenesis.J Autoimmun. 2015 Sep;63:47-58. doi: 10.1016/j.jaut.2015.07.002. Epub 2015 Jul 14. J Autoimmun. 2015. PMID: 26183766 Free PMC article.
-
Serum, but Not Saliva, CXCL13 Levels Associate With Infiltrating CXCL13+ Cells in the Minor Salivary Gland Lesions and Other Histologic Parameters in Patients With Sjögren's Syndrome.Front Immunol. 2021 Aug 17;12:705079. doi: 10.3389/fimmu.2021.705079. eCollection 2021. Front Immunol. 2021. PMID: 34484201 Free PMC article.
-
Interferon (IFN)-stimulated gene 15: A novel biomarker for lymphoma development in Sjögren's syndrome.J Autoimmun. 2021 Sep;123:102704. doi: 10.1016/j.jaut.2021.102704. Epub 2021 Jul 20. J Autoimmun. 2021. PMID: 34298409
-
Predictive markers of lymphomagenesis in Sjögren's syndrome: From clinical data to molecular stratification.J Autoimmun. 2019 Nov;104:102316. doi: 10.1016/j.jaut.2019.102316. Epub 2019 Aug 17. J Autoimmun. 2019. PMID: 31431317 Review.
-
[Lymphoproliferative disorders in Sjögren's syndrome].Otolaryngol Pol. 2005;59(4):559-64. Otolaryngol Pol. 2005. PMID: 16273862 Review. Polish.
Cited by
-
Autoimmune disease and risk of lymphoma: analysis from real-world data and Mendelian randomization study.BMC Cancer. 2025 Feb 25;25(1):351. doi: 10.1186/s12885-025-13754-4. BMC Cancer. 2025. PMID: 40000981 Free PMC article.
-
Explore the possible influence of Sjogren's syndrome on thyroid cancer: A literature data mining and meta-analysis.PLoS One. 2025 Feb 10;20(2):e0318747. doi: 10.1371/journal.pone.0318747. eCollection 2025. PLoS One. 2025. PMID: 39928612 Free PMC article.
References
Publication types
MeSH terms
Substances
LinkOut - more resources
Full Text Sources
Medical
Miscellaneous