. 2021 Jun 18:12:691997.
doi: 10.3389/fimmu.2021.691997. eCollection 2021.

Phosphoinositide 3-Kinase p110 Delta Differentially Restrains and Directs Naïve Versus Effector CD8+ T Cell Transcriptional Programs

Affiliations

Phosphoinositide 3-Kinase p110 Delta Differentially Restrains and Directs Naïve Versus Effector CD8+ T Cell Transcriptional Programs

Laura Spinelli et al. Front Immunol. .

Abstract

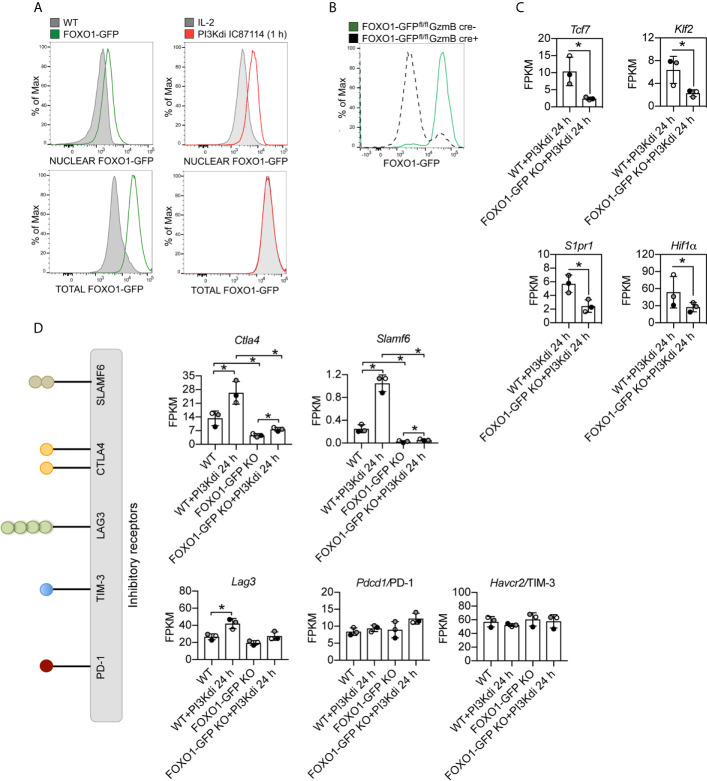
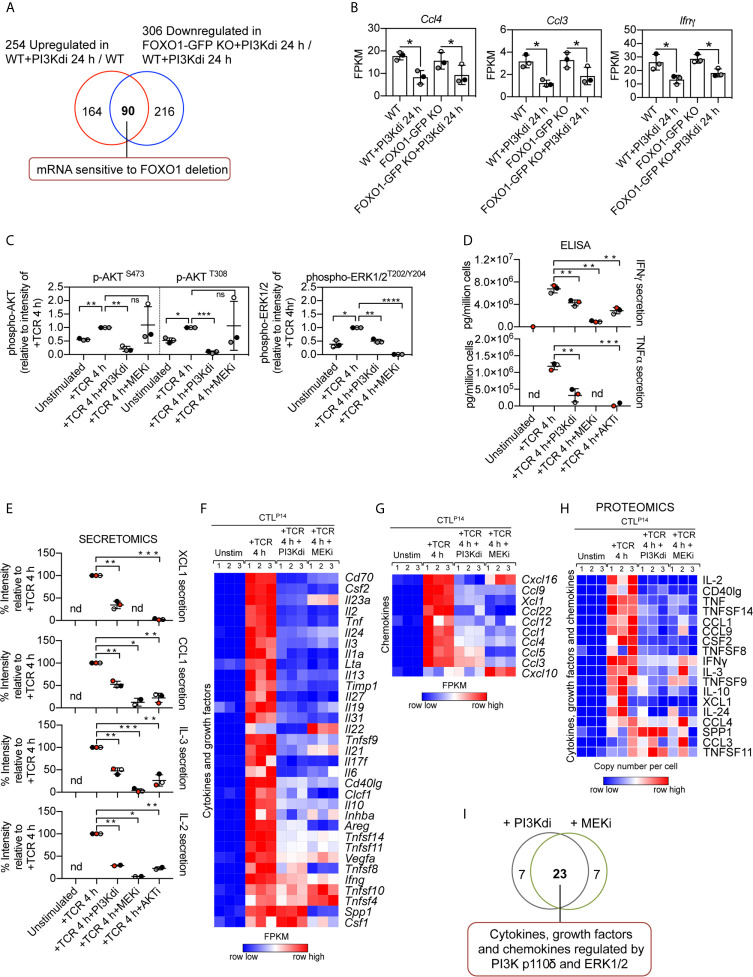
Phosphoinositide 3-kinase p110 delta (PI3K p110δ) is pivotal for CD8+ T cell immune responses. The current study explores PI3K p110δ induction and repression of antigen receptor and cytokine regulated programs to inform how PI3K p110δ directs CD8+ T cell fate. The studies force a revision of the concept that PI3K p110δ controls metabolic pathways in T cells and reveal major differences in PI3K p110δ regulated transcriptional programs between naïve and effector cytotoxic T cells (CTL). These differences include differential control of the expression of cytolytic effector molecules and costimulatory receptors. Key insights from the work include that PI3K p110δ signalling pathways repress expression of the critical inhibitory receptors CTLA4 and SLAMF6 in CTL. Moreover, in both naïve and effector T cells the dominant role for PI3K p110δ is to restrain the production of the chemokines that orchestrate communication between adaptive and innate immune cells. The study provides a comprehensive resource for understanding how PI3K p110δ uses multiple processes mediated by Protein Kinase B/AKT, FOXO1 dependent and independent mechanisms and mitogen-activated protein kinases (MAPK) to direct CD8+ T cell fate.

Keywords: CD8+ T cells; PI3K; TCR signalling; chemokines; cytokines; p110δ; transcriptomics.


Conflict of interest statement

The authors declare that the research was conducted in the absence of any commercial or financial relationships that could be construed as a potential conflict of interest.

Figures

Figure 1
Figure 1
Remodelling of CD8+ T cell transcriptome in response to immune activation. RNA sequencing was used to characterise the transcriptome of sorted ex vivo naïve or 24 h gp33–41 peptide activated (TCR) P14 CD8+ T cells. (A) Volcano plot of mRNA expression of 24 h TCR activated versus naïve CD8+ T cells. mRNA significantly different between the two populations (fold change >2 or <0.5; adj. P values <0.05) shown in red. The horizontal dashed lines indicate an adj. P value of 0.05 shown as −log10 while vertical dashed lines indicate a fold change of 2 and 0.5 shown as log2. The vertical solid line indicates the mean of log2 ratio. (B) Enrichment analysis for biological processes for mRNA whose expression was induced upon TCR activation. The top 5 processes are presented. (C) Expression profile (FPKM) of amino acid, lactate and glucose transporters. FPKM shown as the mean of three biological replicates ± standard deviation. * adj. P <0.05 and fold change >2 or <0.5. (D) Volcano plot highlighting changes in transcription factor expression in response to 24 h TCR activation (GO:0003700 DNA binding transcription factor activity). Annotated mRNA significantly different between the two populations compared are shown in red (fold change >2 or <0.5; adj. P value <0.05). Transcription factors that showed no significant differences are shown in yellow. (E) Volcano plot highlighting mRNA expression of cytokines, growth factors and chemokines whose expression was induced in response to 24 h TCR activation (GO:0005125 Cytokine activity and GO:0008009 Chemokine activity). Annotated cytokines and growth factors (green) and annotated chemokines (pink) that were significantly upregulated upon TCR stimulation (fold change >2 or <0.5; adj. P value <0.05). Input data for highlighted mRNA in (D, E) are listed in Supplementary Datasheet 1 .
Figure 2
Figure 2
PI3K p110δ control of antigen receptor transcriptional programs in naïve CD8+ T cells. P14 CD8+ T cells were activated in vitro with the gp33–41 peptide in the presence or absence of the PI3K p110δ inhibitor IC87114 (PI3Kdi) for 24 h. (A) Impact of PI3K p110δ inhibition on mRNA expression. Volcano plot shows the ratio of PI3K p110δ treated versus untreated TCR activated CD8+ T cells. mRNA significantly different between the two populations (fold change >2 or <0.5; adj. P values <0.05) shown in red. The horizontal dashed lines indicate an adj. P value of 0.05 shown as −log10 while vertical dashed lines indicate a fold change of 2 and 0.5 shown as log2. The vertical solid line indicates the mean of log2 ratio. (B) Heatmap of CD8+ T cells naïve, TCR activated 24 h ± PI3K p110δ inhibitor (PI3Kdi) transcriptomes. Heatmap was arranged with Ifnγ positioned at the top and shows the relative mRNA abundance graded from low (blue) to high (red) per row. Input data for the heatmap are listed in Supplementary Datasheet 1 . (C) Summed mRNA expression (FPKM) of genes annotated as glycolytic process (GO:0006096), and one-carbon metabolic process (GO:0006730). FPKM represented as the mean of three biological replicates ± standard deviation. Input data are listed in Supplementary Datasheet 1 . (D) Heatmap of mRNA encoding enzymes that mediate fatty acid metabolism (Fatty acid metabolic process GO:0006631). The heatmap shows the relative mRNA abundance graded from low (blue) to high (red) per row. Input data for the heatmap are listed in Supplementary Datasheet 1 . (E, H, J) mRNA expression levels (FPKM) of Myc, Hif1α, Tnfrsf9/4-1BB, Cd28, Icos, Gzmb and Prf1. FPKM shown as the mean of three biological replicates ± standard deviation. * adj. P <0.05 and fold change >2 or <0.5. (F) Heatmap of more than 300 mRNA annotated as DNA binding/transcription factor activity or added manually (GO:0003700). Heatmap was arranged with Tbx21 mRNA positioned at the top and shows the relative mRNA abundance graded from low (blue) to high (red) per row. Input data for the heatmap are listed in Supplementary Datasheet 1 . (G) Enrichment analysis for biological processes for mRNA whose expression was reduced in TCR activated CD8+ T cells by PI3K p110δ inhibition. The top 5 processes are presented. (I) Volcano plot highlighting the effect of PI3K p110δ inhibition on mRNA expression of cytokines, growth factors and chemokines induced in response to 24 h TCR activation (GO:0005125 Cytokine activity and GO:0008009 Chemokine activity). Shown in green are annotated cytokines and growth factors and shown in pink are annotated chemokines that were significantly regulated in response to PI3K p110δ inhibition (fold change >2 or <0.5; adj. P value <0.05). Cytokines, growth factors and chemokines that showed no significant differences are shown in yellow. Input data are listed in Supplementary Datasheet 1 .
Figure 3
Figure 3
PI3K p110δ control of antigen receptor transcriptional programs in effector cytotoxic CD8+ T cells. P14 CTL were either left unstimulated or TCR retriggered with the LCMV peptide in the presence or absence of the PI3K p110δ inhibitor IC87114 (PI3Kdi) for 4 h and the transcriptome analysed by RNAseq. (A) Impact of TCR retriggering on mRNA expression in CTL. Volcano plot showing the ratio for 4 h TCR retriggered versus unstimulated CTL. mRNA significantly different between the two populations (fold change >2 or <0.5; adj. P values <0.05) shown in red. The horizontal dashed lines indicate an adj. P value of 0.05 shown as −log10 while vertical dashed lines indicate a fold change of 2 and 0.5 shown as log2. The vertical solid line indicates the mean of log2 ratio. (B, D) GO term enrichment analysis for biological processes for mRNA whose expression was up or downregulated by TCR retriggering. The top 5 processes are presented. (C) Volcano plot of cytokines, growth factors and chemokines mRNA whose expression was induced in CTL by 4 h TCR retriggering (GO:0005125 Cytokine activity and GO:0008009 Chemokine activity). Annotated cytokines and growth factors (green) and annotated chemokines (pink) that were significantly upregulated upon TCR retriggering (fold change >2 or <0.5; adj. P value <0.05). Input data are listed in Supplementary Datasheet 2 . (E) Volcano plot showing the ratio of TCR stimulated CTL ± PI3K p110δ inhibitor (PI3Kdi). In red mRNA significantly different between the two populations (fold change >2 or <0.5; adj. P values <0.05). The horizontal dashed lines indicate an adj. P value of 0.05 shown as −log10 while vertical dashed lines indicate a fold change of 2 and 0.5 shown as log2. The vertical solid line indicates the mean of log2 ratio. (F) Enriched GO terms for mRNA whose expression was reduced in TCR retriggered CTL in the absence of PI3K p110δ activity. The top 5 biological processes are presented. (G, H) Heatmaps of mRNA encoding (G) cytokines, growth factors and (H) chemokines annotated as Cytokine activity (GO:0005125) and Chemokine activity (GO:0008009). The heatmaps show the relative mRNA abundance graded from low (blue) to high (red) per row. Input data for heatmaps are listed in Supplementary Datasheet 2 . (I) The proteome of P14 CTL either left unstimulated or TCR retriggered for 4 h in the presence or absence of the PI3K p110δ inhibitor IC87114 (PI3Kdi) was analysed by mass spectrometry. Volcano plot shows fold change in protein copy number between TCR retriggered CTL lacking PI3K p110δ activity and TCR retriggered CTL, highlighting the effect of PI3K p110δ inhibition on the expression of TCR induced cytokine, growth factor and chemokine proteins. In green annotated cytokines and growth factors and in pink annotated chemokines that were significantly regulated in response to PI3K p110δ inhibition (fold change >2 or <0.5; P value <0.05). In yellow cytokines, growth factors and chemokines that showed no significant changes. Input data are listed in Supplementary Datasheet 4 . (J) mRNA expression levels (FPKM) of Gzmb and Prf1. FPKM shown as the mean of three biological replicates ± standard deviation. *adj. P <0.05 and fold change >2 or <0.5. (K) Mean protein copy number per cell of granzyme B (GZMB) calculated using the proteomic ruler method as described in Materials and Methods. *P <0.05 and fold change >2 or <0.5. (L) Granzyme B levels in supernatants of P14 CTL unstimulated and TCR retriggered in the presence or absence of PI3K p110δ inhibitor (PI3Kdi) determined by ELISA. Data shown as the mean of four biological replicates ± standard deviation and statistical analysis calculated by unpaired, unequal variance t-test with Welch’s correction. The P values are considered asfollow: ****P < 0.0001 and ‘ns’ not statistically significant.
Figure 4
Figure 4
Impact of sustained PI3K p110δ inhibition on CTL transcriptional programs. WT CTL were maintained for 24 h in the presence or absence of the PI3K p110δ inhibitor IC87114 (PI3Kdi) and RNAseq was used to characterise their transcriptome. (A) Forward/side scatter flow cytometry analysis of IL-2/IL-12 maintained or 24 h inhibitor treated WT CTL. (B) Percentage of cell death at the end of the culture quantified by flow cytometry as proportion of cells DAPI positive. (C) Volcano plot showing the ratio for 24 h PI3K p110δ inhibitor (PI3Kdi) treated cells versus untreated WT CTL. mRNA significantly different between the two populations shown in red (fold change >1.5 or <0.67; adj. P values <0.05). The horizontal dashed lines indicate an adj. P value of 0.05 shown as −log10 while vertical dashed lines indicate a fold change of 1.5 and 0.67 shown as log2. The vertical solid line indicates the mean of log2 ratio. (D–F) Histograms showing mRNA expression levels (FPKM) for Ifnγ, Ccl3, Ccl4, Tnfrsf9/4-1BB, Icos, Gzmb and Prf1. FPKM shown as the mean of three biological replicates ± standard deviation. (G) Percentage of the impact of PI3K p110δ inhibition on the total transcriptome of TCR activated naïve (left) and effector CD8+ T cells (right). (H) GO term enrichment analysis for biological processes for mRNA whose expression was induced by sustained inhibition of PI3K p110δ activity. The top 5 processes are presented. (I) Heatmap of known FOXO1 targets in WT CTL cultured for 24 h in the presence or absence of PI3K p110δ inhibitor (PI3Kdi): Sell, Il7r, S1pr1, Tcf7, Ccr7 and Klf2. The relative mRNA abundance is graded from low (blue) to high (red) per row. Input data for the heatmap are listed in Supplementary Datasheet 3 . (J, K) mRNA expression levels (FPKM) of Ctla4 in (J) WT CTL ± PI3K p110δ inhibitor (PI3Kdi) for 24 h and (K) in TCR stimulated CTL ± PI3K p110δ inhibitor (PI3Kdi) for 4 h. FPKM shown as the mean of three biological replicates ± standard deviation. (L) mRNA expression levels (FPKM) for inhibitory receptors Pdcd1/PD-1, Havcr2/TIM-3, Lag3 and Slamf6 in WT CTL ± PI3K p110δ inhibitor (PI3Kdi). (D, J, K, L): *adj. P <0.05 and fold change >1.5 or <0.67.
Figure 5
Figure 5
Ctla4 and Slamf6 mRNA are modulated by FOXO1 in CTL. FOXO1-GFP null and WT CTL maintained for 24 h in the presence or absence of the PI3K p110δ inhibitor IC87114 (PI3Kdi) were subjected to RNAseq and their transcriptomes compared. (A) Nuclear localisation of FOXO1-GFP analysed by flow cytometry in IL-2 maintained CTL and after 1 h treatment with the PI3K p110δ inhibitor. Left panel: purified nuclei from WT CTL (expressing untagged FOXO1) and FOXO1-GFP CTL were compared. The green line indicates detection of FOXO1-GFP expression level in the nucleus (top) or total cell (bottom). Right panel: purified nuclei (top) or total cells (bottom) from FOXO1-GFP CTL either maintained in IL-2 (grey filled line) or treated with PI3K p110δ inhibitor for 1 h (red line) were compared. The right shift of the red line compared to the grey filled line indicates an increased level of FOXO1-GFP in the nuclei of PI3K p110δ inhibitor treated cells (top right), while there is no change in the total FOXO1 protein level (bottom right). Graph of treated cells is representative of three biological replicates. (B) Representative histogram showing the deletion of FOXO1-GFP quantified by flow cytometry in CTL generated from FOXO1-GFPfl/flGzmB cre+ (grey dashed line FOXO1-GFP KO) versus FOXO1-GFPfl/flGzmB cre− (green solid line FOXO1-GFP) mice. (C) mRNA expression levels (FPKM) of Tcf7, Klf7, S1pr1 and Hif1α in WT and FOXO1-GFP KO CTL lacking PI3K p110δ activity. (D) Histograms showing mRNA expression levels (FPKM) for inhibitory receptors Ctla4, Slamf6, Lag3, Pdcd4/PD-1 and Havcr2/TIM3 in WT and FOXO1-GFP KO CTL ± PI3K p110δ inhibitor (PI3Kdi). (C, D) FPKM shown as the mean of three biological replicates ± standard deviation. *adj. P <0.05 and fold change >1.5 or <0.67.
Figure 6
Figure 6
Contribution of PKB/AKT, FOXO1 and ERK1/2 to the control of cytokine and chemokine production in CTL. (A) Venn diagram showing the overlap in the number of mRNA whose expression was induced by sustained PI3K p110δ inhibition in WT CTL and reduced in treated FOXO1-GFP KO CTL versus WT treated CTL. (B) mRNA expression levels (FPKM) of Ccl4, Ccl3 and Ifnγ in WT and FOXO1-GFP KO CTL ± PI3K p110δ inhibitor. *adj. P <0.05 and fold change >1.5 or <0.67. (C) Quantification of phosphorylated AKT (S473 and T308) and ERK1/2 (T202/Y204) in CTL in response to TCR stimulation in the presence or absence of PI3K p110δ (PI3Kdi) or MEK (MEKi) inhibitor assayed by western blot ( Supplementary Figure 7A ). (D) Levels of Interferon gamma (IFNγ) and Tumour necrosis factor alpha (TNFα) present in the supernatant of P14 CTL unstimulated and TCR retriggered in the presence or absence of either PI3K p110δ (PI3Kdi), MEK (MEKi) or AKT (AKTi) inhibitor determined by ELISA. (E) Levels of XCL1, CCL1, IL-3 and IL-2 protein secreted in the supernatant of unstimulated, TCR stimulated and TCR stimulated CTL in the presence of either PI3K p110δ (PI3Kdi), MEK (MEKi) or AKT (AKTi) inhibitor assayed by mass spectrometry. Transcriptome and proteome of P14 CTL unstimulated and TCR retriggered in the presence or absence of either PI3K p110δ (PI3Kdi) or MEK (MEKi) inhibitor were characterised by RNAseq and mass spectrometry respectively. Impact of PI3K p110δ and ERK1/2 inhibition on TCR induced cytokines and chemokines mRNA and protein expression was assessed. (F, G) Heatmaps showing mRNA encoding for annotated (F) cytokines, growth factors and (G) chemokines (Cytokine activity GO:0005125 and Chemokine activity GO:0008009). (H) Heatmap of proteins annotated as cytokines, growth factors and chemokines. Heatmaps show the relative mRNA abundance or the relative protein abundance graded from low (blue) to high (red) per row. Input data for heatmaps are listed in Supplementary Datasheets 2 (F, G) and 4 (H). (I) Overlap in the number of cytokine, growth factor and chemokine mRNA regulated by both PI3K p110δ and ERK1/2. Data in (C–E) shown as the mean of three biological replicates ± standard deviation and statistical analysis is calculated by unpaired, unequal variance t-test with Welch’s correction. The P values are considered as follow: *P <0.05, **P <0.01, ***P <0.001, ****P <0.0001. 'ns' not statistically significant.

Similar articles

Cited by

References

    1. Curtsinger JM, Mescher MF. Inflammatory Cytokines as a Third Signal for T Cell Activation. Curr Opin Immunol (2010) 22(3):333–40. 10.1016/j.coi.2010.02.013 - DOI - PMC - PubMed
    1. Cantrell D. Signaling in Lymphocyte Activation. Cold Spring Harb Perspect Biol (2015) 7(6):a018788. 10.1101/cshperspect.a018788 - DOI - PMC - PubMed
    1. Costello PS, Gallagher M, Cantrell DA. Sustained and Dynamic Inositol Lipid Metabolism Inside and Outside the Immunological Synapse. Nat Immunol (2002) 3(11):1082–9. 10.1038/ni848 - DOI - PubMed
    1. Garcon F, Patton DT, Emery JL, Hirsch E, Rottapel R, Sasaki T, et al. . CD28 Provides T-Cell Costimulation and Enhances PI3K Activity at the Immune Synapse Independently of Its Capacity to Interact With the p85/p110 Heterodimer. Blood (2008) 111(3):1464–71. 10.1182/blood-2007-08-108050 - DOI - PubMed
    1. Stark AK, Chandra A, Chakraborty K, Alam R, Carbonaro V, Clark J, et al. . PI3Kdelta Hyper-Activation Promotes Development of B Cells That Exacerbate Streptococcus Pneumoniae Infection in an Antibody-Independent Manner. Nat Commun (2018) 9(1):3174. 10.1038/s41467-018-05674-8 - DOI - PMC - PubMed

Publication types

Substances