

CD32+CD4+ T Cells Sharing B Cell Properties Increase With Simian Immunodeficiency Virus Replication in Lymphoid Tissues
- PMID: 34220857
- PMCID: PMC8242952
- DOI: 10.3389/fimmu.2021.695148
CD32+CD4+ T Cells Sharing B Cell Properties Increase With Simian Immunodeficiency Virus Replication in Lymphoid Tissues
Abstract
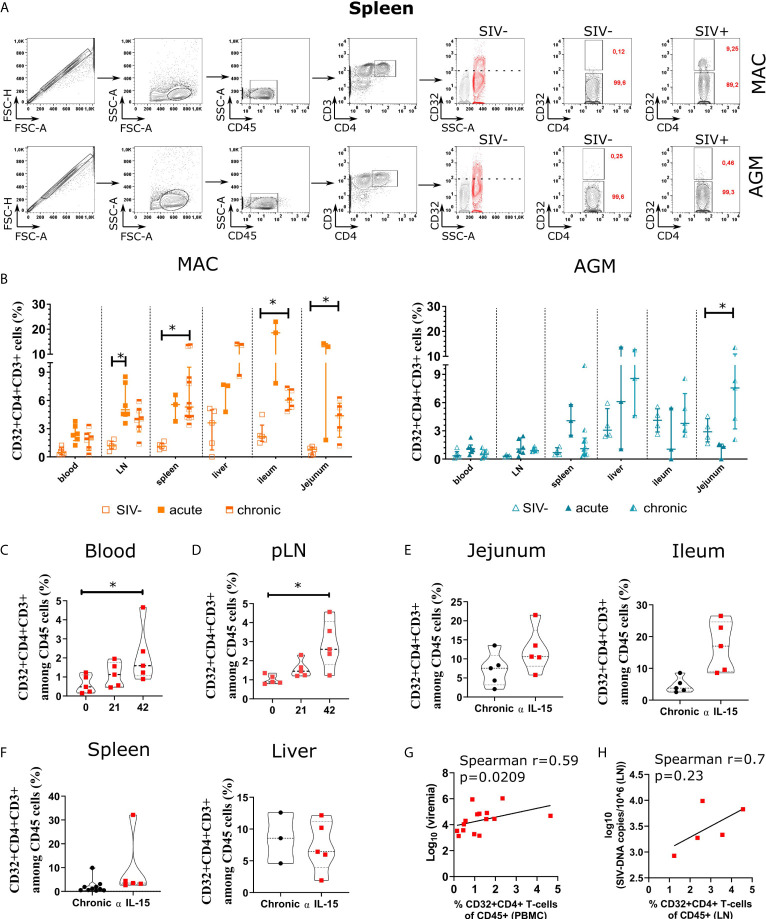
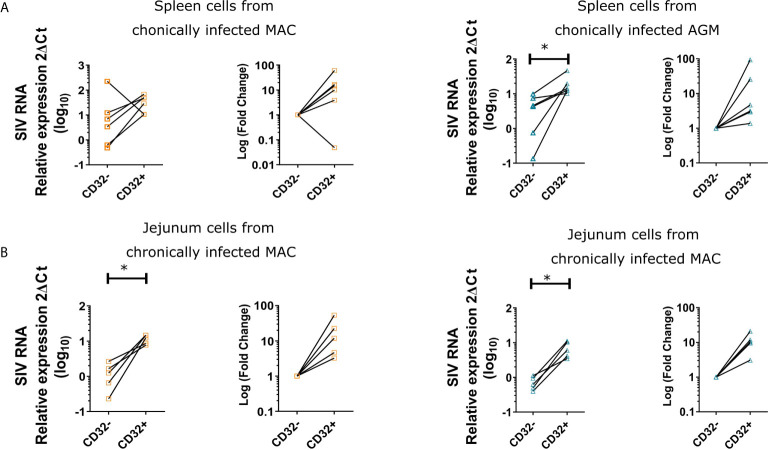
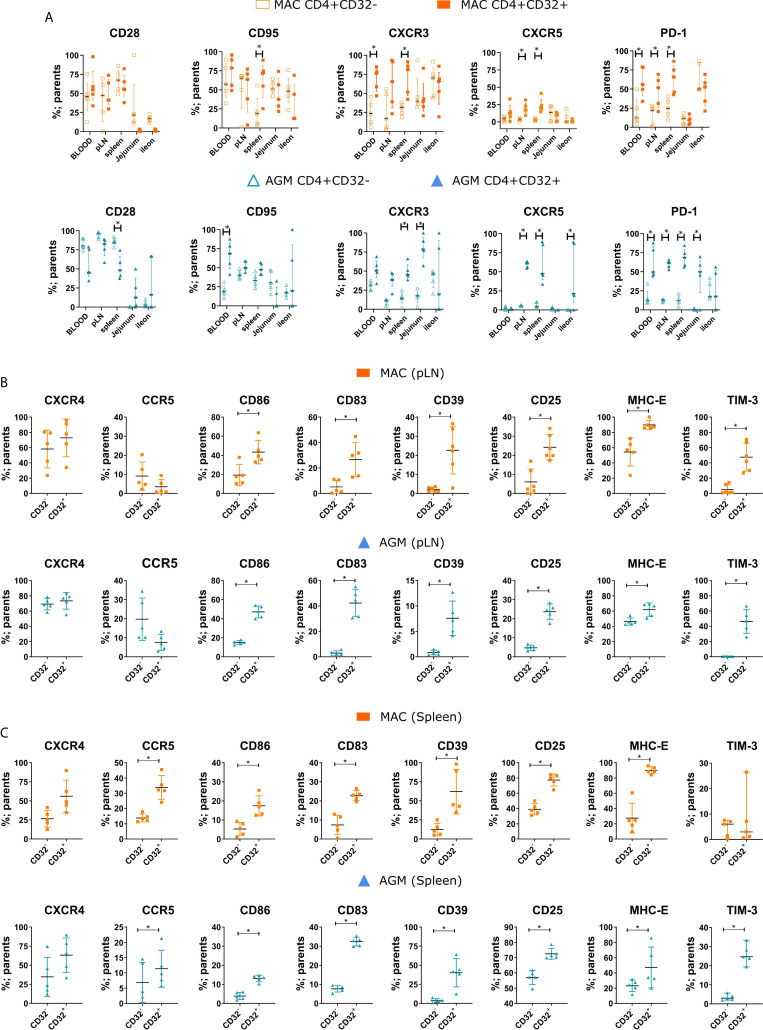
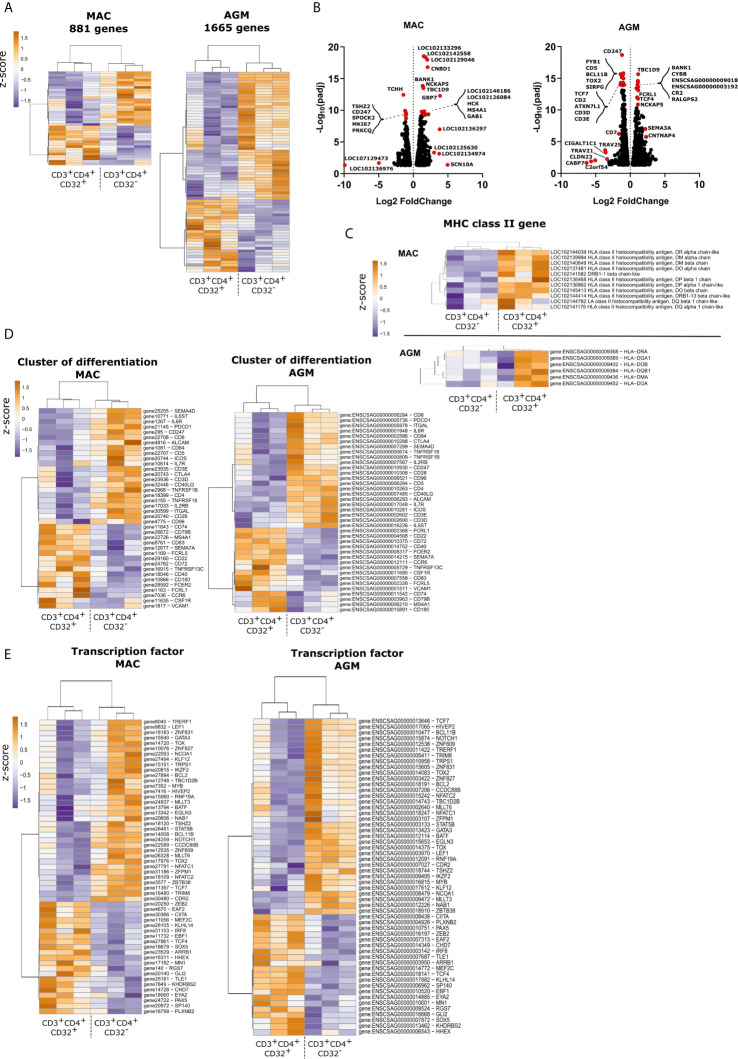
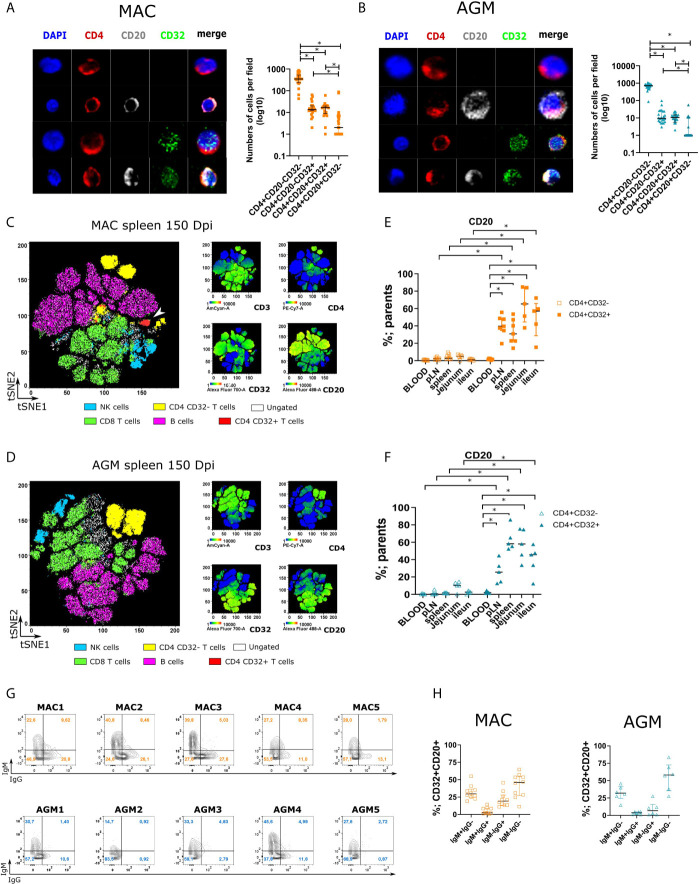
CD4 T cell responses constitute an important component of adaptive immunity and are critical regulators of anti-microbial protection. CD4+ T cells expressing CD32a have been identified as a target for HIV. CD32a is an Fcγ receptor known to be expressed on myeloid cells, granulocytes, B cells and NK cells. Little is known about the biology of CD32+CD4+ T cells. Our goal was to understand the dynamics of CD32+CD4+ T cells in tissues. We analyzed these cells in the blood, lymph nodes, spleen, ileum, jejunum and liver of two nonhuman primate models frequently used in biomedical research: African green monkeys (AGM) and macaques. We studied them in healthy animals and during viral (SIV) infection. We performed phenotypic and transcriptomic analysis at different stages of infection. In addition, we compared CD32+CD4+ T cells in tissues with well-controlled (spleen) and not efficiently controlled (jejunum) SIV replication in AGM. The CD32+CD4+ T cells more frequently expressed markers associated with T cell activation and HIV infection (CCR5, PD-1, CXCR5, CXCR3) and had higher levels of actively transcribed SIV RNA than CD32-CD4+T cells. Furthermore, CD32+CD4+ T cells from lymphoid tissues strongly expressed B-cell-related transcriptomic signatures, and displayed B cell markers at the cell surface, including immunoglobulins CD32+CD4+ T cells were rare in healthy animals and blood but increased strongly in tissues with ongoing viral replication. CD32+CD4+ T cell levels in tissues correlated with viremia. Our results suggest that the tissue environment induced by SIV replication drives the accumulation of these unusual cells with enhanced susceptibility to viral infection.
Keywords: CD20; CD32; CD4; HIV; LN; SIV; intestine; natural host.
Copyright © 2021 Huot, Rascle, Planchais, Contreras, Passaes, Le Grand, Beignon, Kornobis, Legendre, Varet, Saez-Cirion, Mouquet, Jacquelin and Müller-Trutwin.
Conflict of interest statement
The authors declare that the research was conducted in the absence of any commercial or financial relationships that could be construed as a potential conflict of interest.
Figures
Similar articles
-
Lymph-Node-Based CD3+ CD20+ Cells Emerge from Membrane Exchange between T Follicular Helper Cells and B Cells and Increase Their Frequency following Simian Immunodeficiency Virus Infection.J Virol. 2023 Jun 29;97(6):e0176022. doi: 10.1128/jvi.01760-22. Epub 2023 May 23. J Virol. 2023. PMID: 37223960 Free PMC article.
-
Persistent Simian Immunodeficiency Virus Infection Causes Ultimate Depletion of Follicular Th Cells in AIDS.J Immunol. 2015 Nov 1;195(9):4351-7. doi: 10.4049/jimmunol.1501273. Epub 2015 Sep 25. J Immunol. 2015. PMID: 26408660 Free PMC article.
-
CXCR6-Mediated Simian Immunodeficiency Virus SIVagmSab Entry into Sabaeus African Green Monkey Lymphocytes Implicates Widespread Use of Non-CCR5 Pathways in Natural Host Infections.J Virol. 2017 Jan 31;91(4):e01626-16. doi: 10.1128/JVI.01626-16. Print 2017 Feb 15. J Virol. 2017. PMID: 27903799 Free PMC article.
-
The Hitchhiker Guide to CD4+ T-Cell Depletion in Lentiviral Infection. A Critical Review of the Dynamics of the CD4+ T Cells in SIV and HIV Infection.Front Immunol. 2021 Jul 21;12:695674. doi: 10.3389/fimmu.2021.695674. eCollection 2021. Front Immunol. 2021. PMID: 34367156 Free PMC article.
-
HIV Persistence in Adipose Tissue Reservoirs.Curr HIV/AIDS Rep. 2018 Feb;15(1):60-71. doi: 10.1007/s11904-018-0378-z. Curr HIV/AIDS Rep. 2018. PMID: 29423731 Free PMC article. Review.
Cited by
-
CD20+ T cells: an emerging T cell subset in human pathology.Inflamm Res. 2022 Nov;71(10-11):1181-1189. doi: 10.1007/s00011-022-01622-x. Epub 2022 Aug 11. Inflamm Res. 2022. PMID: 35951029 Free PMC article. Review.
-
Lymph-Node-Based CD3+ CD20+ Cells Emerge from Membrane Exchange between T Follicular Helper Cells and B Cells and Increase Their Frequency following Simian Immunodeficiency Virus Infection.J Virol. 2023 Jun 29;97(6):e0176022. doi: 10.1128/jvi.01760-22. Epub 2023 May 23. J Virol. 2023. PMID: 37223960 Free PMC article.
-
Interests of the Non-Human Primate Models for HIV Cure Research.Vaccines (Basel). 2021 Aug 27;9(9):958. doi: 10.3390/vaccines9090958. Vaccines (Basel). 2021. PMID: 34579195 Free PMC article. Review.
-
Expression of unique gene signature distinguishes TCRαβ+ /BCR+ dual expressers from CD3+ CD14+ doublets.Cytometry A. 2022 Apr;101(4):283-289. doi: 10.1002/cyto.a.24542. Epub 2022 Feb 9. Cytometry A. 2022. PMID: 35092640 Free PMC article.
-
Identification of HIV-reservoir cells with reduced susceptibility to antibody-dependent immune response.Elife. 2022 May 26;11:e78294. doi: 10.7554/eLife.78294. Elife. 2022. PMID: 35616530 Free PMC article.
References
-
- Rothenberger MK, Keele BF, Wietgrefe SW, Fletcher CV, Beilman GJ, Chipman JG, et al. . Large Number of Rebounding/Founder HIV Variants Emerge From Multifocal Infection in Lymphatic Tissues After Treatment Interruption. Proc Natl Acad Sci U S A (2015) 112(10):E1126–34. 10.1073/pnas.1414926112 - DOI - PMC - PubMed
Publication types
MeSH terms
Substances
Grants and funding
LinkOut - more resources
Full Text Sources
Molecular Biology Databases
Research Materials
Miscellaneous