

Digital Phenotyping to Delineate Salinity Response in Safflower Genotypes
- PMID: 34220887
- PMCID: PMC8242588
- DOI: 10.3389/fpls.2021.662498
Digital Phenotyping to Delineate Salinity Response in Safflower Genotypes
Abstract
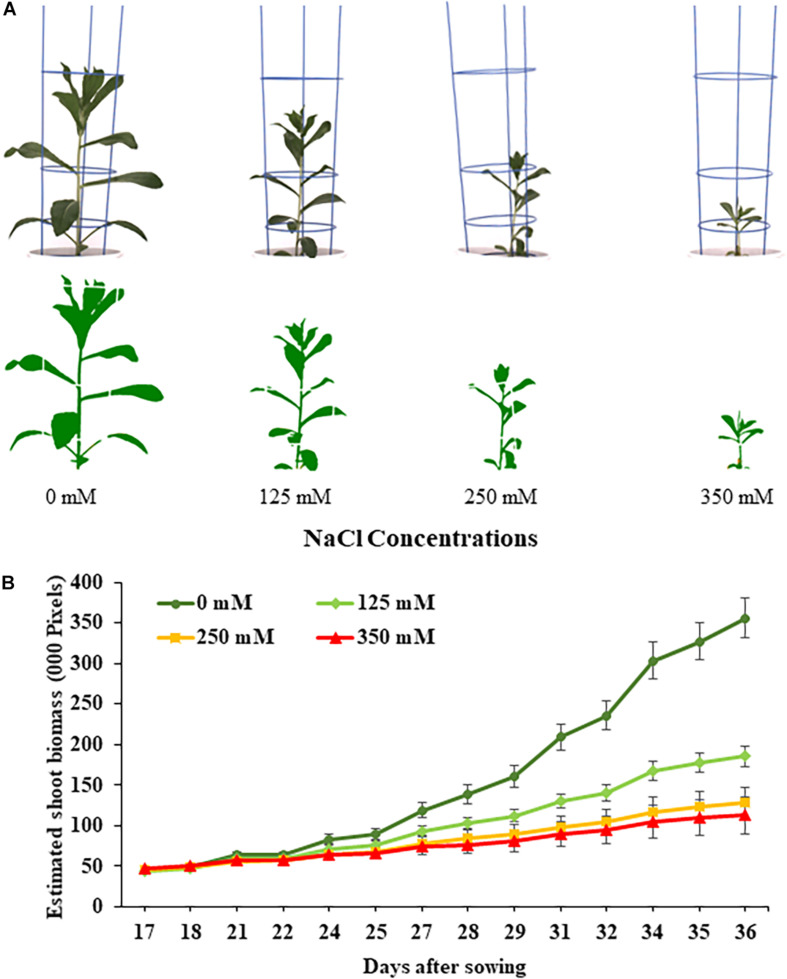
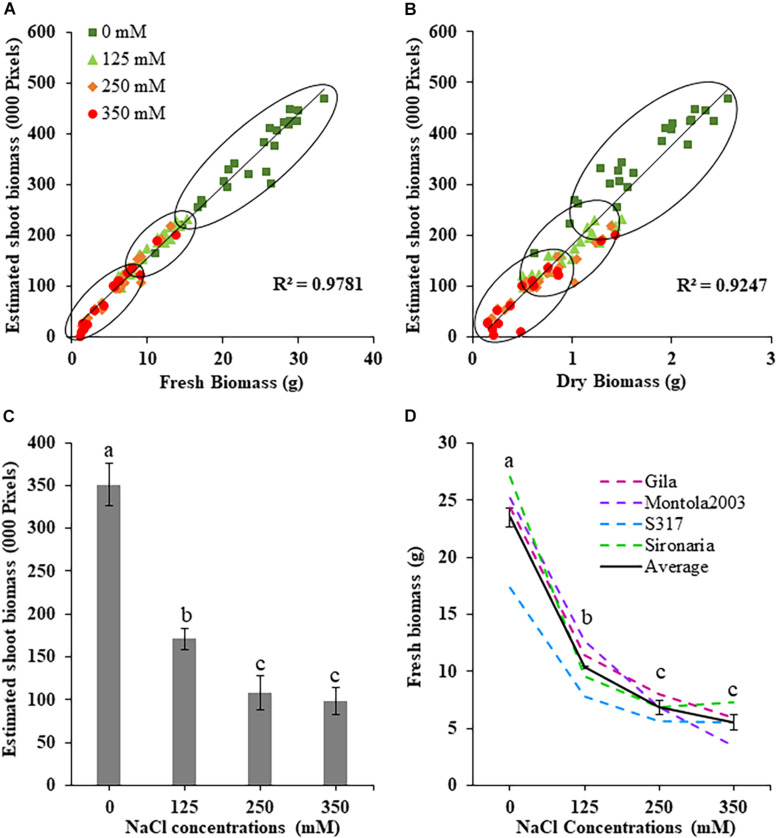
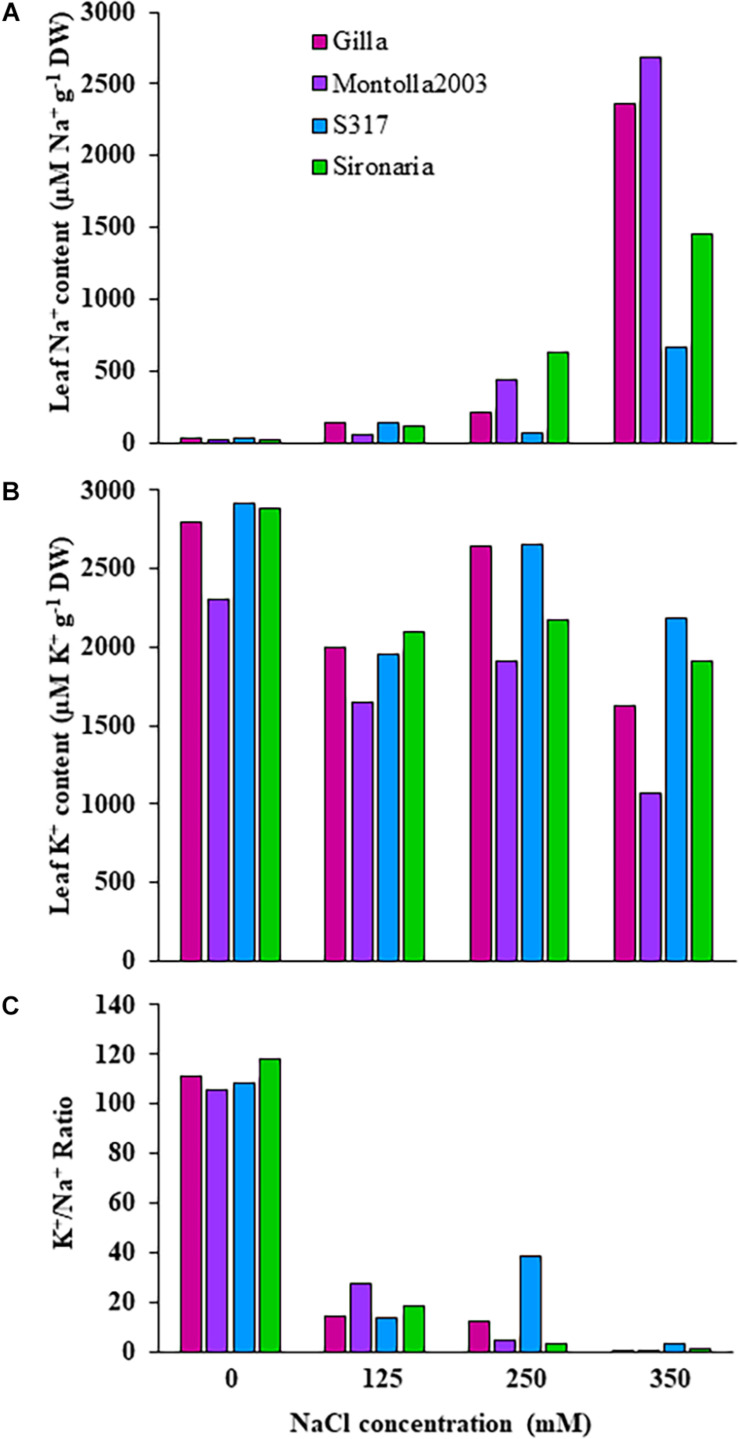
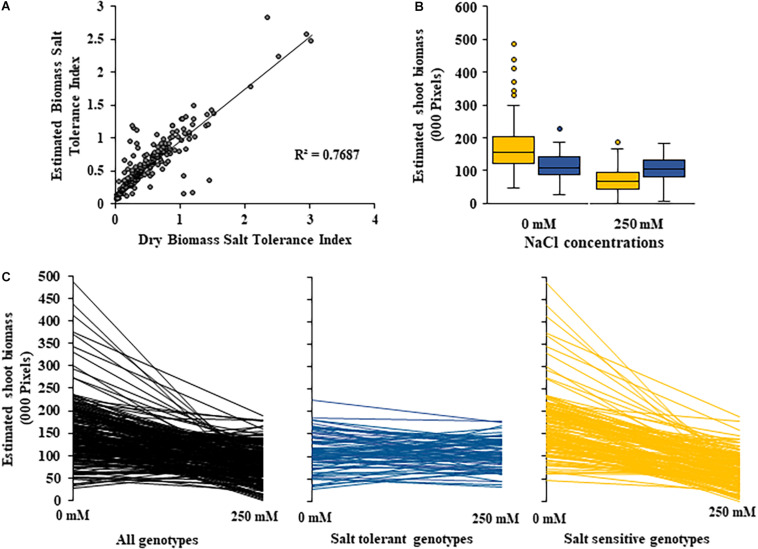
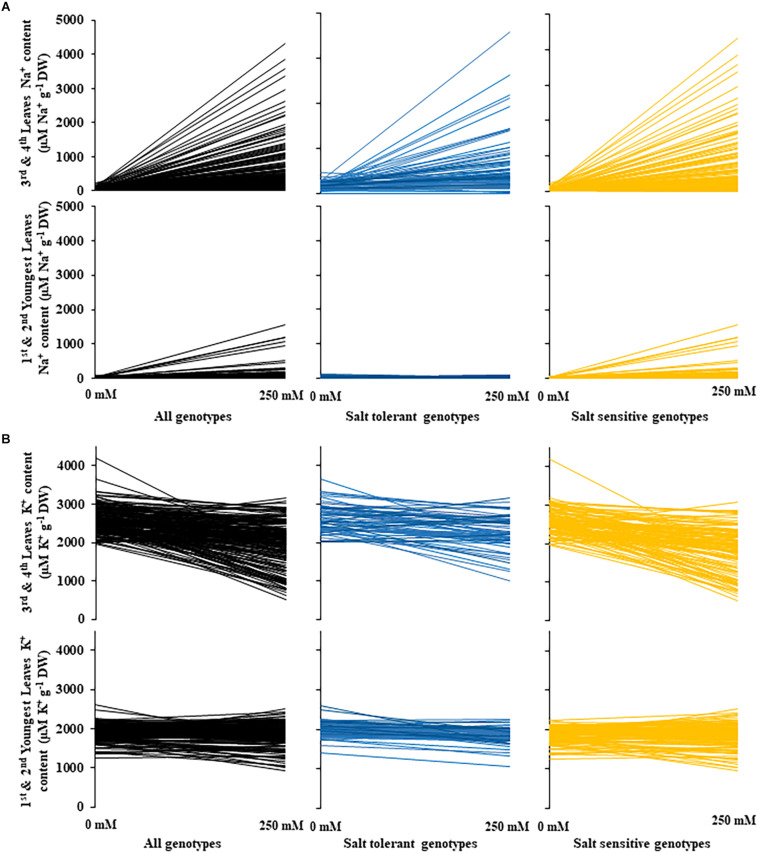
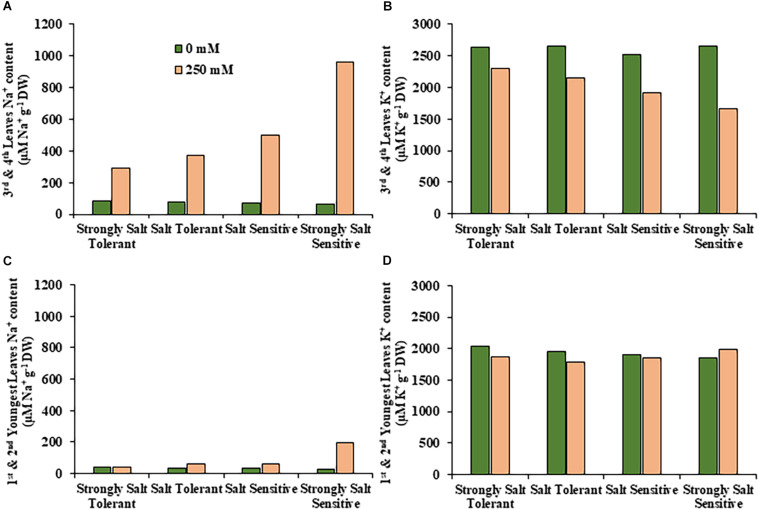
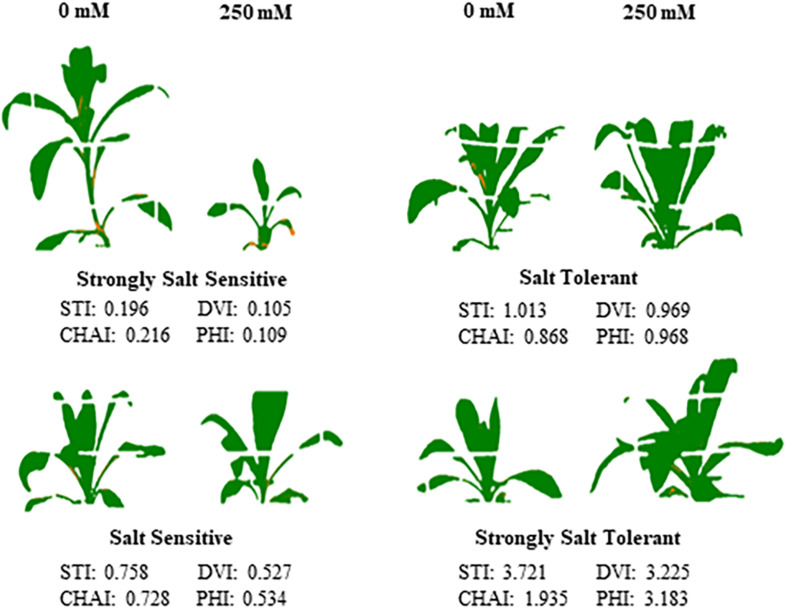
Salinity is a major contributing factor to the degradation of arable land, and reductions in crop growth and yield. To overcome these limitations, the breeding of crop varieties with improved salt tolerance is needed. This requires effective and high-throughput phenotyping to optimize germplasm enhancement. Safflower (Carthamus tinctorius L.), is an underappreciated but highly versatile oilseed crop, capable of growing in saline and arid environments. To develop an effective and rapid phenotyping protocol to differentiate salt responses in safflower genotypes, experiments were conducted in the automated imaging facility at Plant Phenomics Victoria, Horsham, focussing on digital phenotyping at early vegetative growth. The initial experiment, at 0, 125, 250, and 350 mM sodium chloride (NaCl), showed that 250 mM NaCl was optimum to differentiate salt sensitive and tolerant genotypes. Phenotyping of a diverse set of 200 safflower genotypes using the developed protocol defined four classes of salt tolerance or sensitivity, based on biomass and ion accumulation. Salt tolerance in safflower was dependent on the exclusion of Na+ from shoot tissue and the maintenance of K+ uptake. Salinity response identified in glasshouse experiments showed some consistency with the performance of representatively selected genotypes tested under sodic field conditions. Overall, our results suggest that digital phenotyping can be an effective high-throughput approach in identifying candidate genotypes for salt tolerance in safflower.
Keywords: RGB imaging; digital biomass; high-throughput phenotyping; salinity; salt tolerance.
Copyright © 2021 Thoday-Kennedy, Joshi, Daetwyler, Hayden, Hudson, Spangenberg and Kant.
Conflict of interest statement
DH was employed by the company GO Resources Pty Ltd. The remaining authors declare that the research was conducted in the absence of any commercial or financial relationships that could be construed as a potential conflict of interest.
Figures
Similar articles
-
An image dataset of diverse safflower (Carthamus tinctorius L.) genotypes for salt response phenotyping.Data Brief. 2022 Nov 29;46:108787. doi: 10.1016/j.dib.2022.108787. eCollection 2023 Feb. Data Brief. 2022. PMID: 36506801 Free PMC article.
-
High-throughput phenotyping to dissect genotypic differences in safflower for drought tolerance.PLoS One. 2021 Jul 23;16(7):e0254908. doi: 10.1371/journal.pone.0254908. eCollection 2021. PLoS One. 2021. PMID: 34297757 Free PMC article.
-
Effect of salinity stress on phenotypic plasticity, yield stability, and signature of stable isotopes of carbon and nitrogen in safflower.Environ Sci Pollut Res Int. 2018 Aug;25(24):23685-23694. doi: 10.1007/s11356-018-2442-z. Epub 2018 Jun 5. Environ Sci Pollut Res Int. 2018. PMID: 29872985
-
Salt-induced modulation in inorganic nutrients, antioxidant enzymes, proline content and seed oil composition in safflower (Carthamus tinctorius L.).J Sci Food Agric. 2011 Dec;91(15):2785-93. doi: 10.1002/jsfa.4522. Epub 2011 Jun 29. J Sci Food Agric. 2011. PMID: 21717466
-
Salt sensitivity in chickpea.Plant Cell Environ. 2010 Apr;33(4):490-509. doi: 10.1111/j.1365-3040.2009.02051.x. Epub 2009 Oct 14. Plant Cell Environ. 2010. PMID: 19843257 Review.
Cited by
-
An image dataset of diverse safflower (Carthamus tinctorius L.) genotypes for salt response phenotyping.Data Brief. 2022 Nov 29;46:108787. doi: 10.1016/j.dib.2022.108787. eCollection 2023 Feb. Data Brief. 2022. PMID: 36506801 Free PMC article.
-
Effects of NaCl on Antioxidant, Antifungal, and Antibacterial Activities in Safflower Essential Oils.Plants (Basel). 2021 Dec 18;10(12):2809. doi: 10.3390/plants10122809. Plants (Basel). 2021. PMID: 34961281 Free PMC article.
References
-
- Ahmad M., Shahzad A., Iqbal M., Asif M., Hirani A. H. (2013). Morphological and molecular genetic variation in wheat for salinity tolerance at germination and early seedling stage. Aust. J. Crop Sci. 7 66–74.
-
- Anjani K., Yadav P. (2017). High yielding-high oleic non-genetically modified Indian safflower cultivars. Indust. Crops Prod. 104 7–12. 10.1016/j.indcrop.2017.04.011 - DOI
-
- Araus J. L., Cairns J. E. (2014). Field high-throughput phenotyping: the new crop breeding frontier. Trends Plant Sci. 19 52–61. - PubMed
LinkOut - more resources
Full Text Sources