Genome-Wide Analysis of Myeloblastosis-Related Genes in Brassica napus L. and Positive Modulation of Osmotic Tolerance by BnMRD107
- PMID: 34220898
- PMCID: PMC8248502
- DOI: 10.3389/fpls.2021.678202
Genome-Wide Analysis of Myeloblastosis-Related Genes in Brassica napus L. and Positive Modulation of Osmotic Tolerance by BnMRD107
Abstract
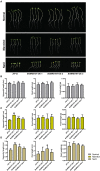
Myeloblastosis (MYB)-related transcription factors comprise a large subfamily of the MYB family. They play significant roles in plant development and in stress responses. However, MYB-related proteins have not been comprehensively investigated in rapeseed (Brassica napus L.). In the present study, a genome-wide analysis of MYB-related transcription factors was performed in rapeseed. We identified 251 Brassica napus MYB (BnMYB)-related members, which were divided phylogenetically into five clades. Evolutionary analysis suggested that whole genome duplication and segmental duplication events have played a significant role in the expansion of BnMYB-related gene family. Selective pressure of BnMYB-related genes was estimated using the Ka/Ks ratio, which indicated that BnMYB-related genes underwent strong purifying selection during evolution. In silico analysis showed that various development-associated, phytohormone-responsive, and stress-related cis-acting regulatory elements were enriched in the promoter regions of BnMYB-related genes. Furthermore, MYB-related genes with tissue or organ-specific, stress-responsive expression patterns were identified in B. napus based on temporospatial and abiotic stress expression profiles. Among the stress-responsive MYB-related genes, BnMRD107 was strongly induced by drought stress, and was therefore selected for functional study. Rapeseed seedlings overexpressing BnMRD107 showed improved resistance to osmotic stress. Our findings not only lay a foundation for further functional characterization of BnMYB-related genes, but also provide valuable clues to determine candidate genes for future genetic improvement of B. napus.
Keywords: Brassica napus; MYB-related transcription factors; abiotic stress; expression profiles; phylogenetic analysis.
Copyright © 2021 Li, Lin, Zhang, Wu, Fang and Wang.
Conflict of interest statement
The authors declare that the research was conducted in the absence of any commercial or financial relationships that could be construed as a potential conflict of interest.
Figures


Similar articles
-
Identification and Phylogenetic Analysis of the R2R3-MYB Subfamily in Brassica napus.Plants (Basel). 2023 Feb 16;12(4):886. doi: 10.3390/plants12040886. Plants (Basel). 2023. PMID: 36840234 Free PMC article.
-
Genome-wide identification, functional prediction, and evolutionary analysis of the R2R3-MYB superfamily in Brassica napus.Genome. 2017 Oct;60(10):797-814. doi: 10.1139/gen-2017-0059. Epub 2017 Jul 21. Genome. 2017. PMID: 28732175
-
Pan-genome analysis of the R2R3-MYB genes family in Brassica napus unveils phylogenetic divergence and expression profiles under hormone and abiotic stress treatments.Front Plant Sci. 2025 May 23;16:1588362. doi: 10.3389/fpls.2025.1588362. eCollection 2025. Front Plant Sci. 2025. PMID: 40487211 Free PMC article.
-
Phylogenomic analysis of 20S proteasome gene family reveals stress-responsive patterns in rapeseed (Brassica napus L.).Front Plant Sci. 2022 Oct 31;13:1037206. doi: 10.3389/fpls.2022.1037206. eCollection 2022. Front Plant Sci. 2022. PMID: 36388569 Free PMC article.
-
Engineering Multiple Abiotic Stress Tolerance in Canola, Brassica napus.Front Plant Sci. 2020 Feb 25;11:3. doi: 10.3389/fpls.2020.00003. eCollection 2020. Front Plant Sci. 2020. PMID: 32161602 Free PMC article. Review.
Cited by
-
The Sclerotinia sclerotiorum-inducible promoter pBnGH17D7 in Brassica napus: isolation, characterization, and application in host-induced gene silencing.J Exp Bot. 2022 Nov 2;73(19):6663-6677. doi: 10.1093/jxb/erac328. J Exp Bot. 2022. PMID: 35927220 Free PMC article.
-
A MYB-related transcription factor ZmMYBR29 is involved in grain filling.BMC Plant Biol. 2024 May 27;24(1):458. doi: 10.1186/s12870-024-05163-9. BMC Plant Biol. 2024. PMID: 38797860 Free PMC article.
-
Characteristics and Functions of MYB (v-Myb avivan myoblastsis virus oncogene homolog)-Related Genes in Arabidopsis thaliana.Genes (Basel). 2023 Oct 31;14(11):2026. doi: 10.3390/genes14112026. Genes (Basel). 2023. PMID: 38002969 Free PMC article. Review.
-
A Multi-Omics Analysis Revealed the Diversity of the MYB Transcription Factor Family's Evolution and Drought Resistance Pathways.Life (Basel). 2024 Jan 18;14(1):141. doi: 10.3390/life14010141. Life (Basel). 2024. PMID: 38255756 Free PMC article.
-
Genome-Wide Identification and Expressional Profiling of the Metal Tolerance Protein Gene Family in Brassica napus.Genes (Basel). 2022 Apr 26;13(5):761. doi: 10.3390/genes13050761. Genes (Basel). 2022. PMID: 35627146 Free PMC article.
References
-
- Abe M., Kaya H., Watanabe-Taneda A., Shibuta M., Yamaguchi A., Sakamoto T., et al. . (2015). FE, a phloem-specific myb-related protein, promotes flowering through transcriptional activation of FLOWERING LOCUS T and FLOWERING LOCUS T INTERACTING PROTEIN 1. Plant J. 83, 1059–1068. 10.1111/tpj.12951 - DOI - PubMed
-
- Aydin G., Yucel M., Chan M. T., Oktem H. A. (2014). Evaluation of abiotic stress tolerance and physiological characteristics of potato (Solanum tuberosum L. cv. Kennebec) that heterologously expresses the rice Osmyb4 gene. Plant Biotechnol. Rep. 8, 295–304. 10.1007/s11816-014-0322-7 - DOI
LinkOut - more resources
Full Text Sources

