

Successful ATAC-Seq From Snap-Frozen Equine Tissues
- PMID: 34220931
- PMCID: PMC8242358
- DOI: 10.3389/fgene.2021.641788
Successful ATAC-Seq From Snap-Frozen Equine Tissues
Abstract
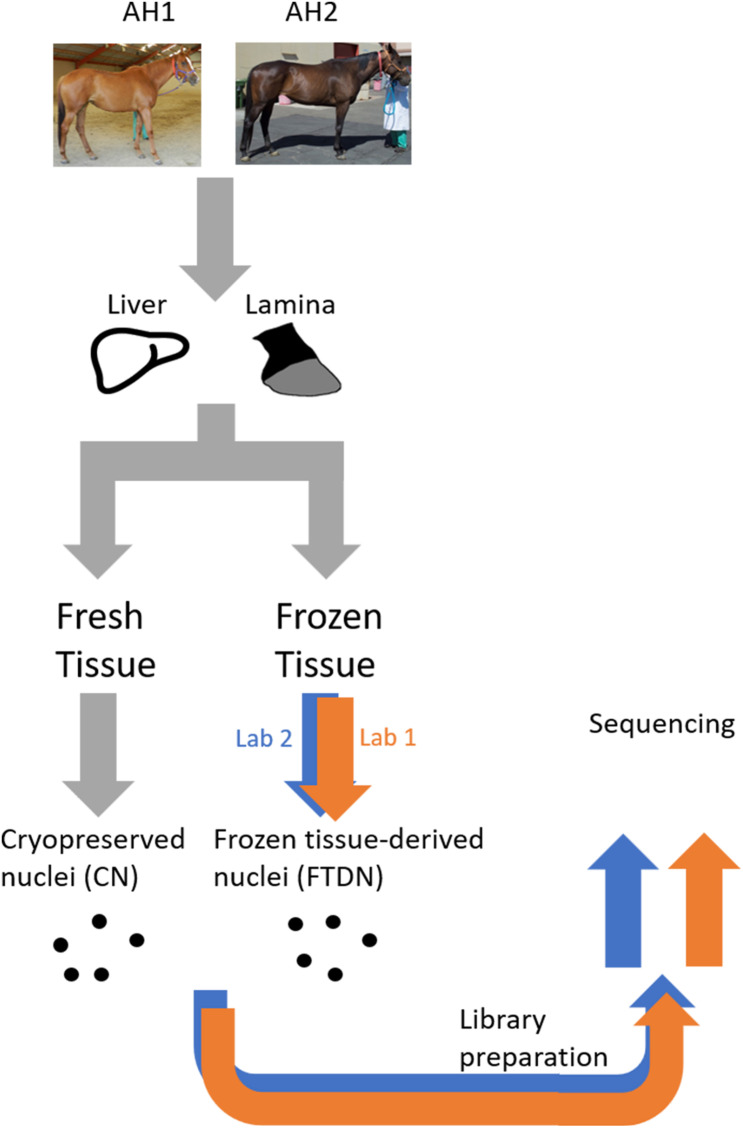
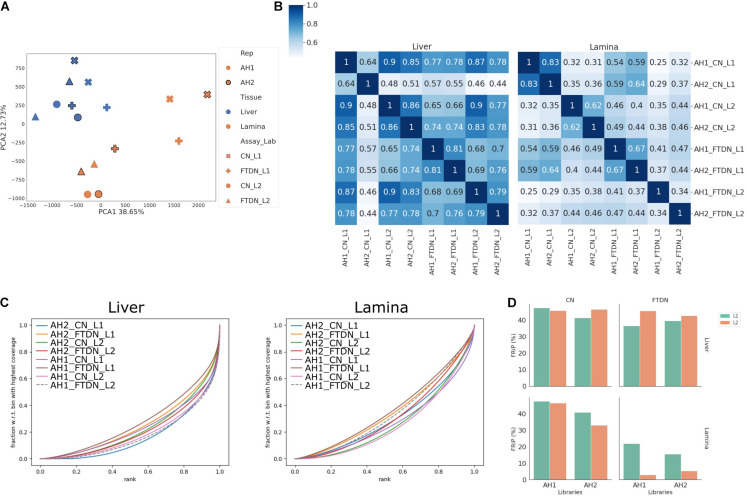
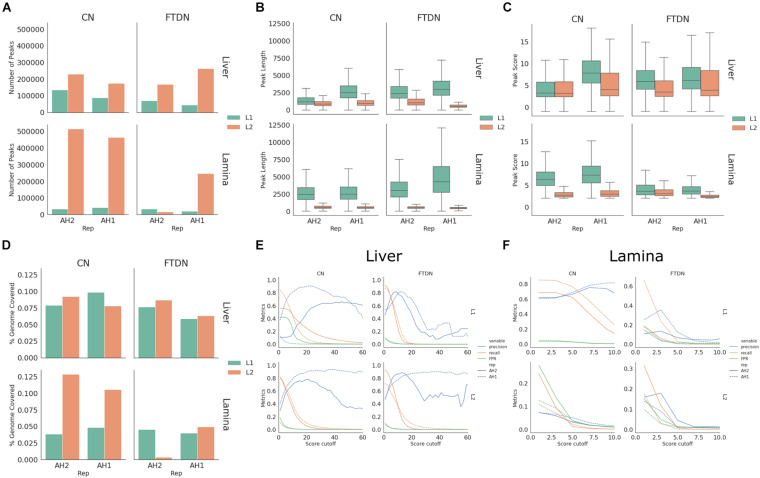
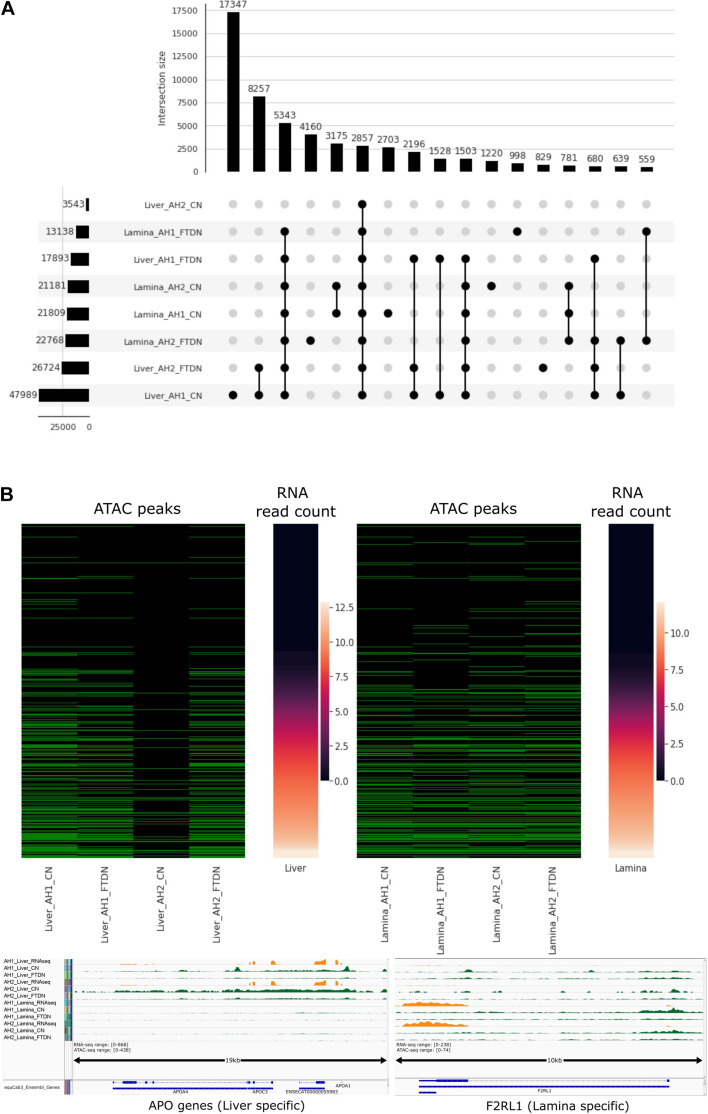
An assay for transposase-accessible chromatin with high-throughput sequencing (ATAC-seq) has become an increasingly popular method to assess genome-wide chromatin accessibility in isolated nuclei from fresh tissues. However, many biobanks contain only snap-frozen tissue samples. While ATAC-seq has been applied to frozen brain tissues in human, its applicability in a wide variety of tissues in horse remains unclear. The Functional Annotation of Animal Genome (FAANG) project is an international collaboration aimed to provide high quality functional annotation of animal genomes. The equine FAANG initiative has generated a biobank of over 80 tissues from two reference female animals and experiments to begin to characterize tissue specificity of genome function for prioritized tissues have been performed. Due to the logistics of tissue collection and storage, extracting nuclei from a large number of tissues for ATAC-seq at the time of collection is not always practical. To assess the feasibility of using stored frozen tissues for ATAC-seq and to provide a guideline for the equine FAANG project, we compared ATAC-seq results from nuclei isolated from frozen tissue to cryopreserved nuclei (CN) isolated at the time of tissue harvest in liver, a highly cellular homogenous tissue, and lamina, a relatively acellular tissue unique to the horse. We identified 20,000-33,000 accessible chromatin regions in lamina and 22-61,000 in liver, with consistently more peaks identified using CN isolated at time of tissue collection. Our results suggest that frozen tissues are an acceptable substitute when CN are not available. For more challenging tissues such as lamina, nuclei extraction at the time of tissue collection is still preferred for optimal results. Therefore, tissue type and accessibility to intact nuclei should be considered when designing ATAC-seq experiments.
Keywords: FAANG; chromatin; cryopreserved; epigenetics; horse.
Copyright © 2021 Peng, Bellone, Petersen, Kalbfleisch and Finno.
Conflict of interest statement
The cost of library preparation and sequencing was partially covered by two core laboratories as part of collaboration to optimize ATAC-seq protocol using horse tissues.
Figures
References
-
- Andrews S. (2010). FastQC: A Quality Control Tool for High Throughput Sequence Data. Available online at: https://www.bioinformatics.babraham.ac.uk/projects/fastqc/ (accessed September 2016).
-
- Caswell T. A., Droettboom M., Lee A., Hunter J., Firing E., Stansby D., et al. (2020). Matplotlib/Matplotlib v3.1.3 (version v3.1.3). Zenodo. 10.5281/ZENODO.3633844 - DOI