. 2021 Jun 23;10(1):1938890.
doi: 10.1080/2162402X.2021.1938890.

YKT6, as a potential predictor of prognosis and immunotherapy response for oral squamous cell carcinoma, is related to cell invasion, metastasis, and CD8+ T cell infiltration

Affiliations

YKT6, as a potential predictor of prognosis and immunotherapy response for oral squamous cell carcinoma, is related to cell invasion, metastasis, and CD8+ T cell infiltration

Zongcheng Yang et al. Oncoimmunology. .

Abstract

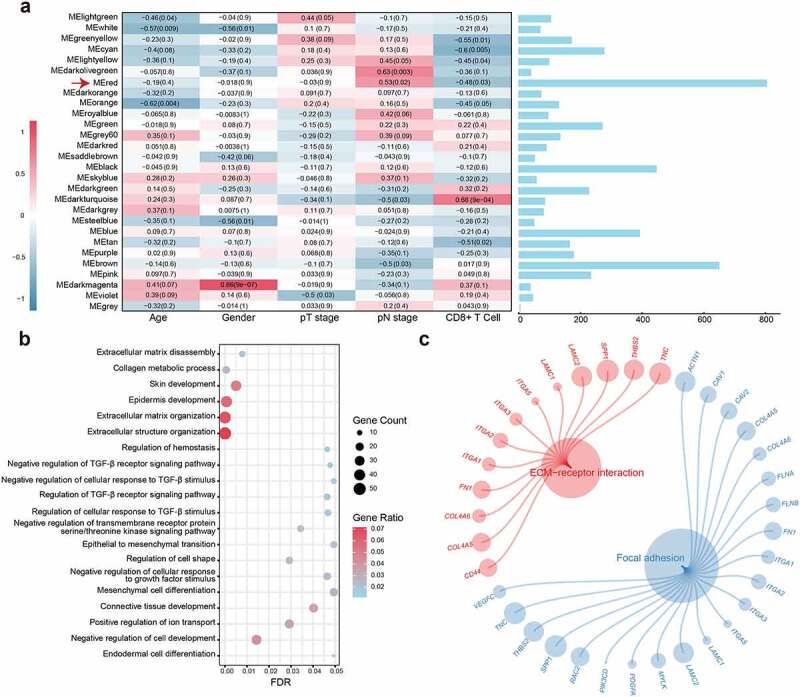
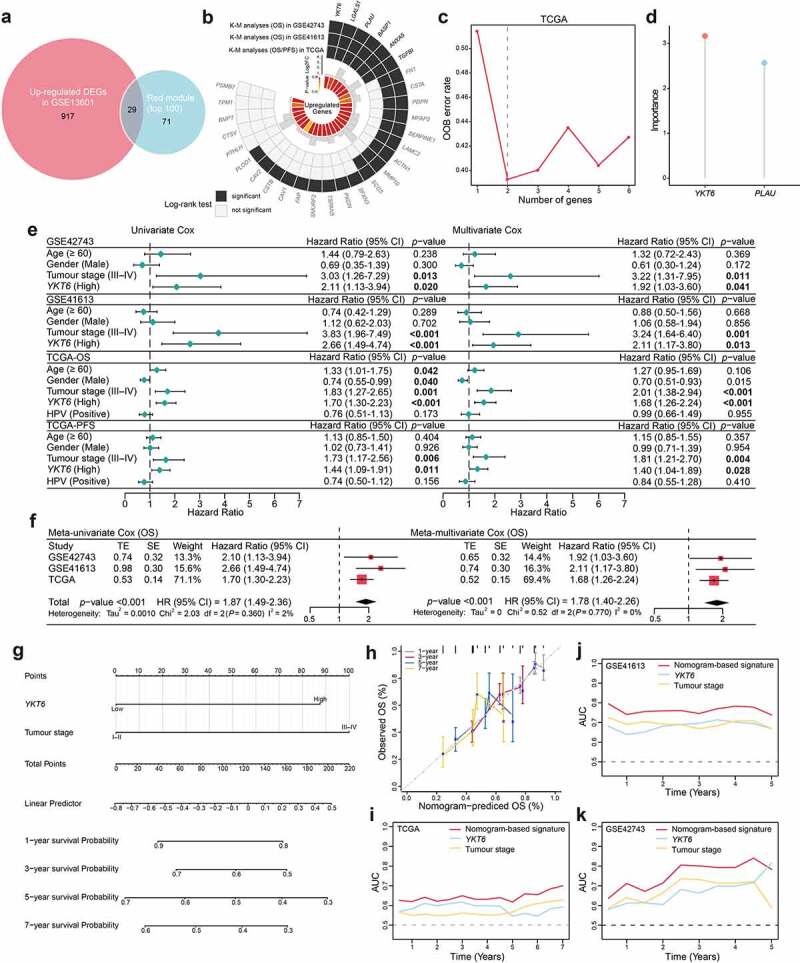
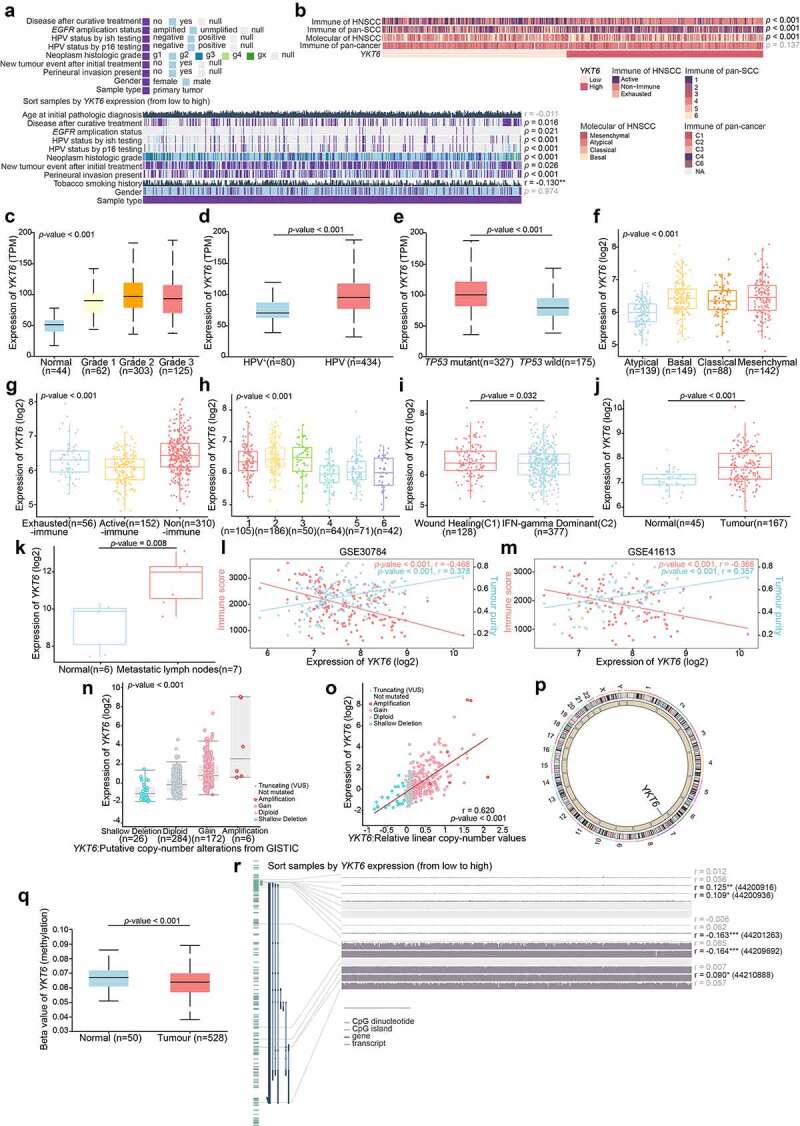
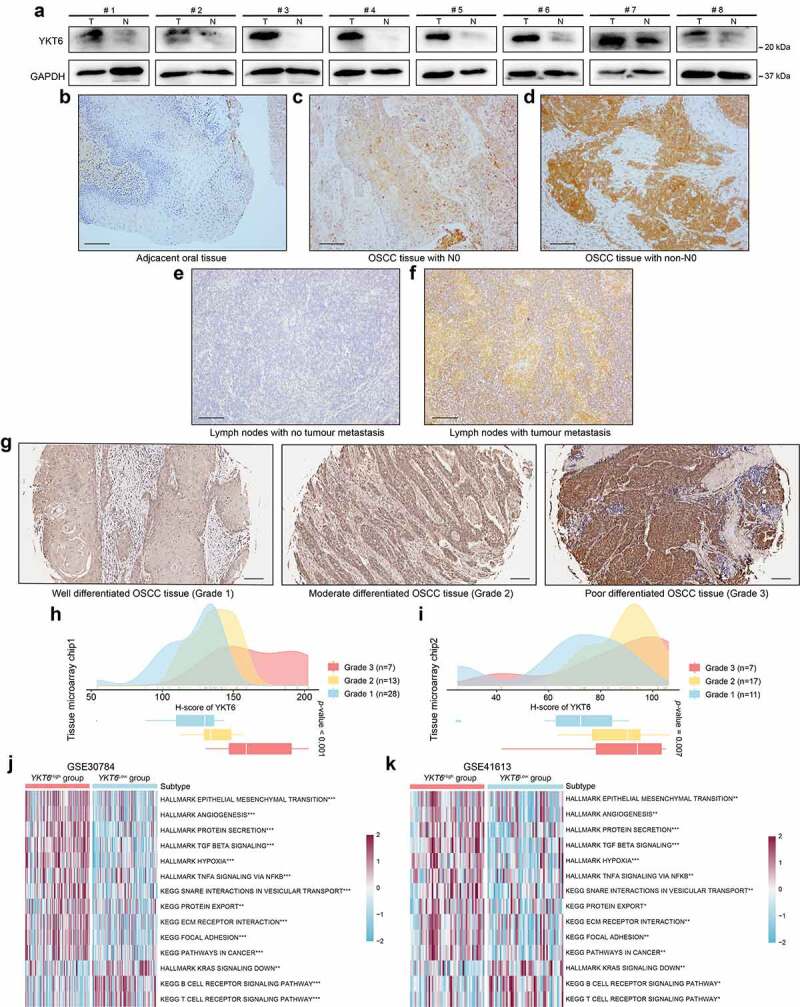
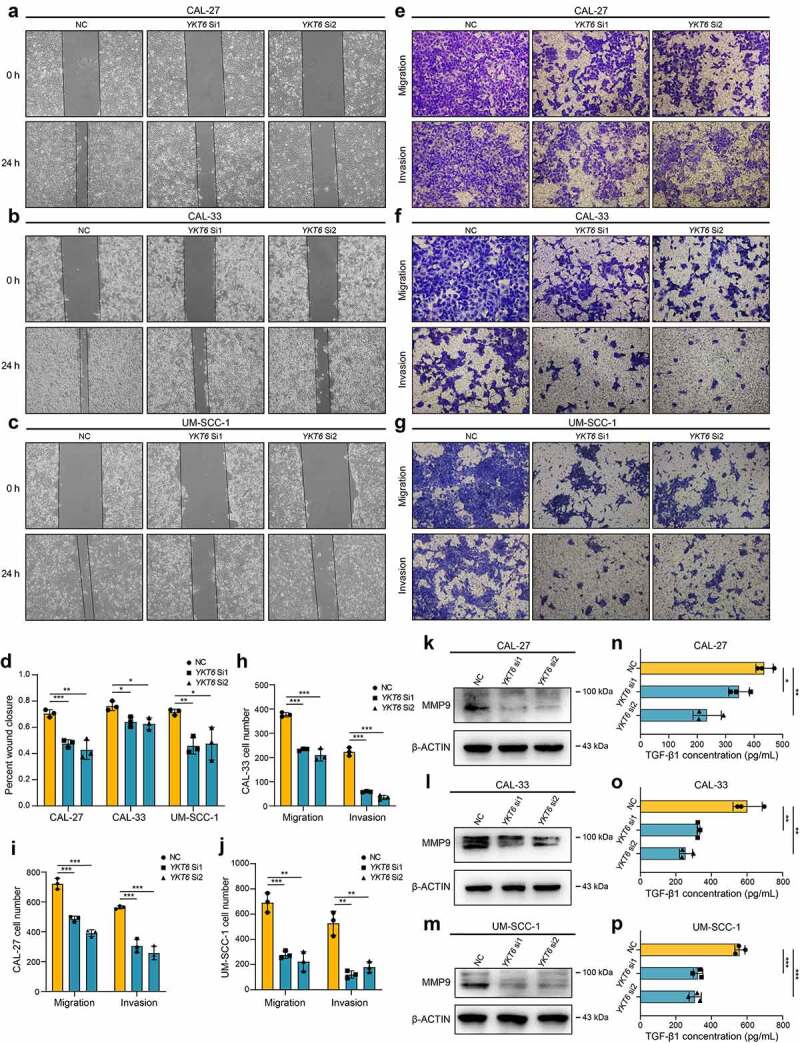
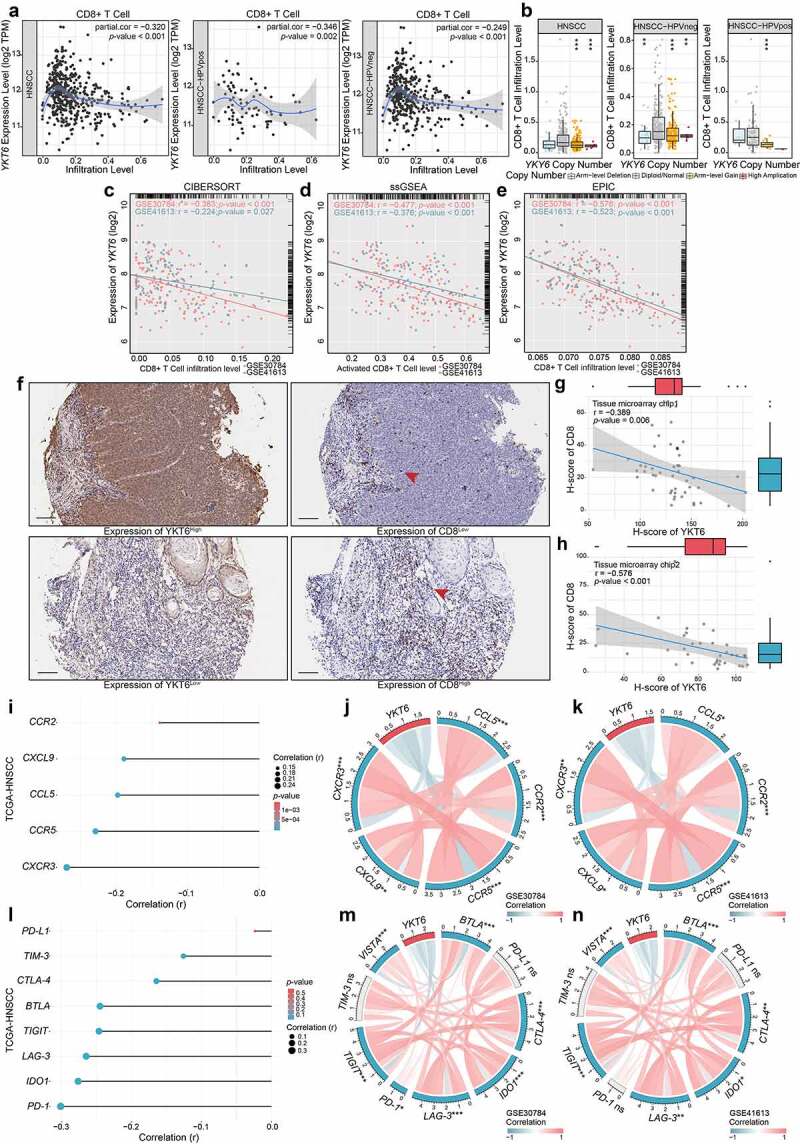
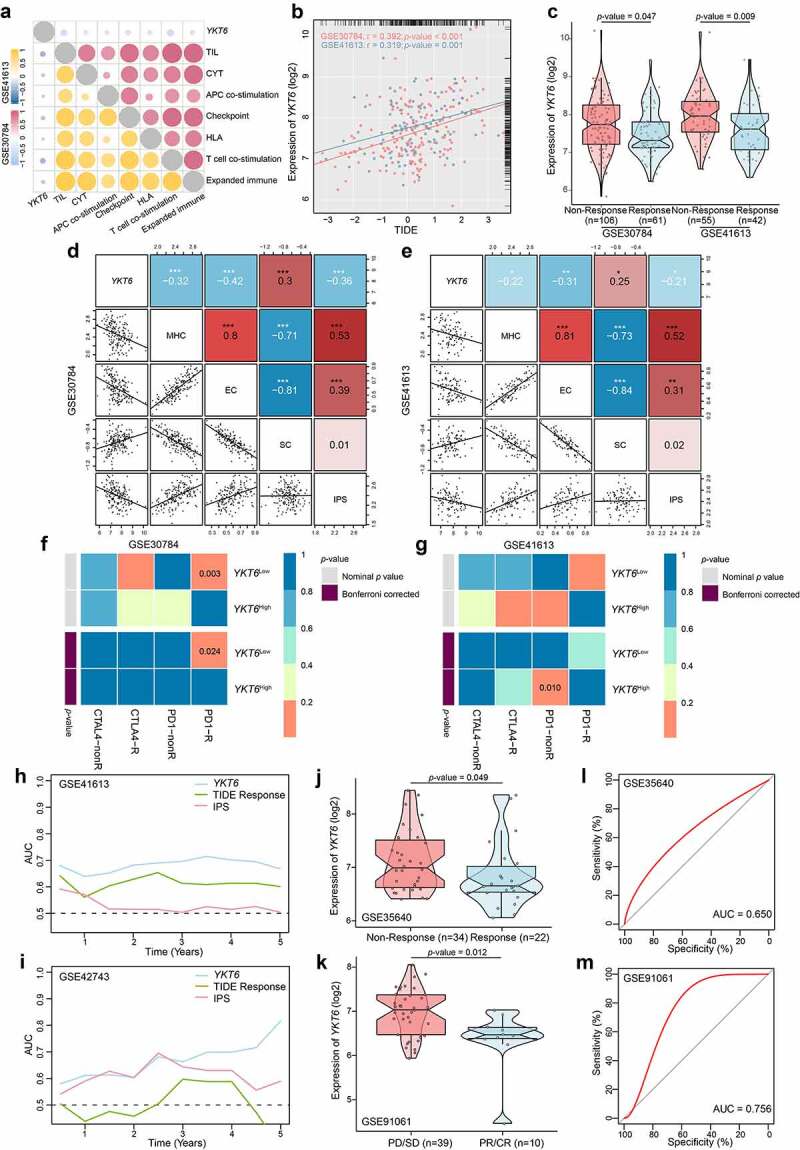
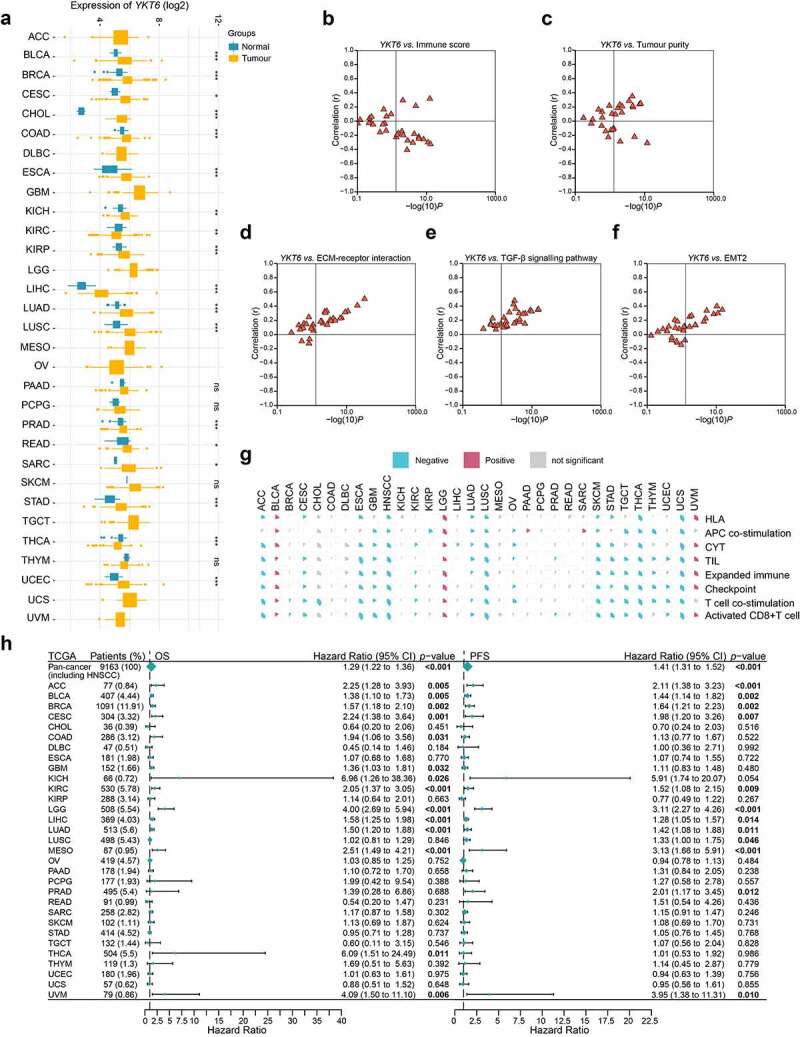
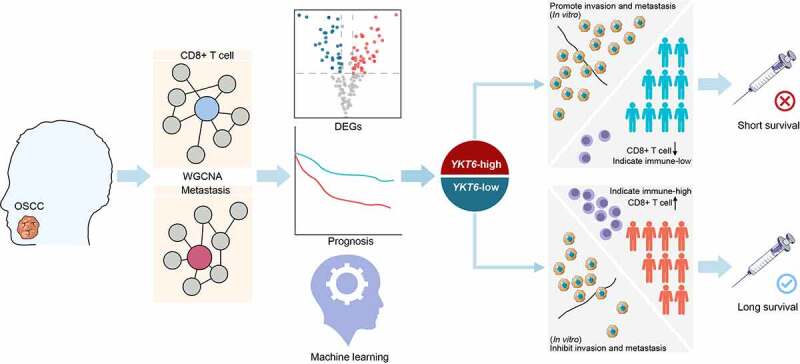
Metastasis and immune suppression account for the poor prognosis of oral squamous cell carcinoma (OSCC). YKT6 is a member of the soluble NSF attachment protein receptor (SNARE) family, and the effect of YKT6 in OSCC remains elusive. The purpose of this study was to explore promising prognostic and immune therapeutic candidate biomarkers for OSCC and to understand the expression pattern, prognostic value, immune effects, and biological functions of YKT6. Genes correlated with tumor metastasis and CD8 + T cell levels were identified by weighted gene coexpression network analysis (WGCNA). Next, YKT6 was analyzed through differential expression, prognostic and machine learning analyses. The molecular and immune characteristics of YKT6 were analyzed in independent cohorts, clinical specimens, and in vitro. In addition, we investigated the role of YKT6 at the pan-cancer level. The results suggested that the red module in WGCNA, as a hub module, was associated with lymph node (LN) metastasis and CD8 + T cell infiltration. Upregulation of YKT6 was found in OSCC and linked to adverse prognosis. A nomogram model containing YKT6 expression and tumor stage was constructed for clinical practice. The aggressive and immune-inhibitory phenotypes showed YKT6 overexpression, and the effect of YKT6 on OSCC cell invasion and metastasis in vitro was observed. Moreover, the low expression of YKT6 was correlated with high CD8 + T cell levels and potential immunotherapy response in OSCC. Similar results were found at the pan-cancer level. In total, YKT6 is a promising candidate biomarker for prognosis, molecular, and immune characteristics in OSCC.

Keywords: CD8+ T cell; Oral squamous cell carcinoma; YKT6; immunotherapy; prognosis.


Figures

Figure 1.
Figure 1.
WGCNA construction and biological function and pathway annotation. (a) Left: Correlation of module eigengenes to clinical and pathological traits. The values in the cells are presented as “Pearson r (p-value)”. P-values were obtained by Pearson’s correlation analyses; Right: The number of genes in each module. The red arrow represents the red module. (b) Gene ontology analysis of genes in the red module. (c) KEGG pathway enrichment analysis of genes in the red module
Figure 2.
Figure 2.
Identification of YKT6 as a hub gene and construction of a YKT6-based prognostic prediction model. (a) Venn plot of intersection of up-regulated differentially expressed genes (DEGs) and selected genes from WGCNA. (b) Circos plot shows 29 common genes from WGCNA and differential expressed analysis in OSCC samples. Up-regulations of six genes are also associated with OS/PFS reduction in TCGA-HNSCC cohort. (c-d) Ranger provided VIS for two genes for TCGA-HNSCC patients only. OOB error rate of these genes in the model, when genes were included one by one based on their VIS ranks. The gene (red lollipop) that ranked in the top list according to the prognostic importance was chosen for further analyses. (e) Univariate and multivariate Cox regression analyses of YKT6 level with age, gender, tumour stage and HPV status in the GSE41613, GSE42743 and TCGA cohorts. HR and p-values were displayed. (f) Meta‐analysis of prognostic values of YKT6 for patients across three cohorts. A fixed effects model was used to calculate pooled HR value. (g) Nomogram by multivariate Cox regression analysis for predicting the proportion of patients with OS. (h) Plots depict the calibration of model in terms of agreement between predicted and observed OS. Model performance is shown by the plot, relative to the 45-degree line, which represents perfect prediction. (i-k) AUC plotted for different durations of OS for nomogram-based signature, YKT6 expression, and tumour stage in the TCGA, GSE41613 and GSE42743 datasets
Figure 3.
Figure 3.
YKT6 expression is elevated in HNSCC/OSCC samples from publicly available datasets.(a-b) Correlations between YKT6 level and clinicopathological characteristics (including HNSCC subtypes). (c-e) Boxplot indicating YKT6 expression in different grades, HPV infection condition, TP53 mutation status of HNSCC samples from the UALCAN database. (f-i) Analysis of YKT6 mRNA expression in different subtypes of HNSCC tissues from TCGA database. (j) Analysis of mRNA expression of YKT6 in OSCC and normal control tissues from GSE30784 dataset. (k) Quantification of YKT6 mRNA in metastatic lymph nodes and normal oral tissues from GSE78060. (l-m) The correlation between YKT6 mRNA expression with immune score and tumour purity in the GSE30784 and GSE41613 datasets. (n) Deletion, diploid, copy number gain and amplification are involved in the deregulation of YKT6 expression as analyzed by cBioPortal using TCGA-HNSCC data. (o) Correlation between YKT6 CNV and mRNA expression. (p) The location of CNV of YKT6 on 23 chromosomes using TCGA-HNSCC cohort. (q) DNA methylation value differences in normal control and tumour tissues from UALCAN-HNSCC cohort. (r) The correlation of YKT6 expression and DNA methylation level in MEXPRESS-HNSCC cohort; *p < 0.05, **p ≤ 0.01, and ***p ≤ 0.001
Figure 4.
Figure 4.
YKT6 expression is upregulated in clinical OSCC samples. (a) The protein levels of YKT6 in eight pairs of OSCC tissues (T) and adjacent non-tumour tissues (N) measured by western blot. (b-f) Images of IHC staining for YKT6 in adjacent non-tumour tissues, different pN stage of OSCC tissues, and LN tissues with/without tumour metastasis. Scale bars: 100 μm. (g) Representative images of IHC staining for YKT6 in different histologic grades of OSCC tissues. Scale bars: 100 μm. (h-i) Quantification of YKT6 IHC staining in different histologic grades of OSCC tissues. (j-k) GSVA analysis of hallmark and KEGG pathway gene sets in YKT6 high and low expression samples from GSE30784 and GSE41613 datasets; *p < 0.05, **p ≤ 0.01, and ***p ≤ 0.001
Figure 5.
Figure 5.
YKT6 promotes OSCC cells migration and invasion in vitro.(a-c) Images of wound healing assay in NC and YKT6 knockdown group. (d) Quantitative analysis of wound closure. (e-g) Images of transwell assay for migration and invasion in NC and YKT6 knockdown group. (h-j) Quantitative analysis of migration and invasion OSCC cell number. (k-m) Verification of MMP9 expression by Western blotting assay in OSCC cells transfected with siRNA. (n-p) TGF-β1 concentration in cell culture supernatants measured by ELISA in OSCC cells transfected with siRNA; *p < 0.05, **p ≤ 0.01, and ***p ≤ 0.001
Figure 6.
Figure 6.
High expression of YKT6 correlates with low CD8+T cell infiltration level. (a) The mRNA expression of YKT6 is negatively correlated with CD8+T cell infiltration level in HNSCC, HNSCC HPV-positive and HNSCC HPV-negative in TIMER2 database. Each dot represents each sample. (b) The CNV of YKT6 is negatively correlated with the level of CD8+T cell in HNSCC, HNSCC HPV-positive and HNSCC HPV-negative databases in TIMER2 database. (c-e) The mRNA expression of YKT6 is negatively correlated with CD8 +T cell infiltration level in GSE30784 and GSE41613 with CIBERSORT, ssGSEA and EPIC algorism. (f) IHC images of high and low protein expression of YKT6 and CD8. Scale bars: 100 μm. The red arrow represents CD8+ T cells infiltrating into the tumours. (g-h) Quantifications of YKT6 and CD8 IHC staining in OSCC tissue microarray chip1 (n = 48) and chip2 (n = 35) show the negative association between YKT6 and CD8. (i-k) In TIMER2-HNSCC, GSE30784 and GSE41613, YKT6 expression is negatively associated with chemokines and chemokine receptors expression. (l-n) The mRNA expression of YKT6 is negatively correlated with immune checkpoint molecules expression level in TIMER2- HNSCC, GSE30784 and GSE41613; ns, not significant, *p < 0.05, **p ≤ 0.01, and ***p ≤ 0.001
Figure 7.
Figure 7.
YKT6 expression could predict the clinical benefit of ICB. (a) The negative correlation between YKT6 expression and immune signatures in GSE30784, GSE41613 cohorts. (b) The mRNA expression of YKT6 is correlated with TIDE score in GSE30784 and GSE41613. (c) BoxViolinplot representation of YKT6 expression in the putative immunotherapeutic response versus non-response group from TIDE in GSE30784 and GSE41613 cohorts. (d-e) The correlation between YKT6 and MHC, EC, SC, IPS score in GSE30784 and GSE41613. (f-g) Submap analysis manifested that YKT6 low group could be more sensitive to the anti-PD-1 treatment in GSE30784 and GSE41613. P-values were obtained after being adjusted. (h-i) The comparison of AUC of YKT6, TIDE Response and IPS score for OS in GSE41613 and GSE42743. (j-k) BoxViolinplot illustrates the distribution of YKT6 for patients with different immunotherapeutic response in GSE35640 and GSE91061 cohorts. (l-m) ROC curves measuring the predictive value about objective response to ICB in GSE35640 and GSE91061 cohorts; *p < 0.05, **p ≤ 0.01, and ***p ≤ 0.001
Figure 8.
Figure 8.
Role of YKT6 in pan-cancer. (a) The mRNA expression of YKT6 between tumour and normal control tissues was assessed from TCGA database. (b-f) Association of YKT6 with immune score and tumour purity level and some cancer-related signatures in human solid cancers from TCGA database. (g) Correlation of YKT6 with activated CD8+ T cell level and immune-related scores in human solid cancers from TCGA database. The size of pie is proportional to the correlation. (h) Univariate Cox regression analyses estimating prognostic value (OS/PFS) of YKT6 in different cancer types from TCGA database. The length of horizontal line represents the 95% CI for each group. The vertical dotted line represents HR = 1. HR > 1.0 indicates overexpression YKT6 is an unfavourable prognostic biomarker. Number of patients is displayed; ns, not significant, *p < 0.05, **p ≤ 0.01, and ***p ≤ 0.001
Figure 9.
Figure 9.
Graphical abstract for workflow and comprehensive characterization of YKT6 in OSCC

References

    1. Tang Q, Xie M, Yu S, Zhou X, Xie Y, Chen G, Guo F, Chen L.. Periodic oxaliplatin administration in synergy with PER2-Mediated PCNA transcription repression promotes chronochemotherapeutic efficacy of OSCC. Adv Sci (Weinh). 2019;6(21):1900667. doi: 10.1002/advs.201900667. - DOI - PMC - PubMed
    1. Bray F, Ferlay J, Soerjomataram I, Siegel RL, Torre LA, Jemal A. Global cancer statistics 2018: GLOBOCAN estimates of incidence and mortality worldwide for 36 cancers in 185 countries. CA Cancer J Clin. 2018;68(6):394–18. doi: 10.3322/caac.21492. - DOI - PubMed
    1. Yang Z, Liang X, Fu Y, Liu Y, Zheng L, Liu F, Li T, Yin X, Qiao X, Xu X. Identification of AUNIP as a candidate diagnostic and prognostic biomarker for oral squamous cell carcinoma. EBioMedicine. 2019;47:44–57. doi: 10.1016/j.ebiom.2019.08.013. - DOI - PMC - PubMed
    1. Colli ML, Hill JLE, Marroqui L, Chaffey J, Dos Santos RS, Leete P, Coomans De Brachene A, Paula FMM, Op De Beeck A, Castela A, et al. PDL1 is expressed in the islets of people with type 1 diabetes and is up-regulated by interferons-α and-γ via IRF1 induction. EBioMedicine. 2018;36:367–375. doi: 10.1016/j.ebiom.2018.09.040. - DOI - PMC - PubMed
    1. Ferris RL, Blumenschein G Jr., Fayette J, Guigay J, Colevas AD, Licitra L, Harrington K, Kasper S, Vokes EE, Even C, et al. Nivolumab for recurrent squamous-cell carcinoma of the head and neck. N Engl J Med. 2016;375(19):1856–1867. doi: 10.1056/NEJMoa1602252. - DOI - PMC - PubMed

Publication types

MeSH terms