. 2021 Jun 23:9:e11685.
doi: 10.7717/peerj.11685. eCollection 2021.

Digital mapping of soil texture in ecoforest polygons in Quebec, Canada

Affiliations

Digital mapping of soil texture in ecoforest polygons in Quebec, Canada

Louis Duchesne et al. PeerJ. .

Abstract

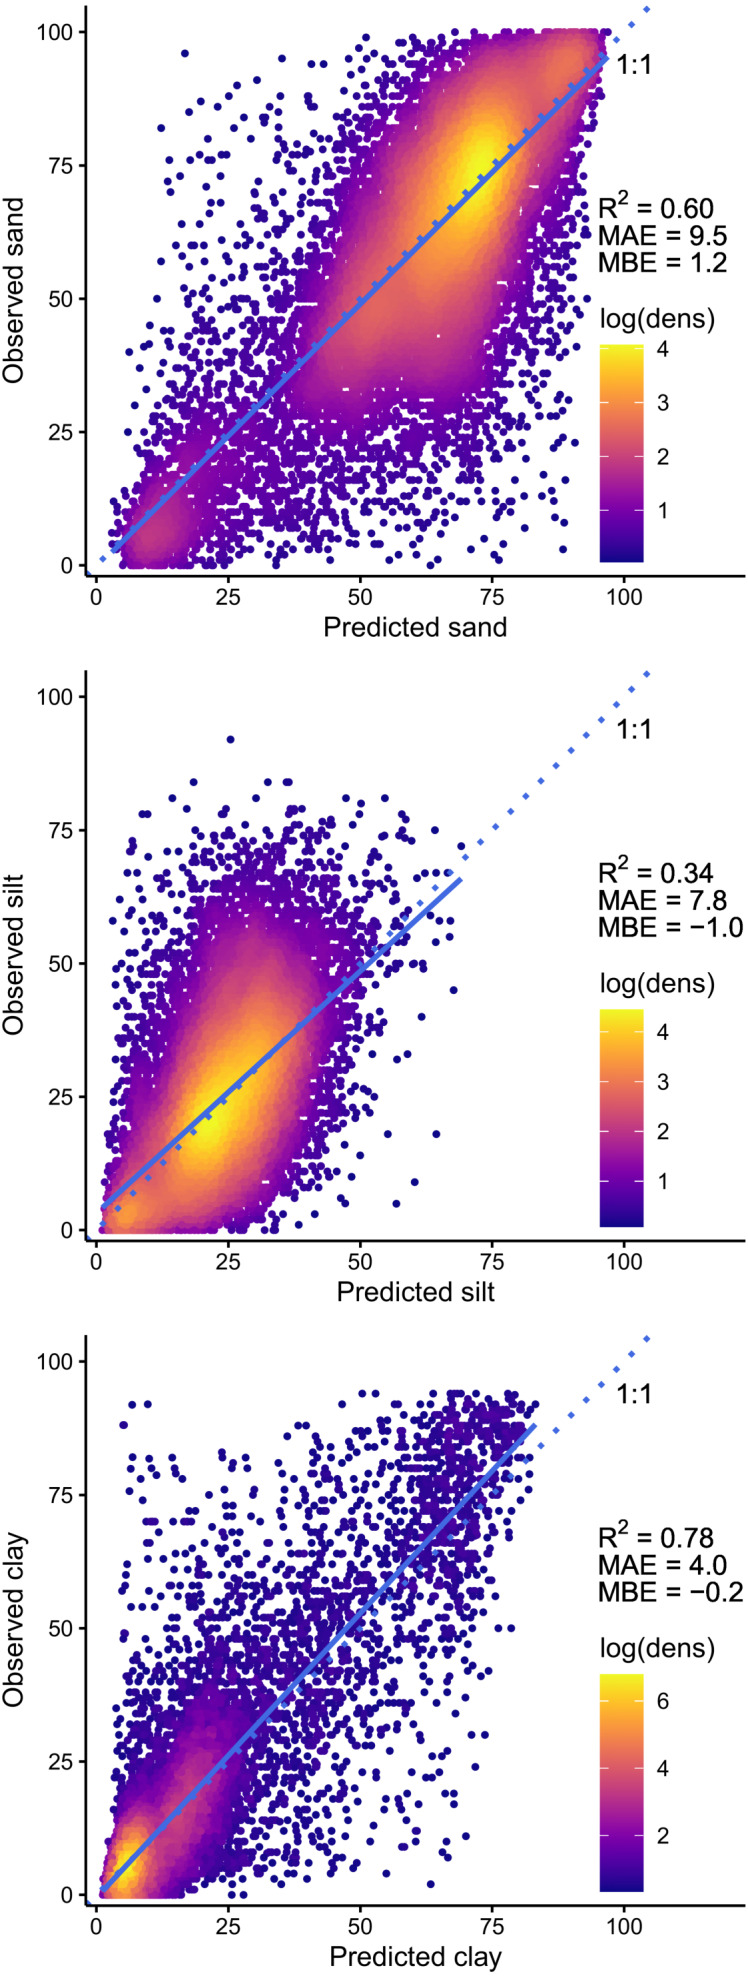
Texture strongly influences the soil's fundamental functions in forest ecosystems. In response to the growing demand for information on soil properties for environmental modeling, more and more studies have been conducted over the past decade to assess the spatial variability of soil properties on a regional to global scale. These investigations rely on the acquisition and compilation of numerous soil field records and on the development of statistical methods and technology. Here, we used random forest machine learning algorithms to model and map particle size composition in ecoforest polygons for the entire area of managed forests in the province of Quebec, Canada. We compiled archived laboratory analyses of 29,570 mineral soil samples (17,901 sites) and a set of 33 covariates, including 22 variables related to climate, five related to soil characteristics, three to spatial position or spatial context, two to relief and topography, and one to vegetation. After five repeats of 5-fold cross-validation, results show that models that include two functionally independent values regarding particle size composition explain 60%, 34%, and 78% of the variance in sand, silt and clay fractions, respectively, with mean absolute errors ranging from 4.0% for the clay fraction to 9.5% for the sand fraction. The most important model variables are those observed in the field and those interpreted from aerial photography regarding soil characteristics, followed by those regarding elevation and climate. Our results compare favorably with those of previous soil texture mapping studies for the same territory, in which particle size composition was modeled mainly from rasterized climatic and topographic covariates. The map we provide should meet the needs of provincial forest managers, as it is compatible with the ecoforest map that constitutes the basis of information for forest management in Quebec, Canada.

Keywords: Forest inventory; Geostatistics; Machine learning; Photo interpretation; Random forest; Soil mapping; Soil particle size; Soil samples; Soil texture; Spatial data.


Conflict of interest statement

The authors declare there are no competing interests.

Figures

Figure 1
Figure 1. Forest subzones and soil provinces in Quebec, Canada.
Maps were produced with QGIS software, version 3.4 (QGIS, 2020). Basemap credit: ©2021 TerraMetrics, ©2021 Google, Esri, HERE, Garmin, ©OpenStreetMap contributors, and the GIS User Community.
Figure 2
Figure 2. Spatial distribution of mineral soil texture analysis ( n = 29,570) from 3 provincial forest inventory programs in Quebec, Canada.
PSP: permanent sampling plots; EOP: ecological observation plots; SIP: site index plots. The map was produced with QGIS software, version 3.4 (QGIS, 2020). Basemap credit: ©2021 TerraMetrics, ©2021 Google, Esri, HERE, Garmin, ©OpenStreetMap contributors, and the GIS User Community.
Figure 3
Figure 3. Observed vs. predicted values of the V1 and V2 orthogonal components of each soil sample’s particle size composition (sand, silt and clay fractions).
The straight blue line corresponds to the linear regression between observed and predicted values, and dotted lines represent the 1:1 line. The 0 values of observed V1 that are aligned horizontally in the top graph correspond to observations with an identical composition of sand and silt or to soils composed entirely of sand (100%), while those of observed V2 in the bottom graph correspond to soils characterized by 0% clay. The lower rows of horizontally aligned V1 values (top graph) correspond to integer sand values of sandy soils ( >90%).
Figure 4
Figure 4. Observed soil texture composition (sand, silt and clay fractions) vs. predicted values, back-transformed from ILR-transform (V1 and V2) predictions.
The straight blue line corresponds to the linear regression between observed and predicted values, and dotted lines represent the 1:1 line.
Figure 5
Figure 5. Relative measures of variable importance in the selected models of the two orthogonal components (V1: left panel; V2: right panel) of soil texture composition (sand, silt and clay fractions).
Dot color indicates variable category. Only the 50 most important variables are shown. See Table 1 for covariate definitions.
Figure 6
Figure 6. Variograms illustrating the spatial dependence structure of the V1 and V2 orthogonal components of observed soil particle size composition of the B horizon and of the model’s residuals.
The lower dotted horizontal lines represent nuggets (y-axis intercept-related amount of short-range variability in the data) and the upper lines represent the sills (total variance at which the model first flattens out). Vertical dotted lines represent the range (distance beyond which data are no longer spatially correlated). NSR: nugget-to-sill ratio.
Figure 7
Figure 7. Gridded map (15 s resolution) of soil texture composition (diagnostic B horizon) in ecoforest polygons of the managed forest of the province of Quebec, Canada.
Only productive forest land characterized by mineral soils was mapped. Agricultural and unproductive forest land, organic soils, anthropogenic infrastructures, and water areas were excluded. Hillshade effect was added based on a 1km resolution digital elevation model. The map was produced with QGIS software, version 3.4 (QGIS, 2020). Basemap credit: ©2021 TerraMetrics, ©2021 Google.
Figure 8
Figure 8. Maps of soil texture composition at two zoom levels, for a region at the southern edge of the Abitibi and James Bay Lowlands soil province.
Only productive forest land characterized by mineral soils was mapped. Agricultural and unproductive forest land, organic soils, anthropogenic infrastructures, and water areas were excluded. Maps were produced with QGIS software, version 3.4 (QGIS, 2020). Basemap credit: ©2021 TerraMetrics, ©2021 Google.
Figure 9
Figure 9. Gridded map (15 s resolution) of the 95% prediction intervals of the V1 and V2 orthogonal components of soil texture composition (B horizon) in ecoforest polygons of the province of Quebec.
Only productive forest land characterized by mineral soils was mapped. Agricultural and unproductive forest land, organic soils, anthropogenic infrastructures, and water areas were excluded. Maps were produced with QGIS software, version 3.4 (QGIS, 2020). Basemap credit: ©2021 TerraMetrics, ©2021 Google.

References

    1. Aidoo EN, Mueller U, Goovaerts P, Hyndes GA. Evaluation of geostatistical estimators and their applicability to characterise the spatial patterns of recreational fishing catch rates. Fisheries Research. 2015;168:20–32. doi: 10.1016/j.fishres.2015.03.013. - DOI - PMC - PubMed
    1. Arrouays D, Grundy MG, Hartemink AE, Hempel JW, Heuvelink GBM, Hong SY, Lagacherie P, Lelyk G, McBratney AB, McKenzie NJ, Mendonca-Santos M. d. L, Minasny B, Montanarella L, Odeh IOA, Sanchez PA, Thompson JA, Zhang GL. GlobalSoilMap. Toward a fine-resolution global grid of soil properties. Advances in Agronomy. 2014;125:93–134. doi: 10.1016/B978-0-12-800137-0.00003-0. - DOI
    1. Barnes EM, Baker MG. Multispectral data for mapping soil texture: Possibilities and limitations. Applied Engineering in Agriculture. 2000;16:731–741. doi: 10.13031/2013.5370. - DOI
    1. Bartholomeus H, Epema G, Schaepman M. Determining iron content in Mediterranean soils in partly vegetated areas, using spectral reflectance and imaging spectroscopy. International Journal of Applied Earth Observation and Geoinformation. 2007;9:194–203. doi: 10.1016/j.jag.2006.09.001. - DOI
    1. Blouin J, Berger J-P. Guide de reconnaissance des types écologiques de la région écologique 6a - Plaine du lac Matagami et 6b - Plaine de la baie de Rupert, ministère des Ressources naturelles et de la Faune, Direction des inventaires forestiers. 2005. https://mffp.gouv.qc.ca/publications/forets/connaissances/guide-ecologiq... https://mffp.gouv.qc.ca/publications/forets/connaissances/guide-ecologiq...

LinkOut - more resources