. 2021 Jun 18:11:657002.
doi: 10.3389/fonc.2021.657002. eCollection 2021.

Prognostic Value of Eight-Gene Signature in Head and Neck Squamous Carcinoma

Affiliations

Prognostic Value of Eight-Gene Signature in Head and Neck Squamous Carcinoma

Baoling Liu et al. Front Oncol. .

Abstract

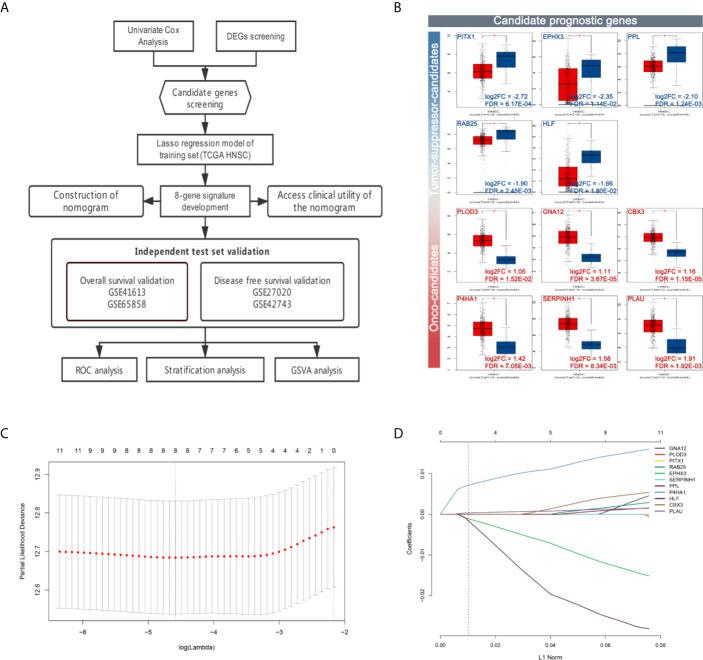
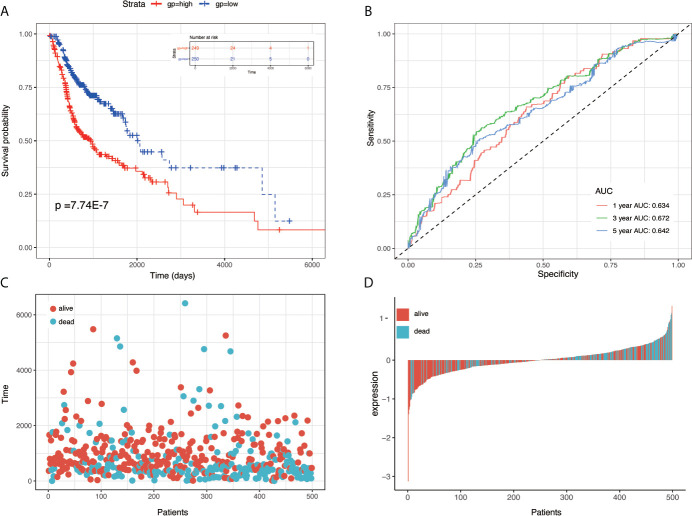
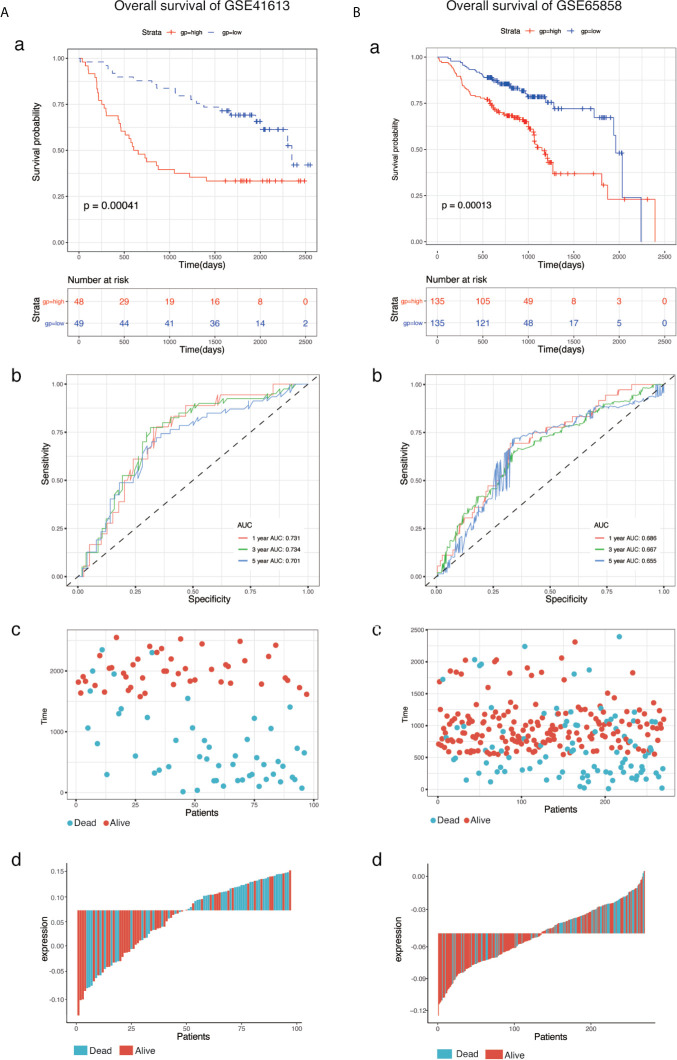
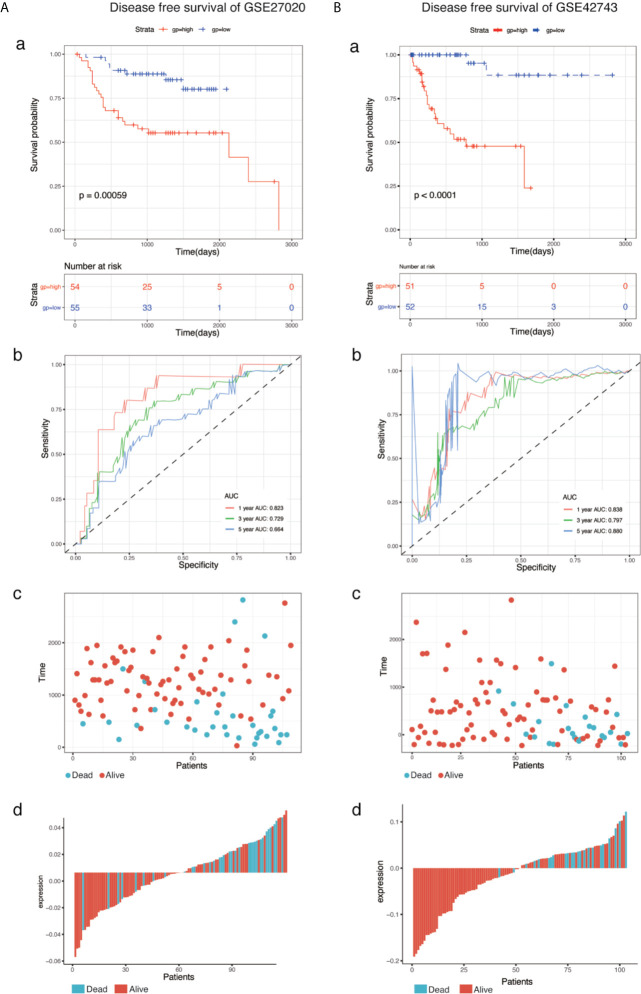
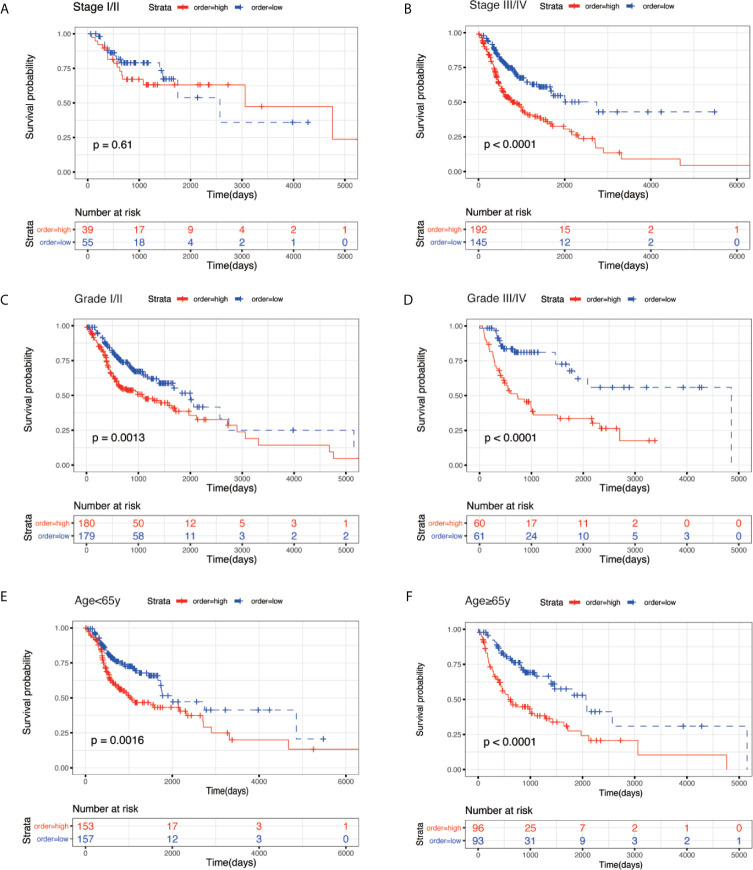
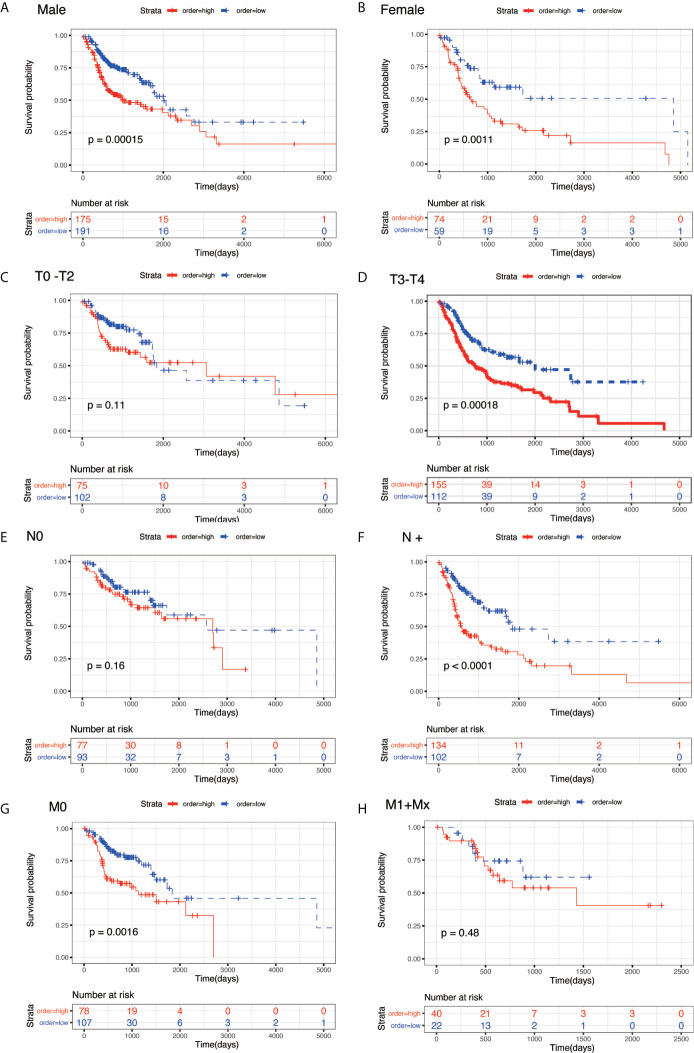
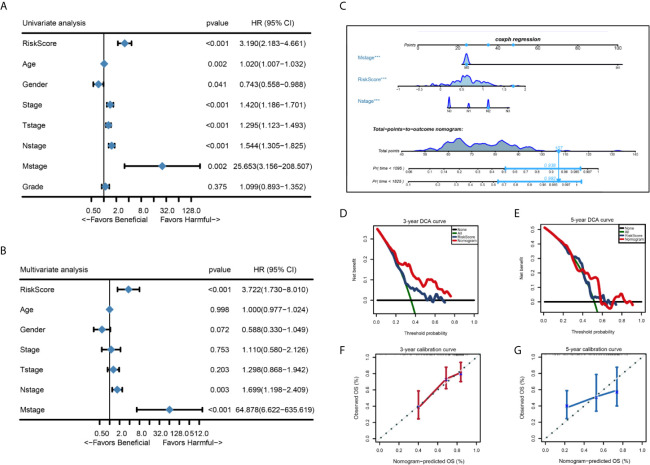
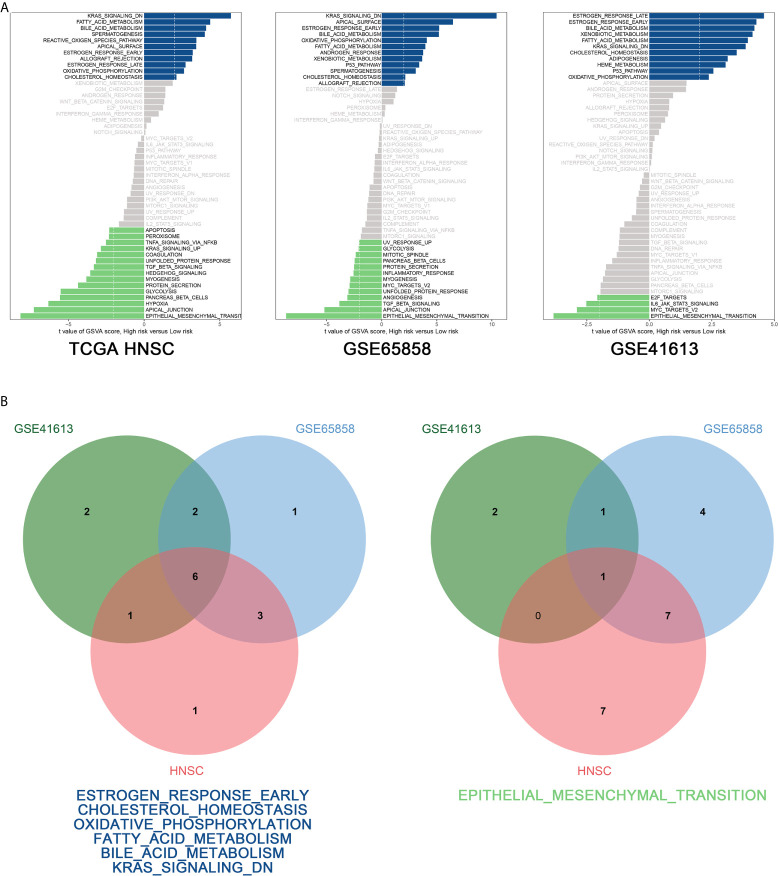
Head and neck cancer (HNC) is the fifth most common cancer worldwide. In this study, we performed an integrative analysis of the discovery set and established an eight-gene signature for the prediction of prognosis in patients with head and neck squamous cell carcinoma (HNSCC). Univariate Cox analysis was used to identify prognosis-related genes (with P < 0.05) in the GSE41613, GSE65858, and TCGA-HNSC RNA-Seq datasets after data collection. We performed LASSO Cox regression analysis and identified eight genes (CBX3, GNA12, P4HA1, PLAU, PPL, RAB25, EPHX3, and HLF) with non-zero regression coefficients in TCGA-HNSC datasets. Survival analysis revealed that the overall survival (OS) of GSE41613 and GSE65858 datasets and the progression-free survival(DFS)of GSE27020 and GSE42743 datasets in the low-risk group exhibited better survival outcomes compared with the high-risk group. To verify that the eight-mRNA prognostic model was independent of other clinical features, KM survival analysis of the specific subtypes with different clinical characteristics was performed. Univariate and multivariate Cox regression analyses were used to identify three independent prognostic factors to construct a prognostic nomogram. Finally, the GSVA algorithm identified six pathways that were activated in the intersection of the TCGA-HNSC, GSE65858, and GSE41613 datasets, including early estrogen response, cholesterol homeostasis, oxidative phosphorylation, fatty acid metabolism, bile acid metabolism, and Kras signaling. However, the epithelial-mesenchymal transition pathway was inhibited at the intersection of the three datasets. In conclusion, the eight-gene prognostic signature proved to be a useful tool in the prognostic evaluation and facilitate personalized treatment of HNSCC patients.

Keywords: Cox regression; GEO; LASSO; TCGA; head and neck squamous carcinoma; prognostic signature.


Conflict of interest statement

The authors declare that the research was conducted in the absence of any commercial or financial relationships that could be construed as a potential conflict of interest.

Figures

Figure 1
Figure 1
Workflow and construction of LASSO Cox regression model. (A) Work flow of the study. (B) Expression of the candidate prognostic genes. (C) The LASSO coefficients profiles of 11 candidate prognostic genes. (D) Tuning parameter (λ) selection cross-validation error curve. The vertical lines were drawn at the optimal values by the minimum criteria and the 1-SE criteria. We choose the right line by 1-SE criteria where the eight-gene signature was selected.
Figure 2
Figure 2
KM survival, risk score by eight-gene signature and time-dependent ROC curves in the TCGA-HNSC training set. (A) KM survival analysis between high- and low-risk samples in TCGA-HNSC. (B) Time-dependent ROC curve for OS of TCGA-HNSC; the AUC was assessed at 1, 3, and 5 years. (C) Relationship between survival time (day) and risk score rank. (D) Relationship between survival status and risk score rank.
Figure 3
Figure 3
KM survival, risk score by eight-gene signature and time-dependent ROC curves in the OS validation datasets. (A) GSE41613, (B) GSE65858. (a) KM survival analysis between high- and low-risk samples. (b) Time-dependent ROC curve for overall survival of validation datasets, the AUC was assessed at 1, 3, and 5-years. (c) Relationship between survival time (day) and risk score rank. (d) Relationship between survival status and risk score rank.
Figure 4
Figure 4
KM survival, risk score by eight-gene signature and time-dependent ROC curves in the DFS validation datasets. (A) GSE27020, (B) GSE42743. (a) KM survival analysis between high and low risk samples. (b) Time-dependent ROC curve for overall survival of validation datasets, the AUC was assessed at 1-, 3- and 5-years. (c) Relationship between survival time (day) and risk score rank. (d) Relationship between survival status and risk score rank.
Figure 5
Figure 5
KM survival subgroup analysis for all patients with HNSC according to the eight-gene signature stratified by clinical characteristics. (A) Stage I/II. (B) Stage III/IV. (C) Grade I/II. (D) Grade III/IV. (E) age <65 year. (F) age ≥ 65 year.
Figure 6
Figure 6
KM survival subgroup analysis for all patients with HNSC according to the eight-gene signature stratified by clinical characteristics. (A) male. (B) female. (C) T0–T2. (D) T3/T4. (E) N0. (F) N+. (G) M0. (H) M1 + Mx**.
Figure 7
Figure 7
Forest plot summary of univariate and multivariate analysis of 8-gene signature and nomogram to predict 3- and 5-year OS in TCGA-HNSC training set. (A, B) Univariable and multivariable analysis of OS for the TCGA-HNSC patients. The blue diamond squares on the transverse lines represent the HR and the gray transverse lines represent 95% CI. And the p value and 95% CI for each clinicopathological character were displayed in detail. (C) The nomogram for predicting proportion of patients with 3- or 5 - year OS. (D, E) Calibration curve for the prediction of 3- or 5- year overall survival. (F, G) DCA curve for the prediction of 3- or 5- year overall survival.
Figure 8
Figure 8
GSVA analysis. (A) GSVA of the TCGA-HNSC (a), GSE65858 (b), GSE41613 (c) data sets. (B) Venn diagram of the activated (a) and suppressed (b) gene sets in the indicated data sets.

References

    1. Rasmussen JH, Lelkaitis G, Hakansson K, Vogelius IR, Johannesen HH, Fischer BM, et al. . Intratumor Heterogeneity of PD-L1 Expression in Head and Neck Squamous Cell Carcinoma. Br J Cancer (2019) 120(10):1003–6. 10.1038/s41416-019-0449-y - DOI - PMC - PubMed
    1. Siegel RL, Miller KD, Jemal A. Cancer Statistics, 2020. CA Cancer J Clin (2020) 70(1):7–30. 10.3322/caac.21590 - DOI - PubMed
    1. Ma H, Chang H, Yang W, Lu Y, Hu J, Jin S. A Novel IFNalpha-induced Long Noncoding RNA Negatively Regulates Immunosuppression by Interrupting H3K27 Acetylation in Head and Neck Squamous Cell Carcinoma. Mol Cancer (2020) 19(1):4. 10.1186/s12943-019-1123-y - DOI - PMC - PubMed
    1. Zhong Q, Fang J, Huang Z, Yang Y, Lian M, Liu H, et al. . A Response Prediction Model for Taxane, Cisplatin, and 5-Fluorouracil Chemotherapy in Hypopharyngeal Carcinoma. Sci Rep (2018) 8(1):12675. 10.1038/s41598-018-31027-y - DOI - PMC - PubMed
    1. Gu X, Wang L, Boldrup L, Coates PJ, Fahraeus R, Sgaramella N, et al. . Ap001056.1, A Prognosis-Related Enhancer RNA in Squamous Cell Carcinoma of the Head and Neck. Cancers (Basel) (2019) 11(3):347. 10.3390/cancers11030347 - DOI - PMC - PubMed