

Comprehensive Landscape of Ovarian Cancer Immune Microenvironment Based on Integrated Multi-Omics Analysis
- PMID: 34222009
- PMCID: PMC8247482
- DOI: 10.3389/fonc.2021.685065
Comprehensive Landscape of Ovarian Cancer Immune Microenvironment Based on Integrated Multi-Omics Analysis
Abstract
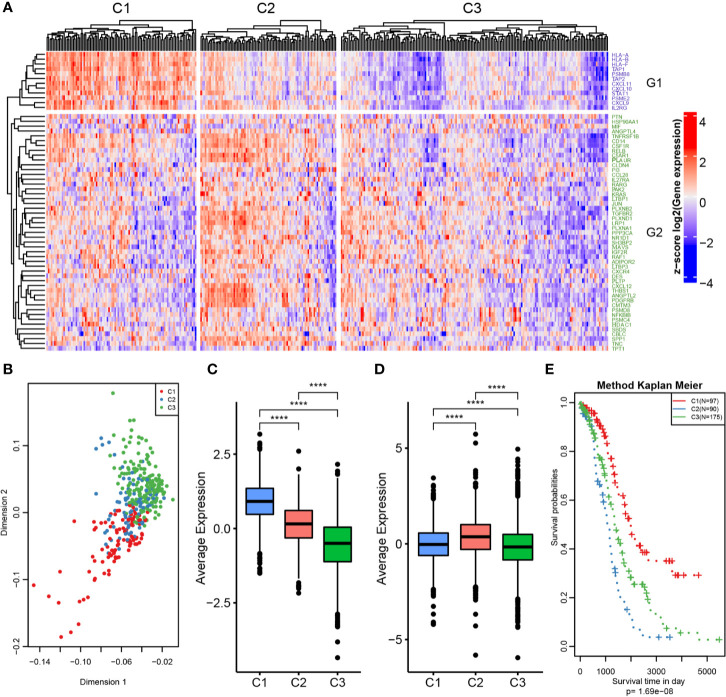
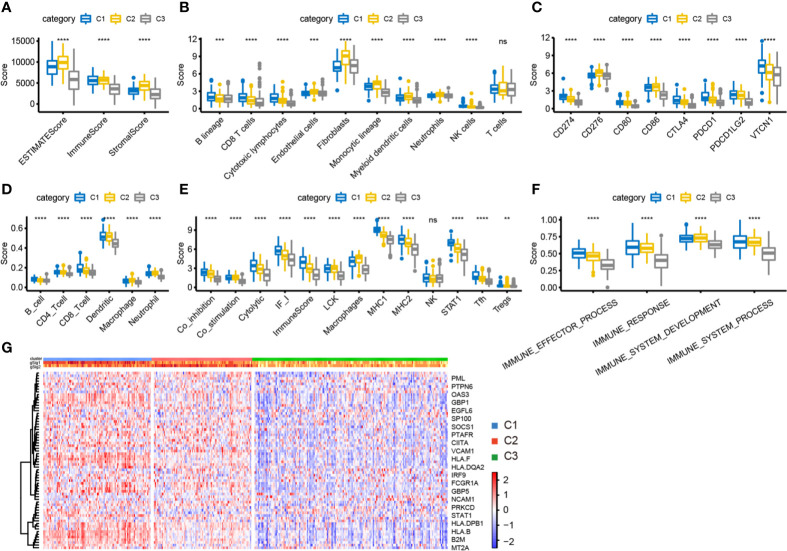
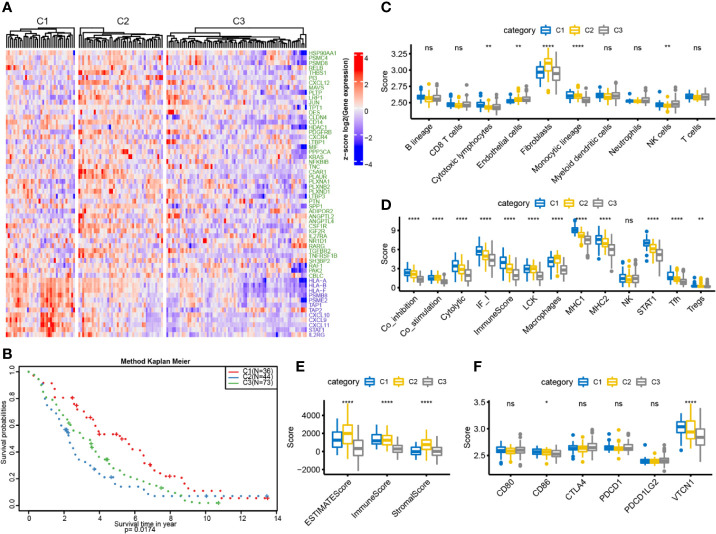
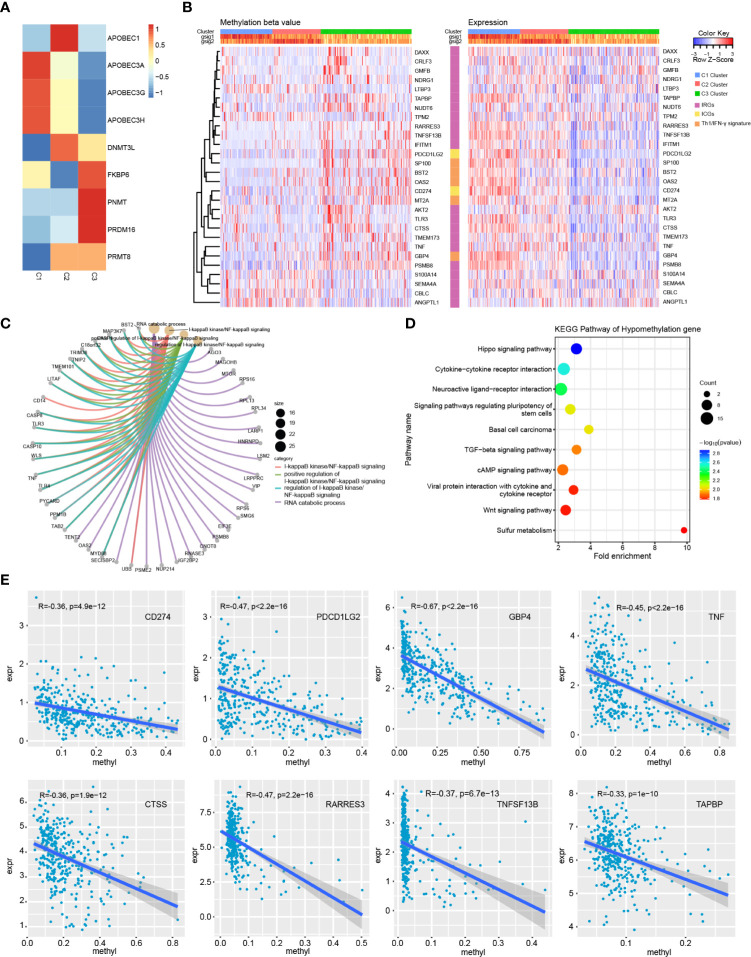
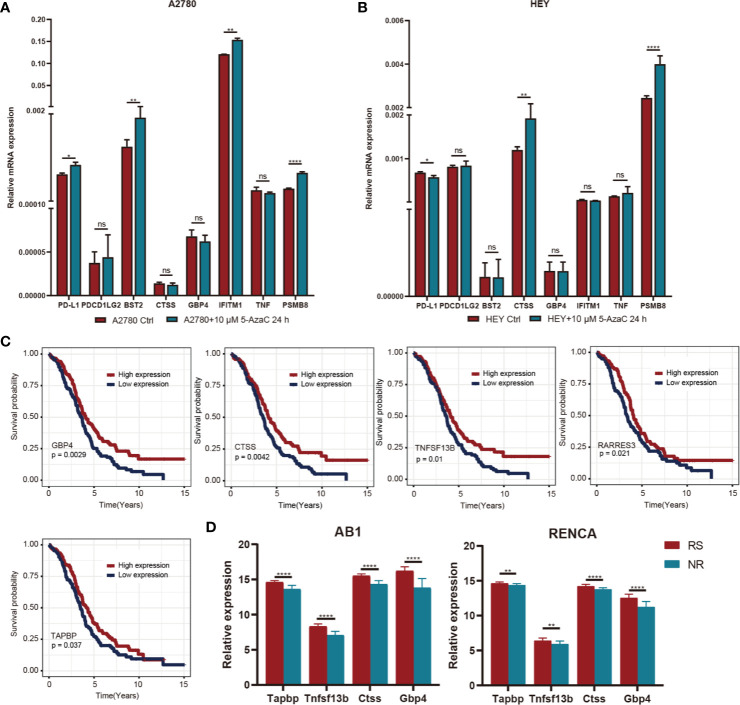
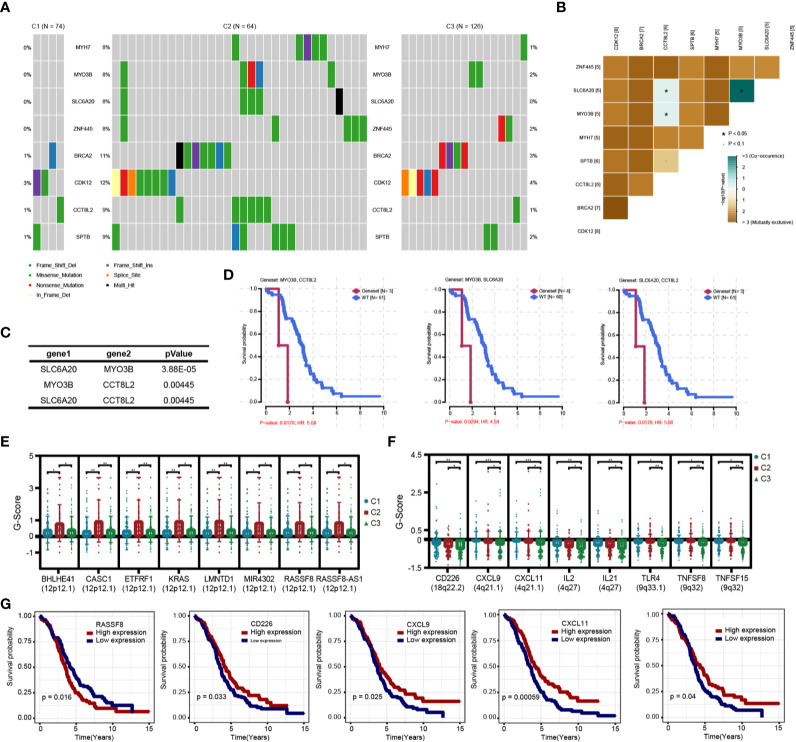
Epithelial ovarian cancer has a low response rate to immunotherapy and a complex immune microenvironment that regulates its treatment outcomes. Understanding the immune microenvironment and its molecular basis is of great clinical significance in the effort to improve immunotherapy response and outcomes. To determine the characteristics of the immune microenvironment in ovarian cancer, we stratified ovarian cancer patients into three immune subtypes (C1, C2, and C3) using immune-related genes based on gene expression data from The Cancer Genome Atlas and found that these three subtypes had significant differences in immune characteristics and prognosis. Methylation and copy number variant analysis showed that the immune checkpoint genes that influenced immune response were significantly hypermethylated and highly deleted in the immunosuppressive C3 subtype, suggesting that epigenetic therapy may be able to reverse the efficacy of immunotherapy. In addition, the mutation frequencies of BRCA2 and CDK12 were significantly higher in the C2 subtype than in the other two subtypes, suggesting that mutation of DNA repair-related genes significantly affects the prognosis of ovarian cancer patients. Our study further elucidated the molecular characteristics of the immune microenvironment of ovarian cancer, which providing an effective hierarchical method for the immunotherapy of ovarian cancer patients, and has clinical relevance to the design of new immunotherapies and a reasonable combination strategies.
Keywords: immune classification; immune microenvironment; immunotherapy; multi-omics; ovarian cancer.
Copyright © 2021 Shen, Liu, Bei and Xu.
Conflict of interest statement
The authors declare that the research was conducted in the absence of any commercial or financial relationships that could be construed as a potential conflict of interest.
Figures
Similar articles
-
Multi-Omics Characterization of Tumor Microenvironment Heterogeneity and Immunotherapy Resistance Through Cell States-Based Subtyping in Bladder Cancer.Front Cell Dev Biol. 2022 Feb 9;9:809588. doi: 10.3389/fcell.2021.809588. eCollection 2021. Front Cell Dev Biol. 2022. PMID: 35223867 Free PMC article.
-
Identification of metabolism-associated molecular subtype in ovarian cancer.J Cell Mol Med. 2021 Oct;25(20):9617-9626. doi: 10.1111/jcmm.16907. Epub 2021 Sep 15. J Cell Mol Med. 2021. PMID: 34523782 Free PMC article.
-
Identification of an Immune-Related Prognostic Gene CLEC5A Based on Immune Microenvironment and Risk Modeling of Ovarian Cancer.Front Cell Dev Biol. 2021 Oct 12;9:746932. doi: 10.3389/fcell.2021.746932. eCollection 2021. Front Cell Dev Biol. 2021. PMID: 34712666 Free PMC article.
-
Integration of local and systemic immunity in ovarian cancer: Implications for immunotherapy.Front Immunol. 2022 Nov 10;13:1018256. doi: 10.3389/fimmu.2022.1018256. eCollection 2022. Front Immunol. 2022. PMID: 36439144 Free PMC article. Review.
-
Genetic and epigenetic strategies for advancing ovarian cancer immunotherapy.Expert Opin Biol Ther. 2019 Jun;19(6):547-560. doi: 10.1080/14712598.2019.1602605. Epub 2019 Apr 15. Expert Opin Biol Ther. 2019. PMID: 30933545 Review.
Cited by
-
Sepsis-related immune signature C3 in endometrial carcinoma: implications for prognosis, tumor progression through bioinformatics and experimental validation.Mol Biol Rep. 2025 May 20;52(1):471. doi: 10.1007/s11033-025-10559-3. Mol Biol Rep. 2025. PMID: 40392380
-
Identification of the Immune Signatures for Ovarian Cancer Based on the Tumor Immune Microenvironment Genes.Front Cell Dev Biol. 2022 Mar 17;10:772701. doi: 10.3389/fcell.2022.772701. eCollection 2022. Front Cell Dev Biol. 2022. PMID: 35372348 Free PMC article.
-
Current Understanding on Why Ovarian Cancer Is Resistant to Immune Checkpoint Inhibitors.Int J Mol Sci. 2023 Jun 29;24(13):10859. doi: 10.3390/ijms241310859. Int J Mol Sci. 2023. PMID: 37446039 Free PMC article. Review.
References
-
- Matulonis UA, Shapira-Frommer R, Santin AD, Lisyanskaya AS, Pignata S, Vergote I, et al. . Antitumor Activity and Safety of Pembrolizumab in Patients With Advanced Recurrent Ovarian Cancer: Results From the Phase II Keynote-100 Study. Ann Oncol (2019) 30(7):1080–7. 10.1093/annonc/mdz135 - DOI - PubMed
LinkOut - more resources
Full Text Sources
Miscellaneous