. 2021 Jun 17:9:681734.
doi: 10.3389/fcell.2021.681734. eCollection 2021.

Disruption of the Interfacial Membrane Leads to Magnaporthe oryzae Effector Re-location and Lifestyle Switch During Rice Blast Disease

Affiliations

Disruption of the Interfacial Membrane Leads to Magnaporthe oryzae Effector Re-location and Lifestyle Switch During Rice Blast Disease

Kiersun Jones et al. Front Cell Dev Biol. .

Abstract

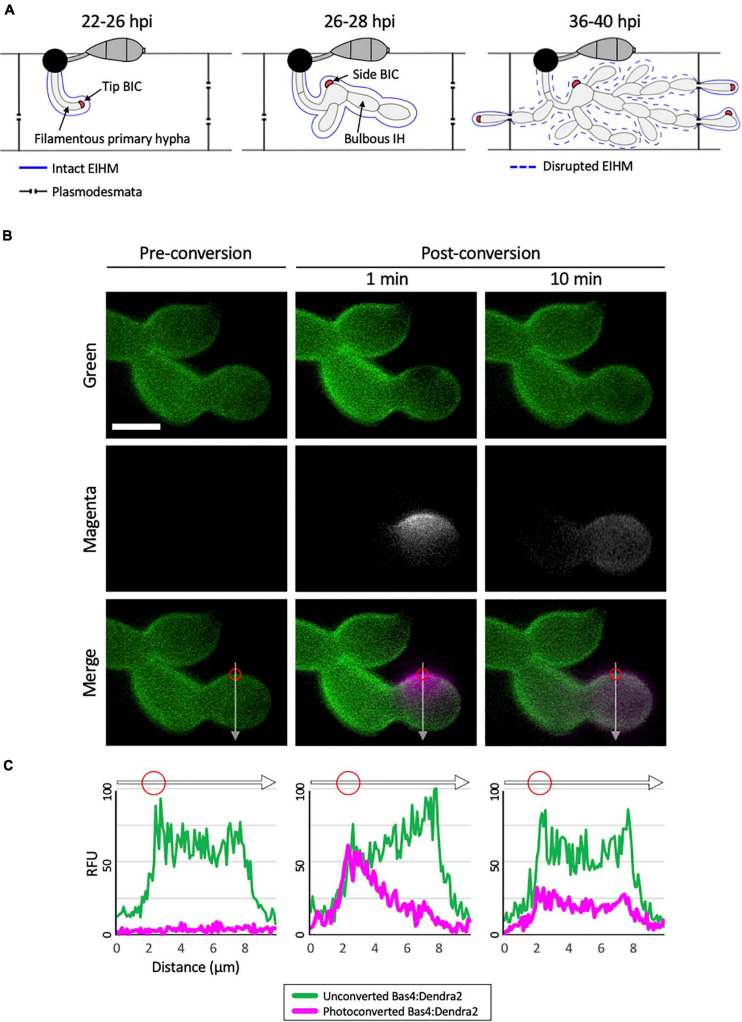
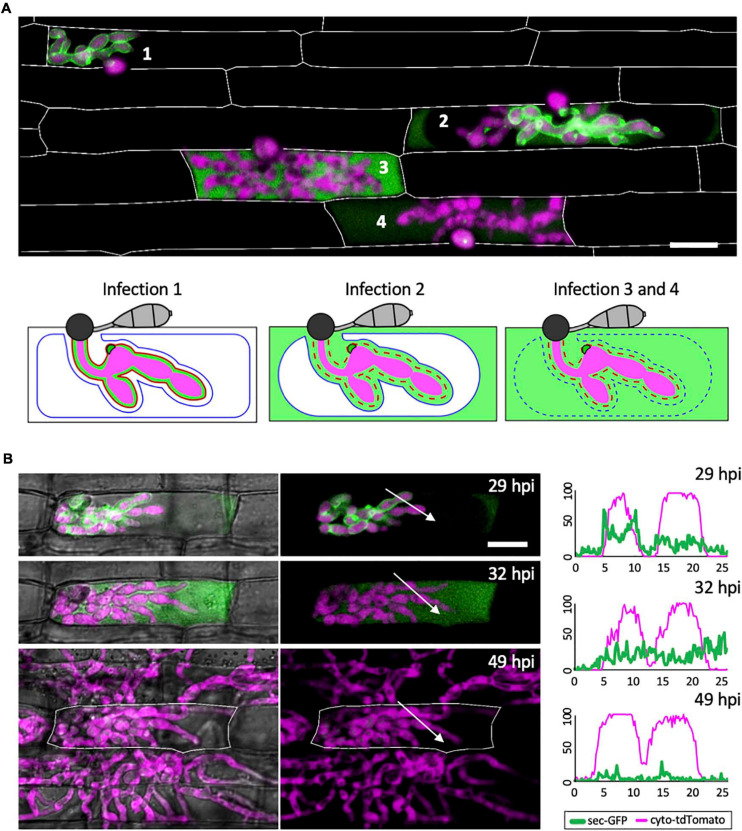
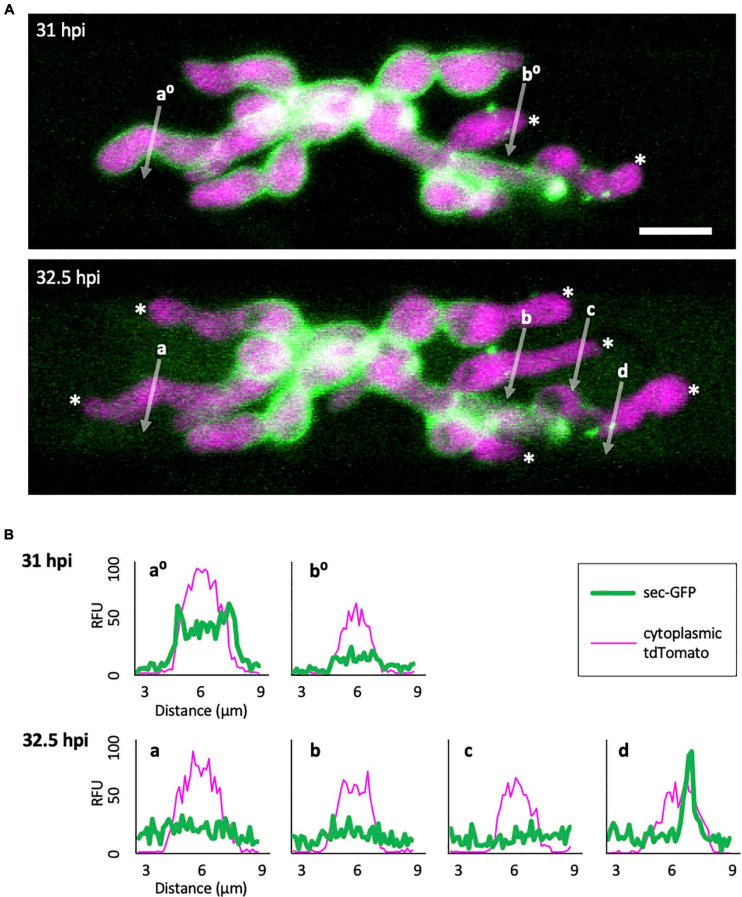
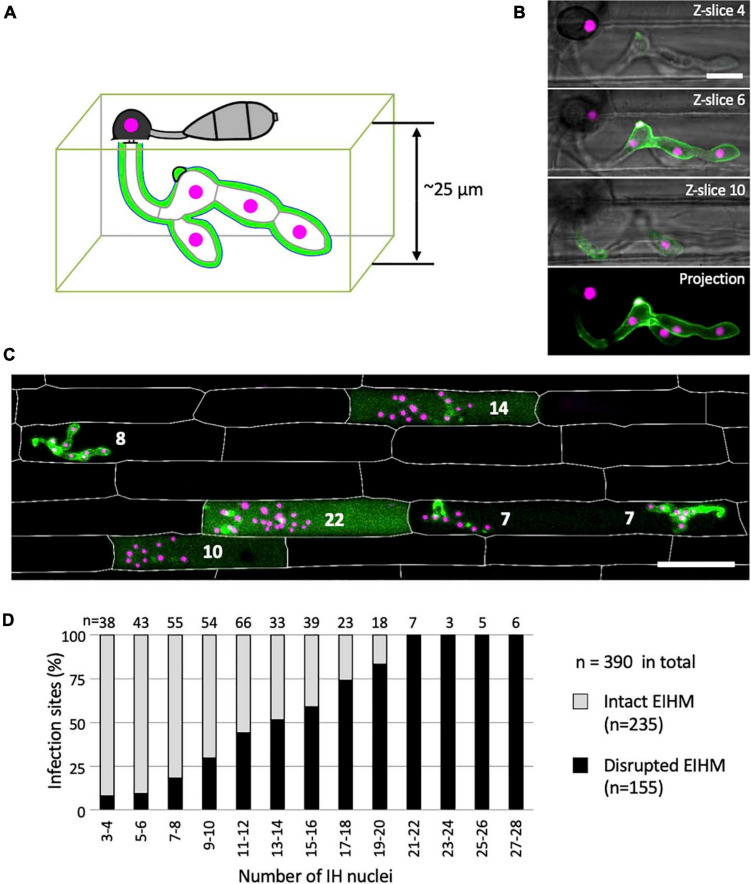
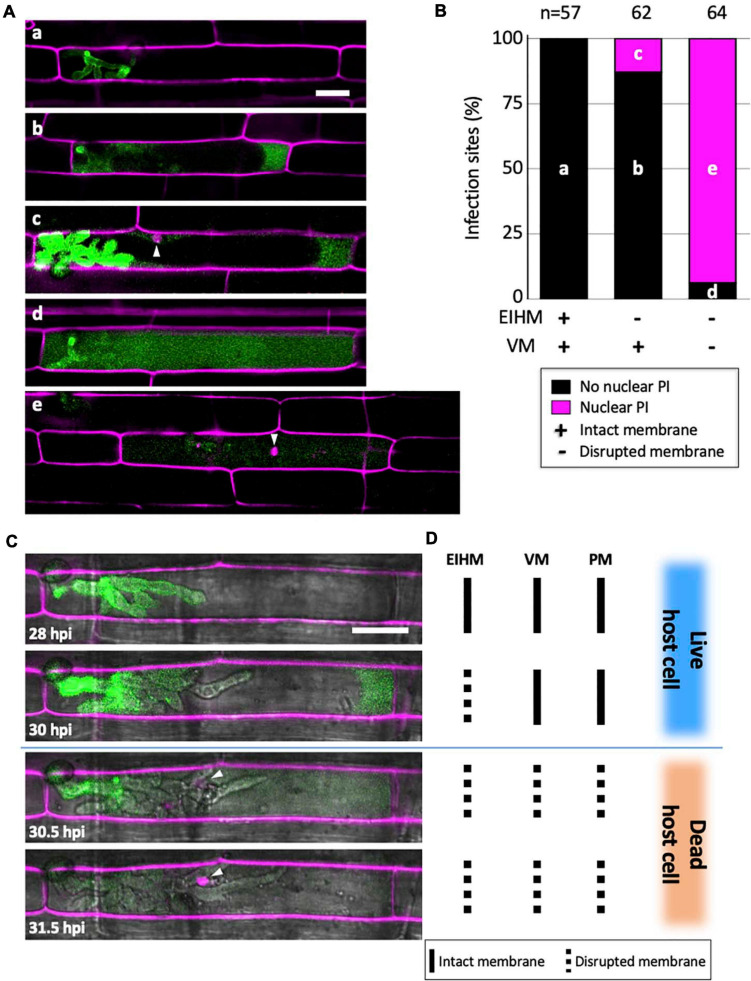
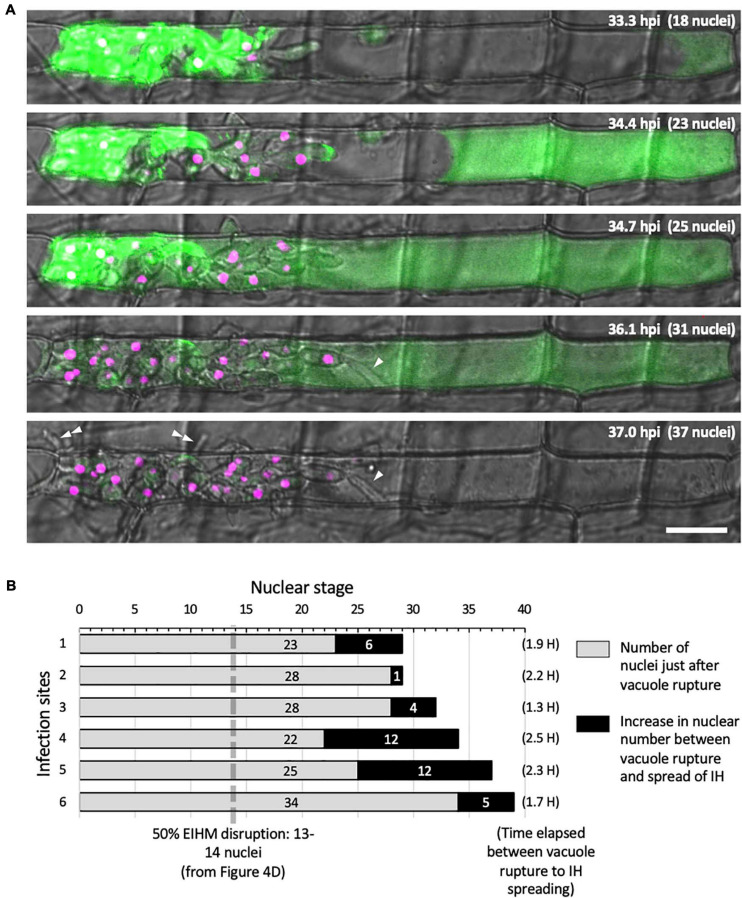
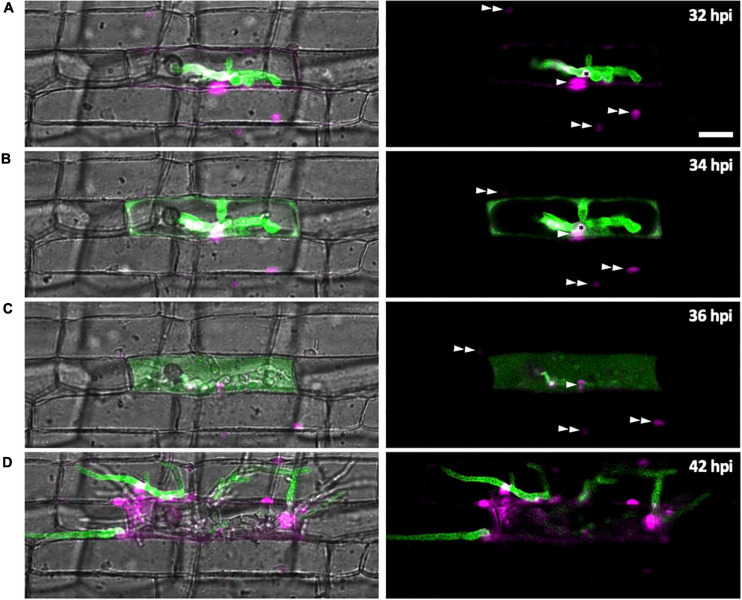
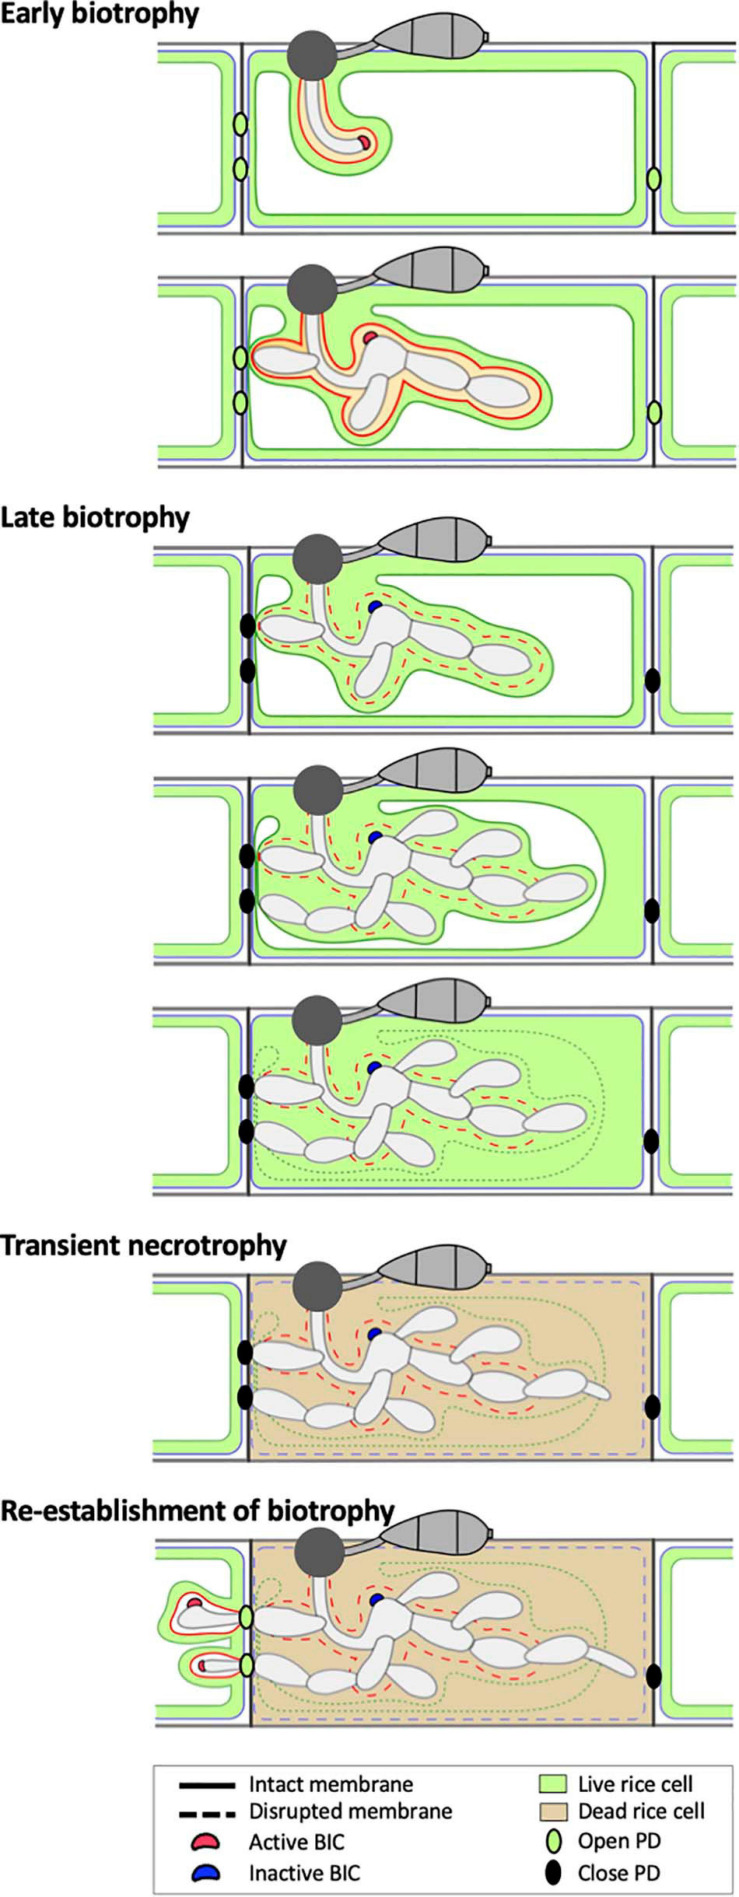
To cause the devastating rice blast disease, the hemibiotrophic fungus Magnaporthe oryzae produces invasive hyphae (IH) that are enclosed in a plant-derived interfacial membrane, known as the extra-invasive hyphal membrane (EIHM), in living rice cells. Little is known about when the EIHM is disrupted and how the disruption contributes to blast disease. Here we show that the disruption of the EIHM correlates with the hyphal growth stage in first-invaded susceptible rice cells. Our approach utilized GFP that was secreted from IH as an EIHM integrity reporter. Secreted GFP (sec-GFP) accumulated in the EIHM compartment but appeared in the host cytoplasm when the integrity of the EIHM was compromised. Live-cell imaging coupled with sec-GFP and various fluorescent reporters revealed that the loss of EIHM integrity preceded shrinkage and eventual rupture of the rice vacuole. The vacuole rupture coincided with host cell death, which was limited to the invaded cell with presumed closure of plasmodesmata. We report that EIHM disruption and host cell death are landmarks that delineate three distinct infection phases (early biotrophic, late biotrophic, and transient necrotrophic phases) within the first-invaded cell before reestablishment of biotrophy in second-invaded cells. M. oryzae effectors exhibited infection phase-specific localizations, including entry of the apoplastic effector Bas4 into the host cytoplasm through the disrupted EIHM during the late biotrophic phase. Understanding how infection phase-specific cellular dynamics are regulated and linked to host susceptibility will offer potential targets that can be exploited to control blast disease.

Keywords: cell death; effector proteins; hemibiotrophy; host-pathogen interface; live-cell imaging; plant-fungal interactions; plasmodesmata; vacuoles.


Conflict of interest statement

The authors declare that the research was conducted in the absence of any commercial or financial relationships that could be construed as a potential conflict of interest.

Figures

FIGURE 1
FIGURE 1
Bas4 is freely diffusible inside the EIHMx. (A) Schematic diagram summarizing the invasion of first and second rice cells by M. oryzae invasive hyphae (IH). At 22–26 h post inoculation (hpi), a filamentous primary hypha grows in the first-invaded host cell, where it is surrounded by an intact EIHM. Apoplastic effectors secreted by IH are retained within the EIHMx. In contrast, cytoplasmic effectors enter the host cytoplasm and show preferential accumulation at the tip BIC located at the apex of the primary hypha. At 26–28 hpi, the filamentous primary hypha switches to depolarized, asymmetric growth, leaving the BIC subapically associated with the first bulbous IH cell, becoming a side BIC. Polarized growth resumes from the BIC-associated cell, producing bulbous IH. The EIHM remains intact. At 36–40 hpi, the EIHM in the first-invaded host cell is disrupted, and IH invade neighboring host cells. Every IH that invades an adjacent rice cell is surrounded by a new EIHM and associated with a new BIC. (B) IH of M. oryzae CKF1737 expressing EIHMx-localized effector Bas4 fused to the green-to-red photoconvertible fluorescent protein Dendra2, invading a rice cell at 29 hpi. Shown are single plane confocal images of separate fluorescence (top and middle panels) and merged fluorescence (bottom panels). Left: Before photoconversion, green Bas4:Dendra2 fluorescence localized throughout the EIHMx. Middle: 1 min after selective photoconversion (region indicated by the red circle), red Bas4:Dendra2 fluorescence (magenta and pseudo-colored white) diffused into the surrounding EIHMx. Right: 10 min after photoconversion, the red Bas4:Dendra2 further diffused. White arrows indicate the locations of fluorescence intensity linescans shown in panel (C). Bar = 5 μm. (C) Linescans showing the relative fluorescence intensity between unconverted Bas4:Dendra2 (green) and photoconverted Bas4:Dendra2 (magenta), corresponding to the location of the white lines in panel (B). Red circles show the photoconverted region in panel (B). Units are relative fluorescence units (RFU; y-axis) and distance in μm (x-axis).
FIGURE 2
FIGURE 2
The EIHM loses integrity during invasion of the first host cell. (A) A merged fluorescence projection of M. oryzae CKF1996, expressing sec-GFP (green) and cytoplasmic tdTomato (magenta) in first-invaded rice cells at 32 hpi. Infections are representative of the patterns observed for sec-GFP localization: retention within the EIHMx (infection 1), spilled into the rice cytoplasm with exclusion from the vacuole (infection 2), and spilled homogenously into the rice cell lumen with a ruptured vacuole (infection 3 and 4). Rice cell walls are denoted by white outlines. The same three sec-GFP patterns are schematically illustrated with the addition of the EIHM membrane (red line) and the vacuole membrane (blue line). Disrupted membranes are indicated by a dotted line. Bar = 20 μm. (B) Shown are merged fluorescence and bright-field (left) and merged fluorescence alone (right) of a time-lapsed CKF1996 infection from 29 to 49 hpi. At 29 hpi, sec-GFP fluorescence (green) was partially spilled from the EIHMx into the rice cytoplasm and excluded from the vacuole. Three hours later, all sec-GFP fluorescence was homogenously distributed throughout the rice cell. After another 17 h, viable IH (magenta) had exited the first-invaded host cell (white outline) and had successfully invaded and colonized multiple adjacent rice cells. White arrows denote the locations used for generating the fluorescence intensity linescans. Bar = 20 μm. The linescans measure the relative fluorescence intensity of sec-GFP (green) and cytoplasmic tdTomato (magenta). At 29 hpi, two neighboring hyphae have different localization patterns of sec-GFP; one hypha is outlined by sec-GFP fluorescence (represented by the two green fluorescence peaks) while the other hypha does not show sec-GFP outlining. At 32 hpi, the same two hyphae both now lacked sec-GFP outlining. At 49 hpi, the same IH did not show significant sec-GFP fluorescence. Units are relative fluorescence units (RFU; y-axis) and distance in μm (x-axis).
FIGURE 3
FIGURE 3
Sec-GFP localization changes during the process of EIHM disruption. (A) M. oryzae CKF1996 expressing sec-GFP (green) and cytoplasmic tdTomato (magenta) invading a rice cell. Shown are merged fluorescence projections of informative focal planes from the same infection site at 31 (top) and 32.5 hpi (bottom). At 31 hpi sec-GFP localized in the host cytoplasm (not shown in the field of view) and outlined most IH (IH without asterisks and linescan a0). Two IH had lost sec-GFP outlining (white asterisks and linescan b0). The same infection 1.5 h later had increased sec-GFP accumulation in the host cell (now visible in the field of view) and loss of sec-GFP outline from additional IH (increase from 2 to 6 white asterisks). White letters and arrows denote the locations used to generate the fluorescence intensity linescans shown in panel (B). Bar = 10 μm. (B) Linescans showing the relative fluorescence intensities (RFU; y-axis, distance in μm; x-axes) of sec-GFP (green) and cytoplasmic tdTomato (magenta) from panel (A), highlighting features of sec-GFP fluorescence localization changes during the process of EIHM disruption. Linescans at 31 hpi show an IH with a sec-GFP outline (a0) and an IH without a sec-GFP outline (b0). Linescans generated from the same locations at 32.5 hpi show new loss of sec-GFP outline (a) and maintained absence of sec-GFP outlining after initial loss (b). Additional linescans show: new IH growth after sec-GFP outline loss without accumulation of new sec-GFP outline (c), and a sec-GFP puncta associated with outline loss (d). Note that linescans generated at 32.5 hpi clearly show sec-GFP fluorescence spilled into the rice cell lumen (green fluorescence not associated with IH).
FIGURE 4
FIGURE 4
The occurrence of EIHM disruption increases proportionally with nuclear stage. (A) Schematic diagram three-dimensionally depicting an epidermal rice cell invaded by M. oryzae expressing sec-GFP (green) and nuclear tdTomato (magenta). (B,C) Confocal images of rice cells invaded by M. oryzae CKF2187 expressing sec-GFP (green) and nuclear tdTomato (magenta). (B) Images of the same infection taken at different focal planes. The top three panels show merged fluorescence and bright-field from individual focal planes (indicated in the top right corner), while the last panel shows a merged fluorescence projection of all focal planes; 12 z-slices in total spanning 24 μm over the z-axis. Note that all five fungal nuclei are fully visible only in the projection view. Bar = 10 μm. (C) A merged fluorescence projection of infected rice cells at 30 hpi showing different patterns of sec-GFP localization at different IH growth stages determined by the nuclear number for each infection (white numbers). The infection to the far left shows EIHMx-localized sec-GFP (intact EIHM), while the other infections show host-localized sec-GFP (disrupted EIHM). Note the infected rice cell at the bottom right was invaded by two separate appressoria. Rice cell walls are indicated by white outlines. Bar = 50 μm. (D) A plot of the frequency of EIHM disruption according to fungal nuclear number for 390 infections of M. oryzae CKF2187 in the first-invaded host cell between 28 and 33 hpi. Sec-GFP localization patterns revealed the distribution of intact (n = 235) and disrupted (n = 155) EIHMs (y-axis) at each group of two nuclear stages (x-axis).
FIGURE 5
FIGURE 5
Vacuole rupture indicates host cell death. (A,C) Rice cells invaded by M. oryzae CKF315 (sec-GFP; green) and stained with propidium iodide (PI; magenta). Shown are single plane confocal images of merged fluorescence (A) and merged bright-field and fluorescence (C). White arrowheads indicate rice nuclei stained with PI. Bars = 20 μm. (A) Representative images from the 183 infections from 29 to 34 hpi showing the five sec-GFP and PI localization patterns observed: (a) EIHMx-exclusive sec-GFP without nuclear PI stain, (b) sec-GFP spilled into the rice cytoplasm without nuclear PI stain, (c) same as (b) but with nuclear PI stain, (d) sec-GFP homogenized throughout the host cell lumen without nuclear PI stain, (e) same as (d) but with nuclear PI stain. (B) Graph showing the distribution of the five sec-GFP and PI fluorescence patterns shown in panel (A) for all 183 infections. Black bars and magenta bars represent infections without nuclear PI staining and with nuclear PI staining, respectively. (C) Time-lapse series of a PI-stained CKF315 infection from 21 to 31 hpi showing the typical progression of sec-GFP and PI fluorescence localization changes, consistent with quantitative results in panel (B). Note that appearance of host nuclear PI fluorescence coincided with homogenization of host-localized sec-GFP fluorescence. (D) Schematic diagram summarizing the states of host membranes, corresponding to the infection shown in panel (C). EIHM, extrainvasive hyphal membrane; VM, host vacuole membrane; PM, host plasma membrane.
FIGURE 6
FIGURE 6
IH morphology changes after host cell death. (A) Representative time-lapse of M. oryzae CKF2187 expressing sec-GFP (green) and nuclear tdTomato (magenta) invading a rice cell from 33 to 37 hpi. Shown are single plane confocal images of merged bright-field and fluorescence. Nuclear stage is indicated in the upper right-hand corner together with hpi. Growth of IH become more filamentous after disruption of the vacuole (white arrowheads). The first IH to cross into the next host cell (double white arrowheads) originated from IH that had grown to be densely packed against the host cell wall before vacuole rupture. Bar = 20 μm. (B) Graphical summary showing six time-lapsed CKF2187 infections ranging from 32 to 40 hpi. Shown are the nuclear stages when vacuole rupture was observed (gray bars) and the relative increase in nuclear stage when IH were observed to spread into neighboring host cells (black bars). The time elapsed between vacuole rupture and IH spreading is shown in parenthesis, corresponding to the black bars. For additional context, the nuclear stage at which 50% EIHM disruption occurred (13–14 nuclei; Figure 4D; n = 390) is denoted by the dotted gray line.
FIGURE 7
FIGURE 7
Effector localization changes during invasion of the first few host cells. M. oryzae CKF1616 expressing apoplastic effector Bas4:EGFP (green) along with cytoplasmic effector Pwl2:mCherry:NLS (magenta) invading rice. Shown are single plane merged fluorescence and bright-field (left panels), and merged fluorescence alone (right panels) confocal images of a time-lapse series from 32 to 42 hpi. Asterisk = BIC. Single white arrowhead = first-invaded host cell nucleus with Pwl2:mCherry:NLS fluorescence. Double white arrowhead = nuclei of uninvaded host cells with Pwl2:mCherry:NLS fluorescence. (A) During the early stage of invasion, the EIHM was still intact, causing Bas4:EGFP to be retained within the EIHMx. Pwl2:mCherry:NLS was localized at the BIC, in the nucleus of the invaded cell, and in the nuclei of a few nearby cells. (B) The EIHM was disrupted, causing Bas4:EGFP to spill into the rice cytoplasm. (C) The vacuole ruptured, causing spilled Bas4:EGFP to homogenize throughout the host cell lumen. (D) IH invaded neighboring cells with Bas4:EGFP retained by new EIHMs. Pwl2:mCherry:NLS fluorescence increased upon invasion of neighboring host cells. By this time the first-invaded cell lacks significant levels of fluorescence. Bar = 20 μm.
FIGURE 8
FIGURE 8
Model of the hemibiotrophic lifestyle of M. oryzae during invasion of the first and second rice cells. Early Biotrophy: An initial invasion of a rice cell is achieved by a filamentous primary hypha, which differentiates into the first bulbous IH cell. The tip BIC positioned at the apex of the primary hypha is left at a subapical position when the first bulbous cell differentiates. Branched bulbous IH then arise from both the first bulbous cell and from the primary hypha. All IH are encased by an intact EIHM. The EIHM-encased IH also invaginate the vacuole, resulting in a thin layer of cytoplasm on the rice-facing side of the EIHM. Apoplastic effectors are retained within the EIHMx, while cytoplasmic effectors accumulate at the BIC, enter the host cytoplasm, and move symplastically through open PDs into adjacent cells. Late biotrophy: The EIHM disrupts, causing apoplastic effectors to spill from the EIHMx into the host cytoplasm and exposing IH to direct contact with the host cell cytoplasm. By this time, effector cell-to-cell movement has ceased due to closed PDs. The host vacuole progressively shrinks around growing IH, resulting in increased cytoplasmic volume. This eventually ends in rupture of the vacuole, causing the cytoplasm and vacuolar contents to homogenously mix. Transient necrotrophy: The PM becomes permeabilized when the vacuole ruptures, resulting in host cell death. This occurs in a contained manner without affecting the viability of adjacent host cells. Leading IH then differentiate more filamentous growth, which lasts at least over an hour before invasion of adjacent host cells. Re-establishment of biotrophy: The first IH to invade a neighboring cell often originates from IH which have grown to be in close association with the rice cell wall before vacuole rupture. Invasion of adjacent cells is biotrophic with formation of new BICs and EIHM as well as invagination of the vacuole. Cytoplasmic and apoplastic effectors are again delivered to the cytoplasm and EIHMx, respectively.

References

    1. Bozkurt T. O., Belhaj K., Dagdas Y. F., Chaparro-Garcia A., Wu C. H., Cano L. M., et al. (2015). Rerouting of plant late endocytic trafficking toward a pathogen interface. Traffic 16 204–226. 10.1111/tra.12245 - DOI - PubMed
    1. Christoff A. P., Turchetto-Zolet A. C., Margis R. (2014). Uncovering legumain genes in rice. Plant Sci. 215 100–109. 10.1016/j.plantsci.2013.11.005 - DOI - PubMed
    1. Cruz C. D., Valent B. (2017). Wheat blast disease: danger on the move. Trop. Plant Pathol. 42 210–222. 10.1007/s40858-017-0159-z - DOI
    1. Dangol S., Chen Y., Hwang B. K., Jwa N. S. (2019). Iron-and reactive oxygen species-dependent ferroptotic cell death in rice-Magnaporthe oryzae interactions. Plant Cell 31 189–209. 10.1105/tpc.18.00535 - DOI - PMC - PubMed
    1. Deeks M., Sánchez-Rodríguez C. (2016). Seeing is believing: cell biology at the plant–microbe interface. New Phytol. 211 16–19. 10.1111/nph.14006 - DOI - PubMed