

Changes in regional variation in mortality over five decades - The contribution of age and socioeconomic population composition
- PMID: 34222608
- PMCID: PMC8242998
- DOI: 10.1016/j.ssmph.2021.100850
Changes in regional variation in mortality over five decades - The contribution of age and socioeconomic population composition
Abstract
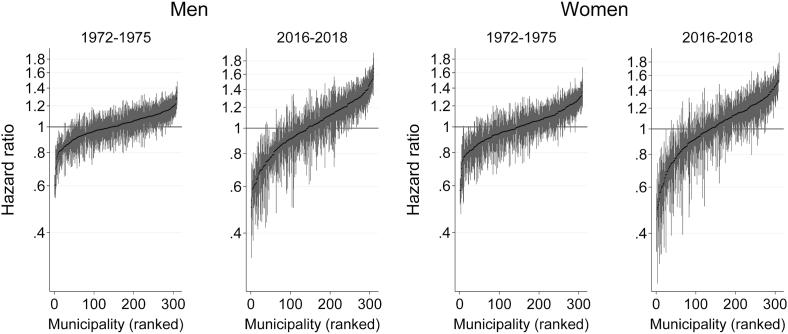
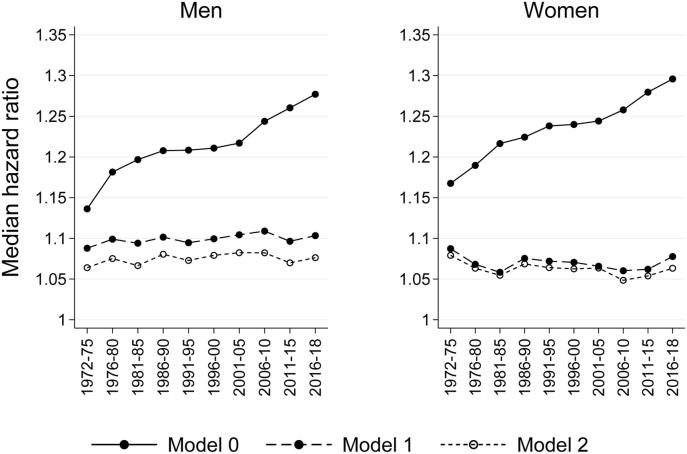
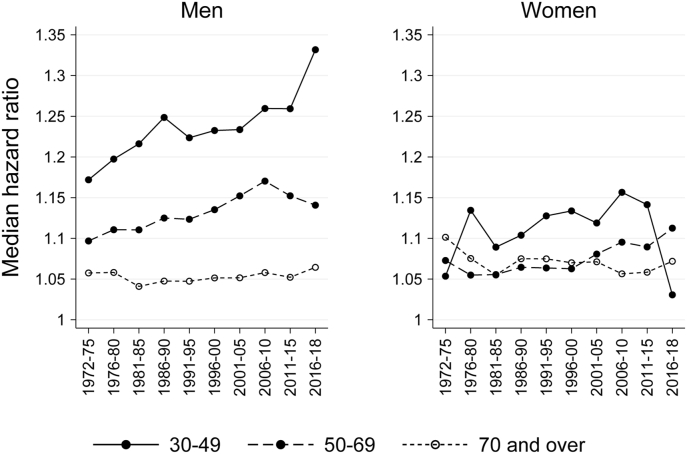
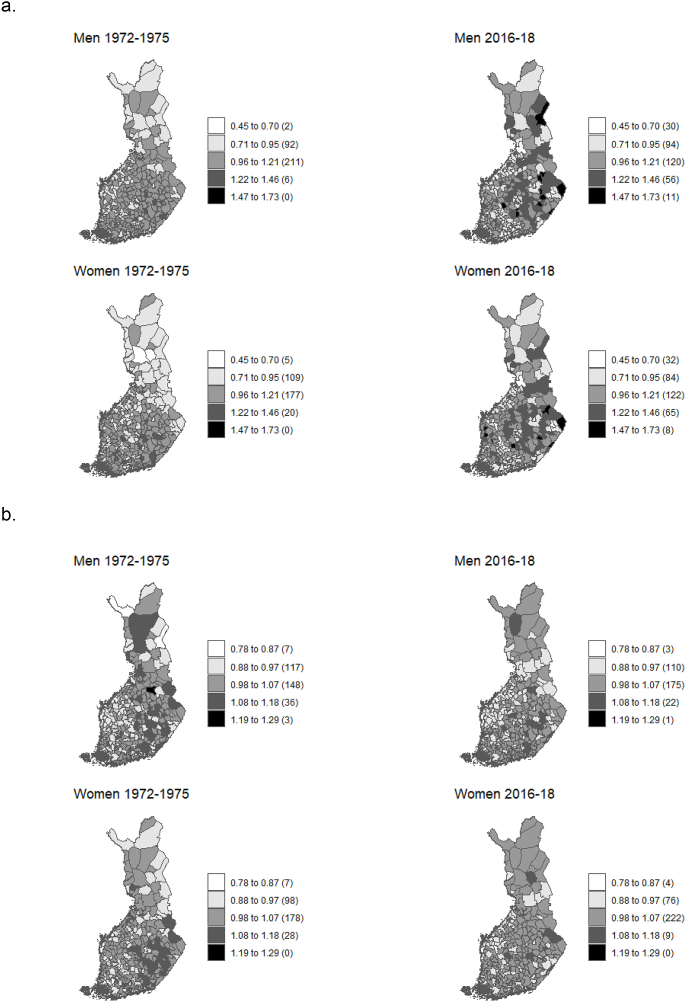
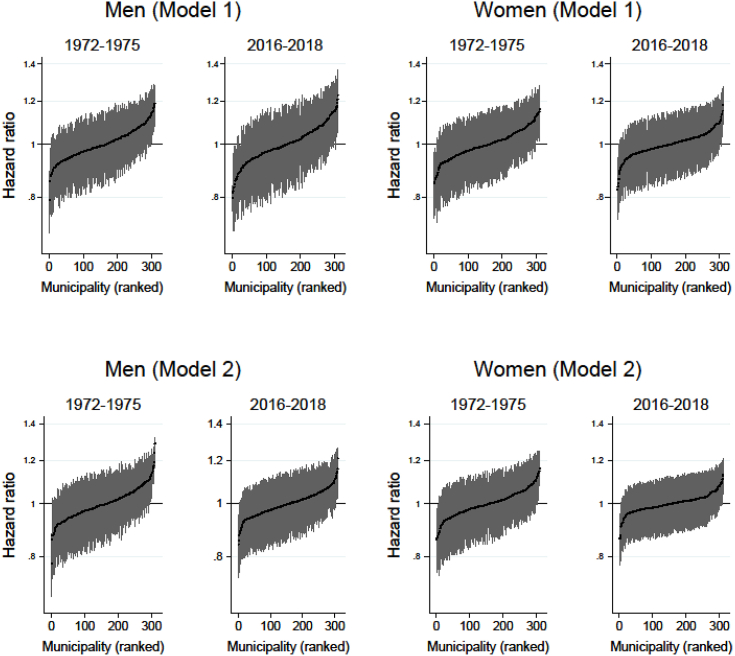
Existing evidence suggests that within-country area variation in mortality has increased in several high-income countries. Little is known about the role of changes in the population composition of areas in these trends. In this study, we look at mortality variation across Finnish municipalities over five decades. We examine trends by sex, age categories and two broad cause of death groups and assess the role of individual-level compositional factors. Analyses rely on individual-level register data on the total Finnish population aged 30 years and over. We estimated two-level Weibull survival-models with individuals nested in areas for 10 periods between 1972 and 2018 to assess municipal-level variation in mortality. Median hazard ratio (MHR) was used as our summary measure and analyses were adjusted for age and socioeconomic characteristics. The results show a clear overall growth in area variation in mortality with MHR increasing from 1.14 (95% CI 1.12-1.15) to 1.28 (CI 1.26-1.30) among men and 1.17 (CI 1.15-1.18) to 1.30 (CI 1.27-1.32) among women. This growth, however, was fully attenuated by adjustment for age. Area differentials were largest and increased most among men at ages 30-49, and particularly for external causes. This increase was largely due to increasing differentiation in the socioeconomic composition of municipalities. In conclusion, our study shows increases in mortality differentials across municipalities that are mostly attributable to increasing differentiation between municipalities in terms of individual compositional factors.
Keywords: Health inequalities; Long-term trends; Mortality; Multilevel modelling; Regional variation.
© 2021 The Authors. Published by Elsevier Ltd.
Conflict of interest statement
None.
Figures
Similar articles
-
Long-term trends in urban-neighbourhood inequalities in cause-specific mortality and hospitalisation - multilevel analyses among individuals nested in Finnish post-code areas, 1991-2018.SSM Popul Health. 2022 Dec 17;21:101323. doi: 10.1016/j.ssmph.2022.101323. eCollection 2023 Mar. SSM Popul Health. 2022. PMID: 36589271 Free PMC article.
-
[State of health of populations residing in geothermal areas of Tuscany].Epidemiol Prev. 2012 Sep-Oct;36(5 Suppl 1):1-104. Epidemiol Prev. 2012. PMID: 23139155 Italian.
-
Long-term trends in mortality by living arrangements and the role of socioeconomic factors, Finland 1991-2020.Eur J Public Health. 2025 May 9:ckaf068. doi: 10.1093/eurpub/ckaf068. Online ahead of print. Eur J Public Health. 2025. PMID: 40345138
-
[Mortality Atlas of the Campania Region. All-cause and cause-specific mortality at municipal level, 2006-2014].Epidemiol Prev. 2020 Jan-Feb;44(1 Suppl 1):1-144. doi: 10.19191/EP20.1.S1.P001.003. Epidemiol Prev. 2020. PMID: 33565290 Review. Italian.
-
[SENTIERI - Epidemiological Study of Residents in National Priority Contaminated Sites. Sixth Report].Epidemiol Prev. 2023 Jan-Apr;47(1-2 Suppl 1):1-286. doi: 10.19191/EP23.1-2-S1.003. Epidemiol Prev. 2023. PMID: 36825373 Italian.
Cited by
-
Internal migration, health selection, and the salmon bias: A register-based study of Finland.Soc Sci Med. 2025 Sep;380:118200. doi: 10.1016/j.socscimed.2025.118200. Epub 2025 May 16. Soc Sci Med. 2025. PMID: 40403590
References
-
- Bengtsson T., Dribe M. Quantifying the family frailty effect in infant and child mortality by using median hazard ratio (MHR) Historical Methods: A Journal of Quantitative and Interdisciplinary History. 2010;43(1):15–27. doi: 10.1080/01615440903270299. - DOI
-
- Bonnet F., d'Albis H. Spatial inequality in mortality in France over the past two centuries. Population and Development Review. 2020;46(1):145–168. doi: 10.1111/padr.12318. - DOI
-
- Bontje M., Musterd S. Understanding shrinkage in European regions. Built Environment. 2012;38(2):153–161. doi: 10.2148/benv.38.2.153. - DOI
LinkOut - more resources
Full Text Sources
