. 2021 Jul;35(4):1703-1712.
doi: 10.1111/jvim.16216. Epub 2021 Jul 5.

Validation of a flash glucose monitoring system in outpatient diabetic cats

Affiliations

Validation of a flash glucose monitoring system in outpatient diabetic cats

Emily K Shea et al. J Vet Intern Med. 2021 Jul.

Abstract

Background: Interstitial glucose (IG) concentration measurement using a flash glucose monitoring system (FGMS) is a noninvasive, affordable, and informative method to regulate patients with diabetes mellitus (DM) but has not been fully validated in outpatient cats with DM.

Objectives: To further validate the FreeStyle Libre FGMS in outpatient diabetic cats.

Animals: Eight client-owned cats with DM.

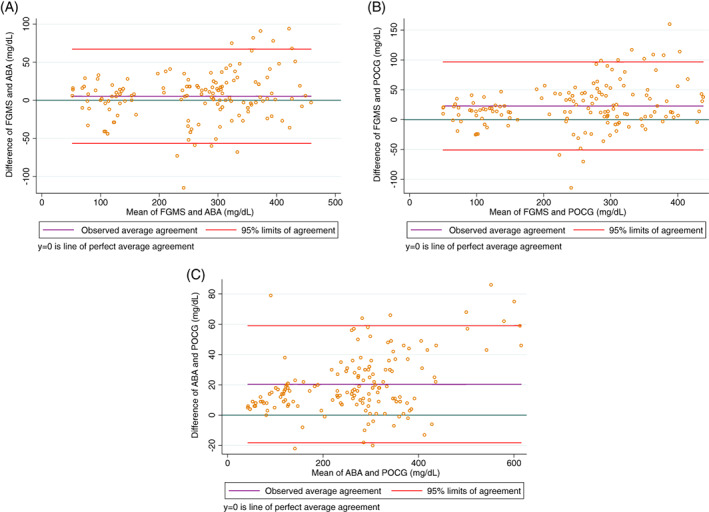
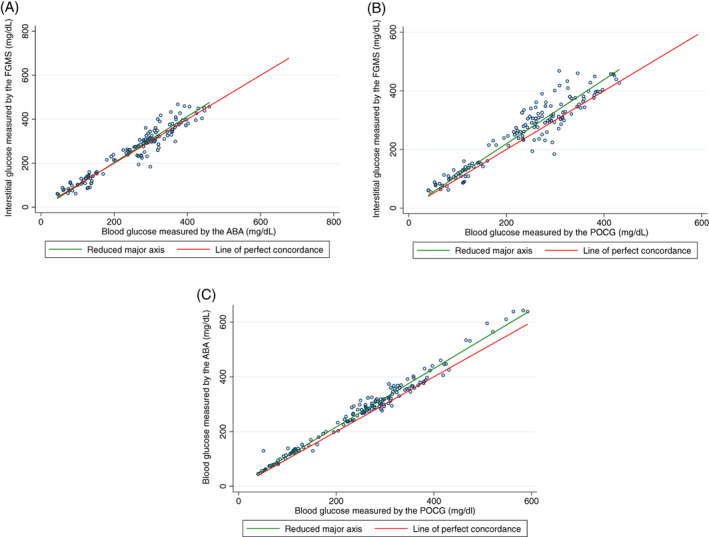
Methods: Prospective observational validation study. Tissue glue was used to attach the sensor to the cat. Lin's concordance correlation coefficient (ρc ) was used to compare IG concentrations measured by the FGMS to blood glucose concentrations measured using an automated biochemistry analyzer (ABA) and point-of-care glucometer (POCG).

Results: Data from 15 sensor placements in 8 cats were analyzed. Paired IG and ABA glucose concentrations (139 samples) had excellent correlation (ρc = 0.96) as did IG and POCG glucose concentrations (142 samples, ρc = 0.92). Sensor failure or displacement were recorded for 12/15 (80%) sensor placements. Median time of sensor activity was 7 days (range, 2-13 days).

Conclusions and clinical importance: In outpatient cats with DM, the FGMS-measured IG concentration correlated well with ABA-measured blood glucose concentration, but a high rate of sensor failures was observed.

Keywords: FreeStyle Libre; continuous glucose monitoring; diabetes mellitus; feline; interstitial glucose; tissue glue.


Conflict of interest statement

Authors declare no conflict of interest.

Figures

FIGURE 1
FIGURE 1
Bland‐Altman plot of the difference between the gold standard automated biochemistry analyzer serum glucose concentration and interstitial glucose concentration measured by the flash glucose monitoring system (A), between the blood glucose concentration measured by the point‐of‐care glucometer and interstitial glucose concentration measured by the flash glucose monitoring system (B), and between the gold standard automated biochemistry analyzer serum glucose concentration and the blood glucose concentration measured by the point‐of‐care glucometer (C) in all samples. For each plot, the green line represents a mean difference of 0 between the compared glucose concentrations, the purple line represents the actual mean difference between the compared glucose concentrations, and the red lines represent the 95% limits of agreement (mean difference ± 1.96 SD). The closer the purple line is to the green line, the better the agreement between the 2 compared glucose concentrations
FIGURE 2
FIGURE 2
Lin's concordance correlation graphs of the gold standard automated biochemistry analyzer serum glucose concentration compared to interstitial glucose concentration measured by the flash glucose monitoring system (A), blood glucose concentration measured by the point‐of‐care glucometer compared to interstitial glucose concentration measured by the flash glucose monitoring system (B), and blood glucose concentration measured by the point‐of‐care glucometer compared to the gold standard automated biochemistry analyzer serum glucose concentration (C) in all samples. For each graph, the green line represents the reduced major axis and the red line represents the line of perfect concordance. The closer the green line is to the red line, the better the correlation between the 2 compared glucose concentrations

References

    1. Prahl A, Guptill L, Glickman NW, Tetrick M, Glickman LT. Time trends and risk factors for diabetes mellitus in cats presented to veterinary teaching hospitals. J Feline Med Surg. 2007;9(5):351‐358. - PMC - PubMed
    1. Öhlund M, Fall T, Ström Holst B, Hansson‐Hamlin H, Bonnett B, Egenvall A. Incidence of diabetes mellitus in insured Swedish cats in relation to age, breed and sex. J Vet Intern Med. 2015;29(5):1342‐1347. - PMC - PubMed
    1. Öhlund M, Egenvall A, Fall T, Hansson‐Hamlin H, Röcklinsberg H, Holst BS. Environmental risk factors for diabetes mellitus in cats. J Vet Intern Med. 2017;31(1):29‐35. - PMC - PubMed
    1. Behrend E, Holford A, Lathan P, Rucinsky R, Schulman R. 2018 AAHA diabetes management guidelines for dogs and cats. J Am Anim Hosp Assoc. 2018;54(1):1‐21. - PubMed
    1. Nelson R. Stress hyperglycemia and diabetes mellitus in cats. J Vet Intern Med. 2002;16(2):121‐122. - PubMed

Publication types