

Adipocyte Heterogeneity Underlying Adipose Tissue Functions
- PMID: 34223880
- PMCID: PMC8660558
- DOI: 10.1210/endocr/bqab138
Adipocyte Heterogeneity Underlying Adipose Tissue Functions
Abstract
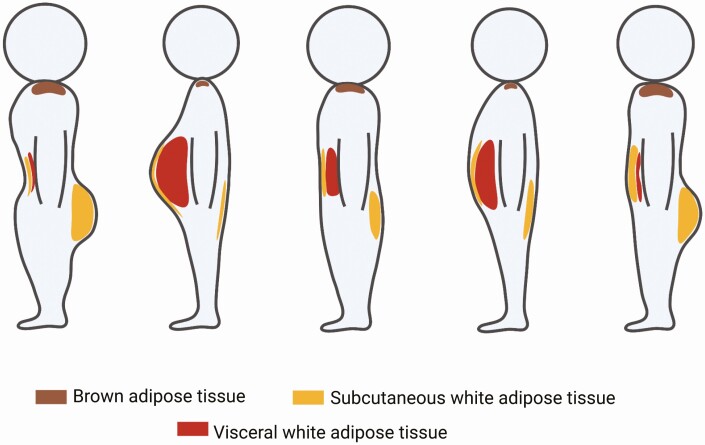
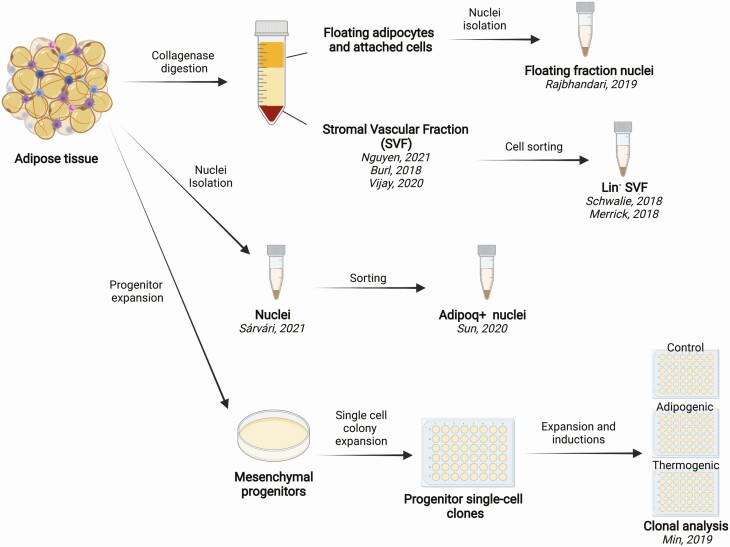
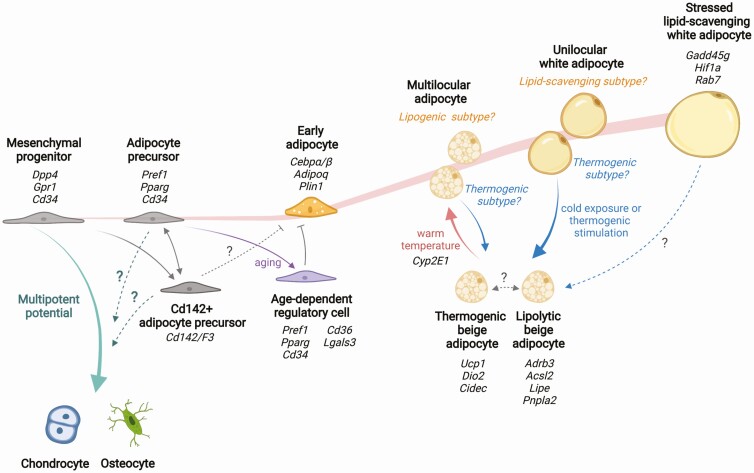
Adipose tissue distribution in the human body is highly heterogeneous, and the relative mass of different depots is differentially associated with metabolic disease risk. Distinct functions of adipose depots are mediated by their content of specialized adipocyte subtypes, best exemplified by thermogenic adipocytes found in specific depots. Single-cell transcriptome profiling has been used to define the cellular composition of many tissues and organs, but the large size, buoyancy, and fragility of adipocytes have rendered it challenging to apply these techniques to understand the full complexity of adipocyte subtypes in different depots. Discussed here are strategies that have been recently developed for investigating adipocyte heterogeneity, including single-cell RNA-sequencing profiling of the stromal vascular fraction to identify diverse adipocyte progenitors, and single-nuclei profiling to characterize mature adipocytes. These efforts are yielding a more complete characterization of adipocyte subtypes in different depots, insights into the mechanisms of their development, and perturbations associated with different physiological states such as obesity. A better understanding of the adipocyte subtypes that compose different depots will help explain metabolic disease phenotypes associated with adipose tissue distribution and suggest new strategies for improving metabolic health.
© The Author(s) 2021. Published by Oxford University Press on behalf of the Endocrine Society. All rights reserved. For permissions, please e-mail: journals.permissions@oup.com.
Figures
Similar articles
-
Fifty shades of white: Understanding heterogeneity in white adipose stem cells.Adipocyte. 2017 Jul 3;6(3):205-216. doi: 10.1080/21623945.2017.1372871. Epub 2017 Sep 12. Adipocyte. 2017. PMID: 28949833 Free PMC article. Review.
-
Diverse repertoire of human adipocyte subtypes develops from transcriptionally distinct mesenchymal progenitor cells.Proc Natl Acad Sci U S A. 2019 Sep 3;116(36):17970-17979. doi: 10.1073/pnas.1906512116. Epub 2019 Aug 16. Proc Natl Acad Sci U S A. 2019. PMID: 31420514 Free PMC article.
-
Adipocyte-specific Hypoxia-inducible gene 2 promotes fat deposition and diet-induced insulin resistance.Mol Metab. 2016 Sep 28;5(12):1149-1161. doi: 10.1016/j.molmet.2016.09.009. eCollection 2016 Dec. Mol Metab. 2016. PMID: 27900258 Free PMC article.
-
Control of brown and beige fat development.Nat Rev Mol Cell Biol. 2016 Nov;17(11):691-702. doi: 10.1038/nrm.2016.96. Epub 2016 Aug 24. Nat Rev Mol Cell Biol. 2016. PMID: 27552974 Free PMC article. Review.
-
The expanding problem of adipose depot remodeling and postnatal adipocyte progenitor recruitment.Mol Cell Endocrinol. 2017 Apr 15;445:95-108. doi: 10.1016/j.mce.2016.10.011. Epub 2016 Oct 12. Mol Cell Endocrinol. 2017. PMID: 27743993 Free PMC article. Review.
Cited by
-
Macrophage and T cell networks in adipose tissue.Nat Rev Endocrinol. 2024 Jan;20(1):50-61. doi: 10.1038/s41574-023-00908-2. Epub 2023 Oct 23. Nat Rev Endocrinol. 2024. PMID: 37872302 Review.
-
Lesson on obesity and anatomy of adipose tissue: new models of study in the era of clinical and translational research.J Transl Med. 2024 Aug 14;22(1):764. doi: 10.1186/s12967-024-05547-3. J Transl Med. 2024. PMID: 39143643 Free PMC article. Review.
-
Transfer of Proteins from Cultured Human Adipose to Blood Cells and Induction of Anabolic Phenotype Are Controlled by Serum, Insulin and Sulfonylurea Drugs.Int J Mol Sci. 2023 Mar 2;24(5):4825. doi: 10.3390/ijms24054825. Int J Mol Sci. 2023. PMID: 36902257 Free PMC article.
-
Adipose 'neighborhoods' collaborate to maintain metabolic health.Curr Opin Genet Dev. 2023 Aug;81:102079. doi: 10.1016/j.gde.2023.102079. Epub 2023 Jul 3. Curr Opin Genet Dev. 2023. PMID: 37406429 Free PMC article. Review.
-
Unraveling White Adipose Tissue Heterogeneity and Obesity by Adipose Stem/Stromal Cell Biology and 3D Culture Models.Cells. 2023 Jun 8;12(12):1583. doi: 10.3390/cells12121583. Cells. 2023. PMID: 37371053 Free PMC article. Review.
References
-
- Centers for Disease Control and Prevention. Defining adult overweight & obesity. April 28, 2021. https://www.cdc.gov/obesity/adult/defining.html. Accessed November 2, 2021.
-
- World Health Organization. Waist circumference and waist-hip ratio: report of a WHO expert consultation; 8-11 December 2008. Geneva: World Health Organization. 2011.
-
- Vazquez G, Duval S, Jacobs DR Jr, Silventoinen K. Comparison of body mass index, waist circumference, and waist/hip ratio in predicting incident diabetes: a meta-analysis. Epidemiol Rev. 2007;29:115-128. - PubMed
