

Association Between Caseload Surge and COVID-19 Survival in 558 U.S. Hospitals, March to August 2020
- PMID: 34224257
- PMCID: PMC8276718
- DOI: 10.7326/M21-1213
Association Between Caseload Surge and COVID-19 Survival in 558 U.S. Hospitals, March to August 2020
Abstract
Background: Several U.S. hospitals had surges in COVID-19 caseload, but their effect on COVID-19 survival rates remains unclear, especially independent of temporal changes in survival.
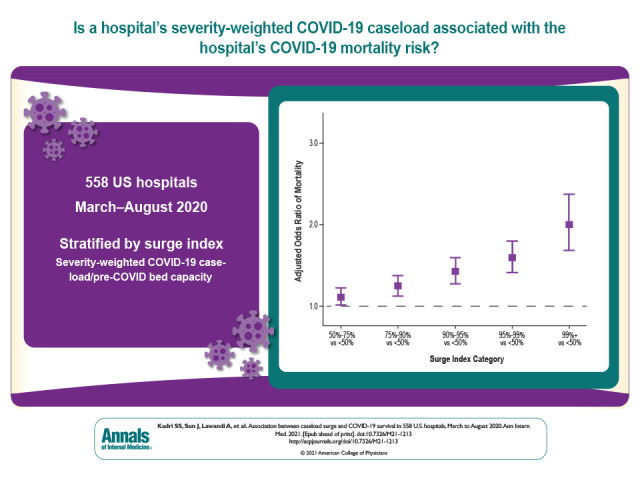
Objective: To determine the association between hospitals' severity-weighted COVID-19 caseload and COVID-19 mortality risk and identify effect modifiers of this relationship.
Design: Retrospective cohort study. (ClinicalTrials.gov: NCT04688372).
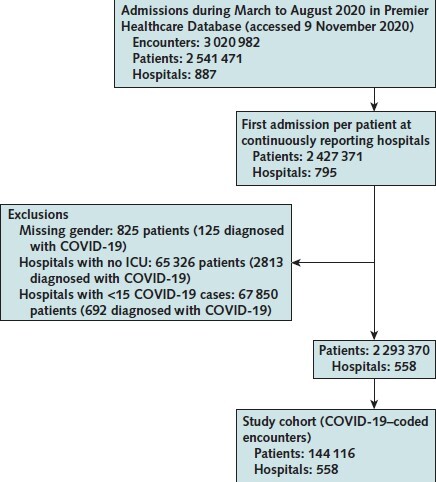
Setting: 558 U.S. hospitals in the Premier Healthcare Database.
Participants: Adult COVID-19-coded inpatients admitted from March to August 2020 with discharge dispositions by October 2020.
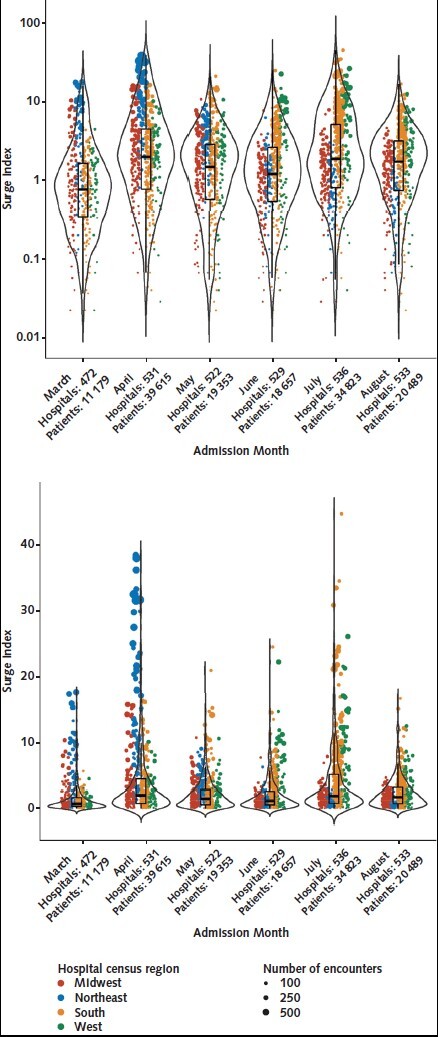
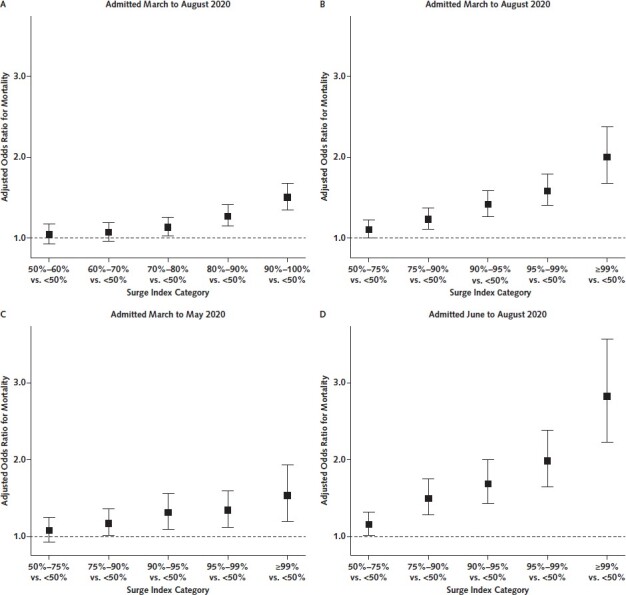
Measurements: Each hospital-month was stratified by percentile rank on a surge index (a severity-weighted measure of COVID-19 caseload relative to pre-COVID-19 bed capacity). The effect of surge index on risk-adjusted odds ratio (aOR) of in-hospital mortality or discharge to hospice was calculated using hierarchical modeling; interaction by surge attributes was assessed.
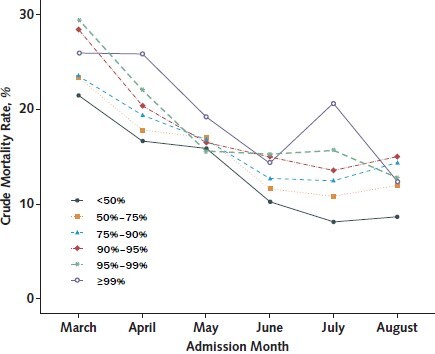
Results: Of 144 116 inpatients with COVID-19 at 558 U.S. hospitals, 78 144 (54.2%) were admitted to hospitals in the top surge index decile. Overall, 25 344 (17.6%) died; crude COVID-19 mortality decreased over time across all surge index strata. However, compared with nonsurging (<50th surge index percentile) hospital-months, aORs in the 50th to 75th, 75th to 90th, 90th to 95th, 95th to 99th, and greater than 99th percentiles were 1.11 (95% CI, 1.01 to 1.23), 1.24 (CI, 1.12 to 1.38), 1.42 (CI, 1.27 to 1.60), 1.59 (CI, 1.41 to 1.80), and 2.00 (CI, 1.69 to 2.38), respectively. The surge index was associated with mortality across ward, intensive care unit, and intubated patients. The surge-mortality relationship was stronger in June to August than in March to May (slope difference, 0.10 [CI, 0.033 to 0.16]) despite greater corticosteroid use and more judicious intubation during later and higher-surging months. Nearly 1 in 4 COVID-19 deaths (5868 [CI, 3584 to 8171]; 23.2%) was potentially attributable to hospitals strained by surging caseload.
Limitation: Residual confounding.
Conclusion: Despite improvements in COVID-19 survival between March and August 2020, surges in hospital COVID-19 caseload remained detrimental to survival and potentially eroded benefits gained from emerging treatments. Bolstering preventive measures and supporting surging hospitals will save many lives.
Primary funding source: Intramural Research Program of the National Institutes of Health Clinical Center, the National Institute of Allergy and Infectious Diseases, and the National Cancer Institute.
Conflict of interest statement
Figures
Comment in
-
When COVID-19 Strikes Your Hospital.Ann Intern Med. 2021 Sep;174(9):1319-1320. doi: 10.7326/M21-2681. Epub 2021 Jul 6. Ann Intern Med. 2021. PMID: 34224264 Free PMC article.
References
-
- Centers for Medicare & Medicaid Services. COVID-19 Emergency Declaration Blanket Waivers for Health Care Providers. Updated 24 May 2021. Accessed at www.cms.gov/files/document/summary-covid-19-emergency-declaration-waiver... on 28 June 2021.
-
- Perez S , Innes GK , Walters MS , et al. Increase in hospital-acquired carbapenem-resistant Acinetobacter baumannii infection and colonization in an acute care hospital during a surge in COVID-19 admissions—New Jersey, February–July 2020. MMWR Morb Mortal Wkly Rep. 2020;69:1827-31. [PMID: ] doi: 10.15585/mmwr.mm6948e1 - DOI - PMC - PubMed
Publication types
MeSH terms
Substances
Associated data
LinkOut - more resources
Full Text Sources
Medical