. 2021 Oct 15;18(sup1):75-87.
doi: 10.1080/15476286.2021.1940020. Epub 2021 Jul 5.

The RNA editing enzyme ADAR2 restricts L1 mobility

Affiliations

The RNA editing enzyme ADAR2 restricts L1 mobility

Loredana Frassinelli et al. RNA Biol. .

Abstract

Adenosine deaminases acting on RNA (ADARs) are enzymes that convert adenosines to inosines in double-stranded RNAs (RNA editing A-to-I). ADAR1 and ADAR2 were previously reported as HIV-1 proviral factors. The aim of this study was to investigate the composition of the ADAR2 ribonucleoprotein complex during HIV-1 expression. By using a dual-tag affinity purification procedure in cells expressing HIV-1 followed by mass spectrometry analysis, we identified 10 non-ribosomal ADAR2-interacting factors. A significant fraction of these proteins was previously found associated to the Long INterspersed Element 1 (LINE1 or L1) ribonucleoparticles and to regulate the life cycle of L1 retrotransposons. Considering that we previously demonstrated that ADAR1 is an inhibitor of LINE-1 retrotransposon activity, we investigated whether also ADAR2 played a similar function. To reach this goal, we performed specific cell culture retrotransposition assays in cells overexpressing or ablated for ADAR2. These experiments unveil a novel function of ADAR2 as suppressor of L1 retrotransposition. Furthermore, we showed that ADAR2 binds the basal L1 RNP complex.Overall, these data support the role of ADAR2 as regulator of L1 life cycle.

Keywords: ADAR2; LINE-1; RNA editing; double-stranded RNA (dsRNA); retrotransposons.


Conflict of interest statement

No potential conflict of interest was reported by the author(s).

Figures

Figure 1.
Figure 1.
Isolation of the ADAR2 native complex by dual-tag affinity purification. Total cell extract was prepared from 293 T cells transfected with either pADAR2-V5 or pV5 empty vector and the proviral NL4-3 genome and then subjected to two steps of immunoprecipitation (IP), first with the NiNTA Magnetic Beads and then the eluted His-tagged native protein complex was subjected to a second step of IP using the anti-V5-tag magnetic beads. The resulting magnetic beads were resuspended in SDS loading buffer and the protein separated by SDS-PAGE, visualized by Sypro–Ruby staining and subjected to nano-LC-MALDI-TOF/TOF analysis. ADAR2-V5 and all the 10 non-ribosomal proteins identified as putative ADAR2-interacting factors are indicated
Figure 2.
Figure 2.
Validation of the results of the nano LC-MALDI-TOF/TOF data by co-immunoprecipitation (Co-IP) experiments. A) 293 T cells were co-transfected with pADAR2-V5 or pV5 empty vector and the proviral NL4-3 genome and then subjected to IP with anti-V5-tag magnetic beads followed by Western blot (WB) analysis with anti-V5, anti-PSF, anti-NCL, anti-hnRNP C1/C2, anti-NONO and anti-ADAR1 antibodies. Total cell lysates were mock-treated or RNase (A+ V1)-treated prior to IP. WB analysis of 10 μg of cell lysate inputs (input) is shown. Complete RNA digestion after RNase-treatment of the cell extract (lysate) prior IP was confirmed by loading a fraction of the treated and untreated cell extract onto 1% agarose/formaldehyde gel followed by electrophoresis and ethidium bromide staining (data not shown). B) The same experiment performed in panel A) without the transfection of the proviral NL4-3 genome
Figure 3.
Figure 3.
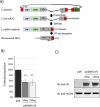
Overexpression of ADAR2 inhibits L1 retrotransposition. A) Schematic representation of the pYX014 cassette and the rational of L1 retrotransposition assay, as previously described [60]. The Fluc indicator cassette is cloned into the L1 3ʹ UTR in antisense orientation relative to L1 transcription. This cassette has its own promoter (P2) and the Fluc coding sequence is interrupted by a gamma globin intron. An Rluc cassette, containing its own promoter (P3), is incorporated into the backbone of the plasmid and allows measurement of the transfection efficiency. The Fluc gene can be expressed only when the L1 transcript (L1 pre-mRNA) is spliced (L1 mRNA), reverse transcribed and inserted into genomic DNA B) Hela cells were co-transfected in triplicate with two different amounts of the vector pADAR2-V5 or the control empty vector pV5, together with the retrotransposition cassette pYX014. After three days of puromycin selection the total cell extract was prepared and the level of both Firefly luciferase and Renilla luciferase were measured by a luminometer. The ratio Fluc/Rluc was used to measure the retrotransposition efficiency (Y-axis). The different samples are indicated in the X-axis. The data are calculated as the means ± SD from three independent experiments and normalized to the control pV5 that is set at 100%. P-values were calculated by two-tailed t test and they are indicated above each histogram (**P < 0.01). C) 48 h post-transfection the expression of ADAR2-V5 was analysed by WB, using the specific antibody anti-V5. The antibody anti-Actin was used to normalize the expression of ADAR2-V5
Figure 4.
Figure 4.
Depletion of ADAR2 increases L1 retrotransposition. A) WB analysis of total cell extracts prepared from the single clones ADAR2 KO1 and KO2 partially depleted for ADAR2 expression, the CTR control clone and the parental 293 T cells. The relative amount of ADAR2 protein is indicated in all the samples by setting 293 T cells as 100% B) Representative Fluc retrotransposition assay results: ADAR2 KO1, KO2 clones and CTR control clone were co-transfected in triplicate with the retrotransposition cassette pYX014. After three days of puromycin selection the total cell extract was prepared and the level of both Firefly luciferase and Renilla luciferase were measured by a luminometer. The ratio Fluc/Rluc was used to measure the retrotransposition efficiency (Y-axis). The different samples are indicated in the X-axis. The data are calculated as the means ± SD from three technical replicates of a single representative experiment and normalized to the control clone CTR. P-values were calculated by two-tailed t test and they are indicated above each histogram (***P < 0.001). The experiment was conducted three times (biological replicates) with similar results. C) Blasticidin resistance-based retrotransposition assay. Top panel, schematic representation of the 99 PUR-RPS-pBlaster1 cassette. Bottom panel, ADAR2 KO1, KO2 clones and CTR control clone were transfected with 99-PUR-RPS-pBlaster1 and ninety-six hours post-transfection cells were selected with blastidicin. After 15 days of selection cells were stained and counted. The resulting number of drug-resistant colonies provides a readout of retrotransposition activity. This number was then normalized for the transfection efficiency and for the number of blasticidin-resistant colonies obtained by transfecting the same clones with the pcDNA6 plasmid that confers to the transfected cells resistance to blasticidin without the need of retrotransposition (Y-axis). The different samples are indicated in the X-axis. The data are calculated as the means ± SD from three technical replicates of a single representative experiment and normalized to the control clone CTR set as 100%. P-values were calculated by two-tailed t test and they are indicated above each histogram (**P < 0.01, ***P < 0.001). The experiment was conducted three times (biological replicates) with similar results. D) Representative T25 flasks with crystal violet-stained blasticidin-resistant colonies of the clones transfected with 99-PUR-RPS-pBlaster1 and pcDNA6 plasmids are shown
Figure 5.
Figure 5.
The catalytic domain of ADAR2 is not required for suppression of LINE-1 mobilization A) HeLa cells were co-transfected in triplicate with either the vector pADAR2-V5 or pADAR2 E/A-V5 or pADAR1-V5 or the control empty vector pV5, together with the retrotransposition cassette pYX014. After three days with puromycin selection the total cell extract was prepared and the level of both Firefly luciferase and Renilla luciferase were measured by a luminometer. The ratio Fluc/Rluc was used as readout of the retrotransposition efficiency (Y-axis). The different samples are indicated in the X-axis. The data are calculated as the means ± SD from eight independent experiments and normalized to the control pV5 that is set at 100%. P-values were calculated by two-tailed t test and they are indicated above each histogram (*P < 0.05, **P < 0.01, ***P < 0.001). B) 48 h post-transfection the expression of ADAR2-V5, ADAR2 E/A-V5 and ADAR1-V5 was analysed by WB, using a specific anti-V5 antibody. Beta-Actin expression was used as loading control
Figure 6.
Figure 6.
ADAR2 binds the basal L1 RNP complex. A) Lysates of 293 T cells transfected with either pADAR2-V5 or pV5 empty vector together with pES2TE1 cassette were subjected to IP with anti-V5-tag magnetic beads (IP) followed by WB analysis with anti-V5 and anti-T7 tag antibodies. WB analysis of 10 μg of cell lysate inputs (input) is shown. Total cell lysates were mock-treated or RNase (A+ V1)-treated prior to IP B) Total RNA isolated from a fraction of the immunocomplexes (IP) obtained in A) and total RNA isolated from the co-transfected 293 T cells with pADAR2-V5 or pV5 plasmids together with pES2TE1 cassette (input) were subjected to RT-PCR analysis using specific primers to amplify fragments of the ectopically expressed L1 RNA and actin mRNA
Figure 7.
Figure 7.
ADAR2 co-localizes with ORF1p in the nucleolus A) HeLa cells were co-transfected with the plasmids pADAR2-V5 and pES2TE1, and 48 h post-transfection the subcellular localization of ADAR2-V5 and ORF1p-T7 was analysed by an immunofluorescence assay, using the anti-V5 and anti-T7 specific antibodies and stained with the secondary Alexa Fluor 488-labelled anti-rabbit antibody (Invitrogen) and the secondary Alexa Fluor 555-labelled anti-mouse antibody (Invitrogen) B) Orthogonal Projection of confocal planes of the same cell. Images taken using 60x magnification and scale bars represent 5 μm

References

    1. Chuong EB, Elde NC, Feschotte C.. Regulatory activities of transposable elements: from conflicts to benefits. Nat Rev Genet. 2017;18(2):71–86. - PMC - PubMed
    1. Drongitis D, Aniello F, Fucci L, et al. Roles of Transposable Elements in the Different Layers of Gene Expression Regulation. Int J Mol Sci. 2019;20(22):E5755. - PMC - PubMed
    1. Kazazian HH Jr, Moran JV. Mobile DNA in Health and Disease. N Engl J Med. 2017;377(4):361–370. - PMC - PubMed
    1. Hancks DC, Kazazian HH Jr. Active human retrotransposons: variation and disease. Curr Opin Genet Dev. 2012;22:191–203. - PMC - PubMed
    1. Lander ES, Linton LM, Birren B, et al. International Human Genome Sequencing Consortium, Initial sequencing and analysis of the human genome. Nature. 2001;409:860–921. - PubMed

Publication types