

Tumor-Infiltrating B Lymphocyte Profiling Identifies IgG-Biased, Clonally Expanded Prognostic Phenotypes in Triple-Negative Breast Cancer
- PMID: 34224371
- PMCID: PMC7611538
- DOI: 10.1158/0008-5472.CAN-20-3773
Tumor-Infiltrating B Lymphocyte Profiling Identifies IgG-Biased, Clonally Expanded Prognostic Phenotypes in Triple-Negative Breast Cancer
Abstract
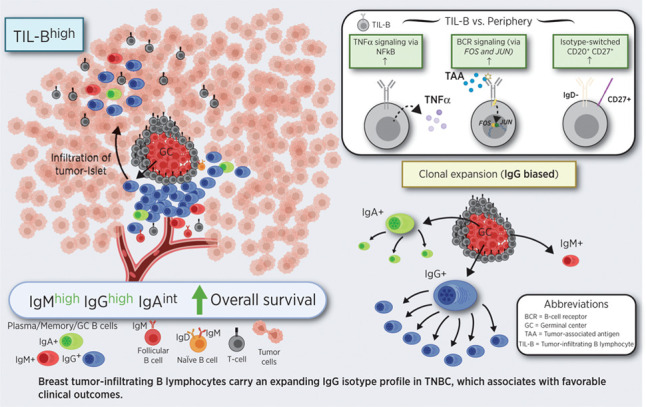
In breast cancer, humoral immune responses may contribute to clinical outcomes, especially in more immunogenic subtypes. Here, we investigated B lymphocyte subsets, immunoglobulin expression, and clonal features in breast tumors, focusing on aggressive triple-negative breast cancers (TNBC). In samples from patients with TNBC and healthy volunteers, circulating and tumor-infiltrating B lymphocytes (TIL-B) were evaluated. CD20+CD27+IgD- isotype-switched B lymphocytes were increased in tumors, compared with matched blood. TIL-B frequently formed stromal clusters with T lymphocytes and engaged in bidirectional functional cross-talk, consistent with gene signatures associated with lymphoid assembly, costimulation, cytokine-cytokine receptor interactions, cytotoxic T-cell activation, and T-cell-dependent B-cell activation. TIL-B-upregulated B-cell receptor (BCR) pathway molecules FOS and JUN, germinal center chemokine regulator RGS1, activation marker CD69, and TNFα signal transduction via NFκB, suggesting BCR-immune complex formation. Expression of genes associated with B lymphocyte recruitment and lymphoid assembly, including CXCL13, CXCR4, and DC-LAMP, was elevated in TNBC compared with other subtypes and normal breast. TIL-B-rich tumors showed expansion of IgG but not IgA isotypes, and IgG isotype switching positively associated with survival outcomes in TNBC. Clonal expansion was biased toward IgG, showing expansive clonal families with specific variable region gene combinations and narrow repertoires. Stronger positive selection pressure was present in the complementarity determining regions of IgG compared with their clonally related IgA in tumor samples. Overall, class-switched B lymphocyte lineage traits were conspicuous in TNBC, associated with improved clinical outcomes, and conferred IgG-biased, clonally expanded, and likely antigen-driven humoral responses. SIGNIFICANCE: Tumor-infiltrating B lymphocytes assemble in clusters, undergoing B-cell receptor-driven activation, proliferation, and isotype switching. Clonally expanded, IgG isotype-biased humoral immunity associates with favorable prognosis primarily in triple-negative breast cancers.
©2021 The Authors; Published by the American Association for Cancer Research.
Figures
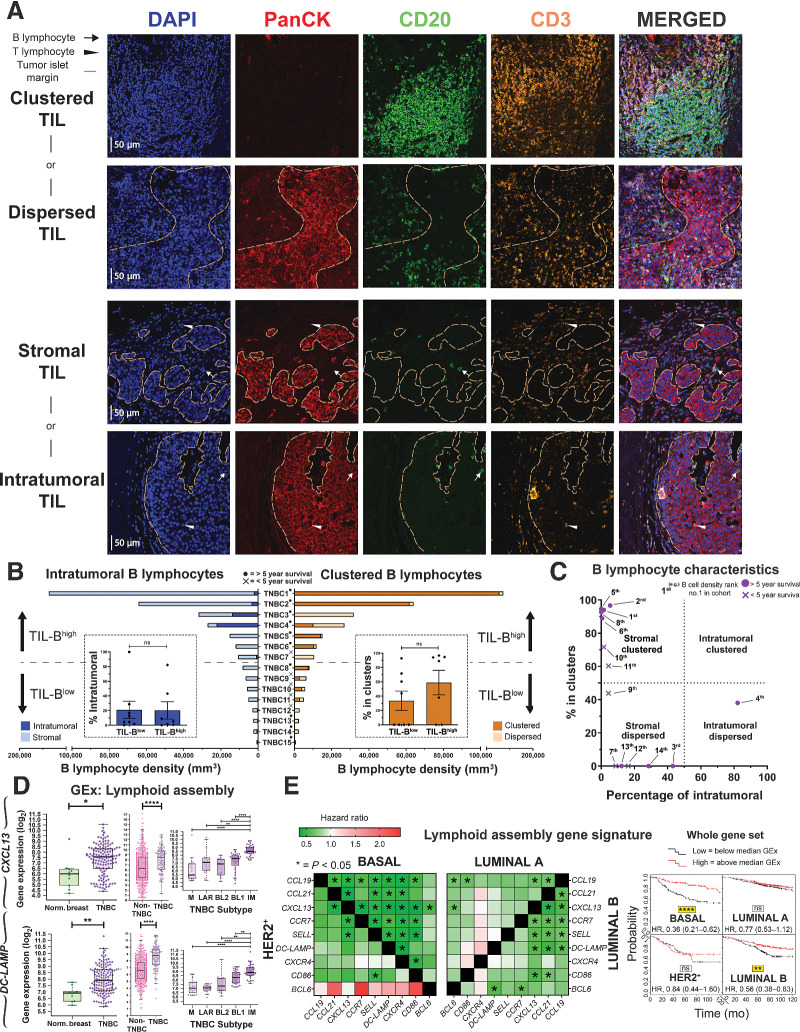
![Figure 2. B lymphocyte infiltration and its positive prognostic value in TNBC. A, TIL-B quantification by IHC within normal breasts and TNBC (N = 15 each, Bart's IHC cohort), and by GEx (normal breast) vs. TNBC (N = 10 vs. 131, KCL GEx cohort); non-TNBC vs. TNBC (N = 515 vs. 123, TCGA GEx cohort); TNBC subtypes [mesenchymal (M), luminal androgen receptor (LAR), basal-like 1 and 2 (BL1 and 2), and immunomodulatory (IM; N = 122, KCL GEx cohort]. The Mann–Whitney test was used for statistical significance. B, TNBC TIL-B correlation with TIL-T by IHC (r = 0.72, Bart's IHC cohort) and by GEx (r = 0.73, KCL GEx cohort). Linear regression analysis was used to calculate correlation coefficients (r) and P values. C, B lymphocyte metagene NanoString GEx data comparing B lymphocytes in primary tumors with metastatic sites (N = 31 vs. 17; NanoString cohort). D, High (above median) TIL-B densities by IHC were associated with better overall survival in TNBC (N = 15; Bart's IHC cohort), and in the basal-like subtype by high CD20 GEx (N = 241; KM plotter cohort; log rank test used to assess statistical significance). E, Kaplan–Meier survival curves display DMFS for naïve B cells, plasma cells, and memory B cells in TNBC (KCL GEx cohort) using CIBERSORT (20). Data were divided into four groups based on B lymphocyte subset and TIL levels stratified by semiquantitative TIL classification. Statistical significance was assessed using univariate Cox proportional hazards regression models. F, Representative IHC/IF images (Bart's IHC cohort) depicting nucleated cells (DAPI), epithelial cells (PanCK), B lymphocytes (CD20), and T lymphocytes (CD3) within TNBC TIL-Blow and TIL-Bhigh lesions. Scale bar, 50 μm. G, Representative TNBC (TIL-Bhigh) images highlighting numerous lymphoid aggregates (within white dash lines) consisting of B lymphocytes assembled adjacent to a T lymphocyte zone. Brown dash lines indicate carcinoma edge. Scale bar, 2 mm. *, P < 0.05; **, P < 0.01; ***, P < 0.001; ****, P < 0.0001.](https://cdn.ncbi.nlm.nih.gov/pmc/blobs/a589/9398116/79435c19899c/4290fig2.jpg)
![Figure 4. scRNA-seq analysis reveals BCR-driven TIL-B activatory signatures, and B lymphocyte functional trait gene markers predict positive survival outcome. A, UMAP visualization according to global GEx of single B lymphocytes pooled from the peripheral blood (1,476 cells) and tumors (1,021 cells) of eight patients (single-cell cohort), colored by relative normalized gene expression levels for CD20 and CD27. B, The detection of differentially expressed genes [DEG; on cells originally annotated by Azizi and colleagues (22) as B cells] demonstrates elevated expression of FOS, JUN, RGS1, and CD69, indicated by fold change (FC; determined using Wilcoxon rank sum test). C, Gene set enrichment analysis of TIL-B relative to circulating B lymphocytes using hallmark gene sets. Red, positive normalized enrichment scores (hallmark expression enhanced in TIL-B). D, Survival analysis in KM Plotter of determined ER−HER2−/basal surrogate, HER2+, luminal A, and luminal B subtype KM plotter surrogate subgroups (KM plotter cohort; ref. 19) for expression of gene signatures positively regulating key B lymphocyte properties (activation, proliferation, and differentiation). Representative genes listed for B lymphocyte proliferation (44 total in set). Signatures from all three functions carry positive prognostic value in the basal-like cancer subtype. Individual genes were evaluated in combination with each other gene (left) and gene set as a whole (right). E, CellPhoneDB (25) was applied to analyze B-cell–T-cell interactions (single-cell cohort). After FDR (FDR < 0.001) correction, communication pathways identified included lymphoid assembly, cytokine signaling, costimulation, T-cell–dependent B-cell activation, and cytotoxic T lymphocyte (CTL) activation. Circle sizes indicate P value, whereas color-coding represents the average expression level of interacting molecule 1 in cluster 1 and interacting molecule 2 in cluster 2. ****, P < 0.0001.](https://cdn.ncbi.nlm.nih.gov/pmc/blobs/a589/9398116/9d36b38b731e/4290fig4.jpg)
References
-
- Lehmann BD, Pietenpol JA, Tan AR. Triple-negative breast cancer: molecular subtypes and new targets for therapy. Am Soc Clin Oncol Educ Book 2015:e31–9. DOI: 10.14694/EdBook_AM.2015.35.e31. - PubMed
-
- Loi S, Michiels S, Salgado R, Sirtaine N, Jose V, Fumagalli D, et al. . Tumor infiltrating lymphocytes are prognostic in triple negative breast cancer and predictive for trastuzumab benefit in early breast cancer: results from the FinHER trial. Ann Oncol 2014;25:1544–50. - PubMed
Publication types
MeSH terms
Substances
Grants and funding
- BREAST CANCER NOW KCL RESEARCH UNIT/BBC_/Breast Cancer Now/United Kingdom
- MR/L01257X/2/MRC_/Medical Research Council/United Kingdom
- 28990/CRUK_/Cancer Research UK/United Kingdom
- MC_PC_19041/MRC_/Medical Research Council/United Kingdom
- A22788/CRUK_/Cancer Research UK/United Kingdom
- MR/L01257X/1/MRC_/Medical Research Council/United Kingdom
- BB/H018409/1/BB_/Biotechnology and Biological Sciences Research Council/United Kingdom
- G0600097/MRC_/Medical Research Council/United Kingdom
- 24869/CRUK_/Cancer Research UK/United Kingdom
- MR/L023091/1/MRC_/Medical Research Council/United Kingdom
- NH/12/2/29427/BHF_/British Heart Foundation/United Kingdom
- A15774/CRUK_/Cancer Research UK/United Kingdom
- A11527/CRUK_/Cancer Research UK/United Kingdom
- A11060/CRUK_/Cancer Research UK/United Kingdom
LinkOut - more resources
Full Text Sources
Other Literature Sources
Research Materials
Miscellaneous
