

The Prevalence of Cognitive Impairment Is Not Increasing in the United States: A Critique of Hale et al. (2020)
- PMID: 34224475
- PMCID: PMC8338740
- DOI: 10.1097/EDE.0000000000001382
The Prevalence of Cognitive Impairment Is Not Increasing in the United States: A Critique of Hale et al. (2020)
Abstract
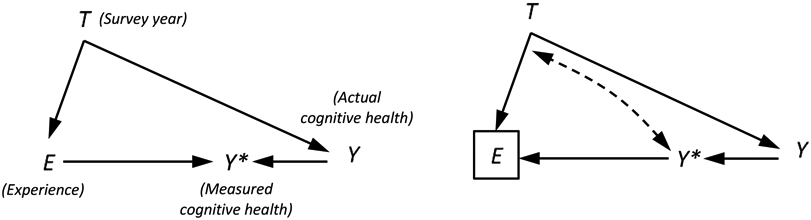
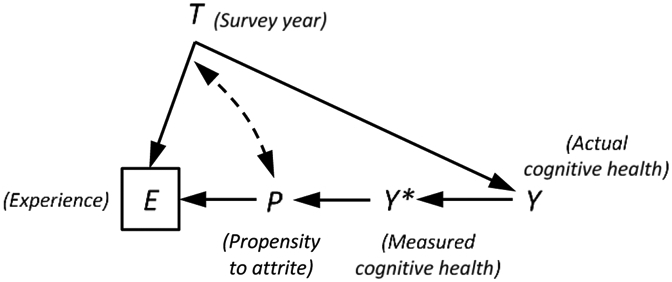
Previous research based on the longitudinal Health and Retirement Study (HRS) has argued that the prevalence of cognitive impairment has declined in recent years in the United States. A recent article published in Epidemiology by Hale et al., however, suggests this finding is biased by unmeasured panel conditioning (improvement in cognitive scores resulting from repeat assessment). After adjusting for test number, Hale and colleagues found that the prevalence of cognitive impairment had actually increased between 1996 and 2014. In this commentary, we argue that simply adjusting for test number is not an appropriate way to handle panel conditioning in this instance because it fails to account for selective attrition (the tendency for cognitively high-functioning respondents to remain in the sample for a longer time). We reanalyze HRS data using models that simultaneously adjust for panel conditioning and selective attrition. Contrary to Hale et al., we find that the prevalence of cognitive impairment has indeed declined in the United States in recent decades.
Conflict of interest statement
The authors report no conflicts of interest.
Figures
Comment in
-
Rejoinder to "The Prevalence of Cognitive Impairment Is Not Increasing in the United States: A Critique of Hale et al. (2020)".Epidemiology. 2021 Sep 1;32(5):717-720. doi: 10.1097/EDE.0000000000001383. Epidemiology. 2021. PMID: 34224473 Free PMC article.
Comment on
-
Trends in the Risk of Cognitive Impairment in the United States, 1996-2014.Epidemiology. 2020 Sep;31(5):745-754. doi: 10.1097/EDE.0000000000001219. Epidemiology. 2020. PMID: 32740472 Free PMC article.
References
-
- Wu YT, Beiser AS, Breteler MB, et al. The changing prevalence and incidence of dementia over time – current evidence. Nat Rev Neurol. 2017;13(6):327–379. - PubMed
-
- Calamia M, Markon K, Tranel D. Scoring higher the second time around: meta-analyses of pracitce effects in neuropsychological assessment. Clin Neuropsychol. 2012;26(4):543–570. - PubMed
Publication types
MeSH terms
Grants and funding
LinkOut - more resources
Full Text Sources
