

Trends in Nationally Notifiable Sexually Transmitted Disease Case Reports During the US COVID-19 Pandemic, January to December 2020
- PMID: 34224523
- PMCID: PMC8459909
- DOI: 10.1097/OLQ.0000000000001506
Trends in Nationally Notifiable Sexually Transmitted Disease Case Reports During the US COVID-19 Pandemic, January to December 2020
Abstract
Background: To describe changes in reported sexually transmitted diseases (STDs) during the US coronavirus disease 2019 pandemic, we compared the weekly number of reported nationally notifiable STDs in 2020 to 2019.
Methods: We reviewed cases of chlamydia, gonorrhea, and primary and secondary (P&S) syphilis reported to the US National Notifiable Disease Surveillance System in 2020. For each STD, we compare the number of 2020 cases reported for a given Morbidity and Mortality Weekly Report (MMWR) week to the number of 2019 cases reported in the same week, expressing 2020 cases as a percentage of 2019 cases. We also calculated the percent difference between 2020 and 2019 cumulative case totals as of MMWR week 50 (week of December 9).
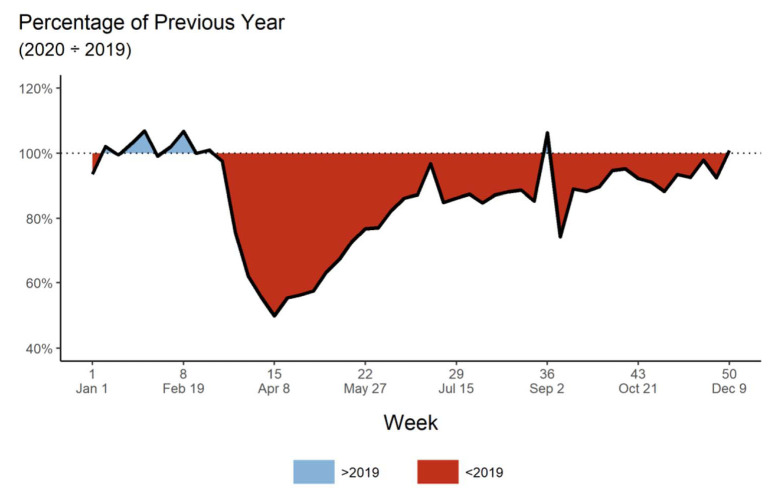
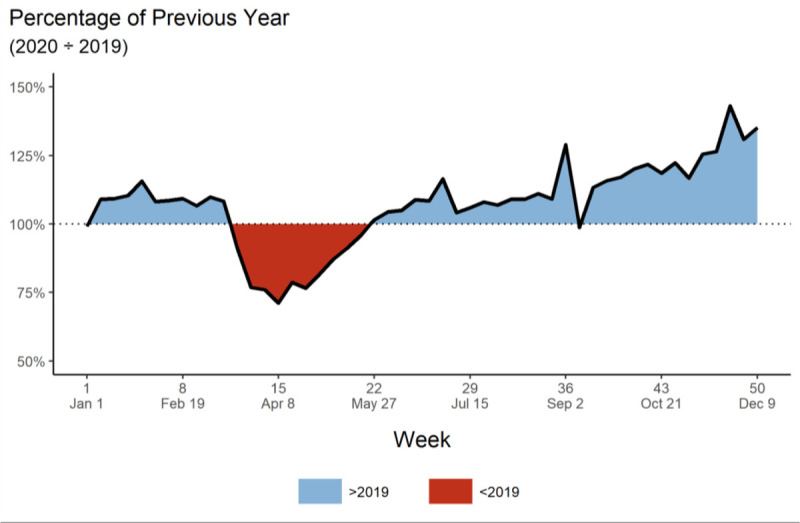
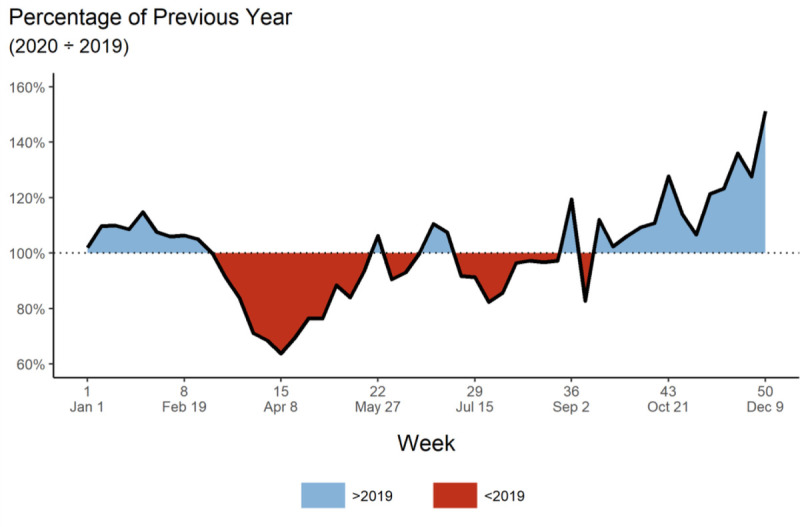
Results: During MMWR weeks 1 to 11 (week of December 29, 2019-March 11, 2020), the weekly number of cases of STDs reported in 2020 as a percentage of the cases in the same week in 2019 was similar. However, 2020 numbers were much lower than 2019 numbers in week 15 (week of April 8; chlamydia, 49.8%; gonorrhea, 71.2%; and P&S syphilis, 63.7%). As of week 50, the 2020 cumulative totals compared with 2019 were 14.0% lower for chlamydia, 7.1% higher for gonorrhea, and 0.9% lower for P&S syphilis.
Conclusions: During March-April 2020, national case reporting for STDs dramatically decreased compared with 2019. However, resurgence in reported gonorrhea and syphilis cases later in the year suggests STD reporting may have increased in 2020, underscoring the importance of continued STD prevention and care activities.
Copyright © 2021 American Sexually Transmitted Diseases Association. All rights reserved.
Conflict of interest statement
Conflict of Interest and Sources of Funding: None declared.
Figures
References
-
- Centers for Disease Control and Prevention . Sexually Transmitted Disease Surveillance 2018. 2019. Available at: https://www.cdc.gov/std/stats18/default.htm. Accessed January 3, 2021.
-
- Czeisler M Tynan MA Howard ME, et al. Public attitudes, behaviors, and beliefs related to COVID-19, stay-at-home orders, nonessential business closures, and public health guidance—United States, New York City, and Los Angeles, May 5–12, 2020. MMWR Morb Mortal Wkly Rep 2020; 69:751–758. - PMC - PubMed
-
- Centers for Disease Control and Prevention . Guidance for Businesses and Employers Responding to Coronavirus Disease 2019 (COVID-19). 2021. Available at: https://www.cdc.gov/coronavirus/2019-ncov/community/guidance-business-re.... Accessed January 3, 2021.
MeSH terms
LinkOut - more resources
Full Text Sources
Other Literature Sources
Medical
Research Materials
Miscellaneous
