. 2021 Jul:69:103463.
doi: 10.1016/j.ebiom.2021.103463. Epub 2021 Jul 3.

Tempo-spatial regulation of the Wnt pathway by FAM13A modulates the stemness of alveolar epithelial progenitors

Affiliations

Tempo-spatial regulation of the Wnt pathway by FAM13A modulates the stemness of alveolar epithelial progenitors

Xin Lin et al. EBioMedicine. 2021 Jul.

Abstract

Background: Family with Sequence Similarity 13, Member A (FAM13A) gene has been consistently associated with COPD by Genome-wide association studies (GWAS). Our previous study demonstrated that FAM13A was mainly expressed in the lung epithelial progenitors including Club cells and alveolar type II epithelial (ATII) cells. Fam13a-/- mice were resistant to cigarette smoke (CS)-induced emphysema through promoting β-catenin/Wnt activation. Given the important roles of β-catenin/Wnt activation in alveolar regeneration during injury, it is unclear when and where FAM13A regulates the Wnt pathway, the requisite pathway for alveolar epithelial repair, in vivo during CS exposure in lung epithelial progenitors.

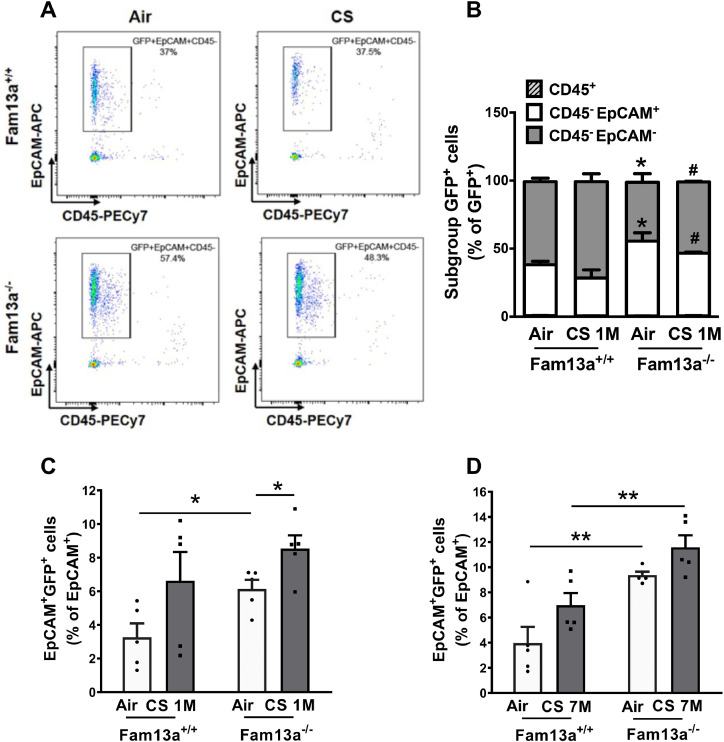
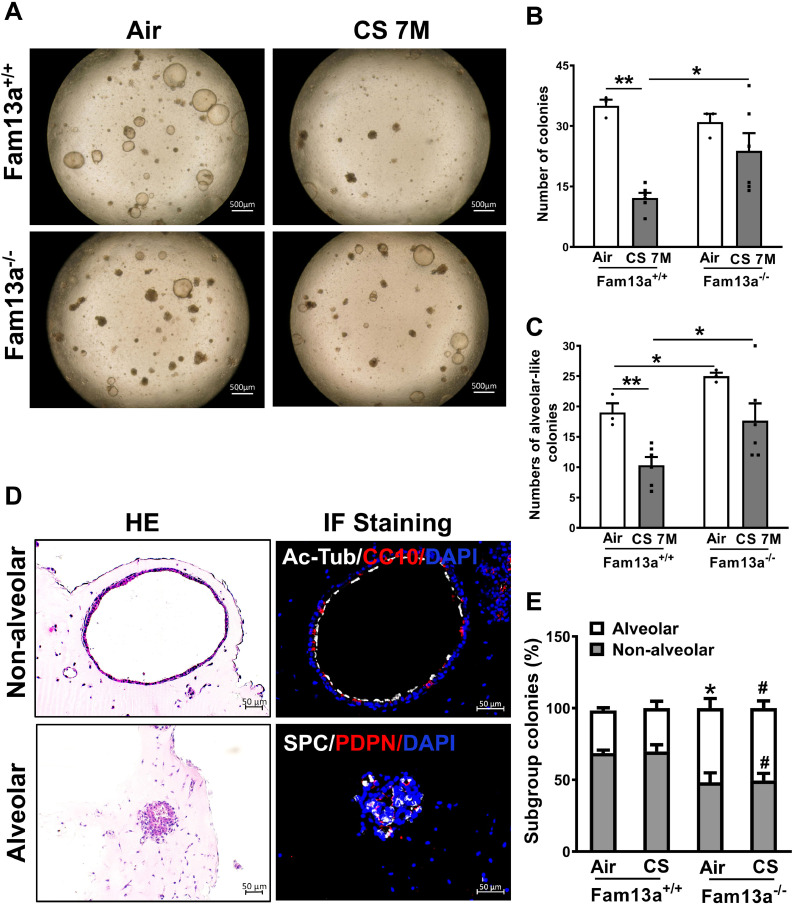
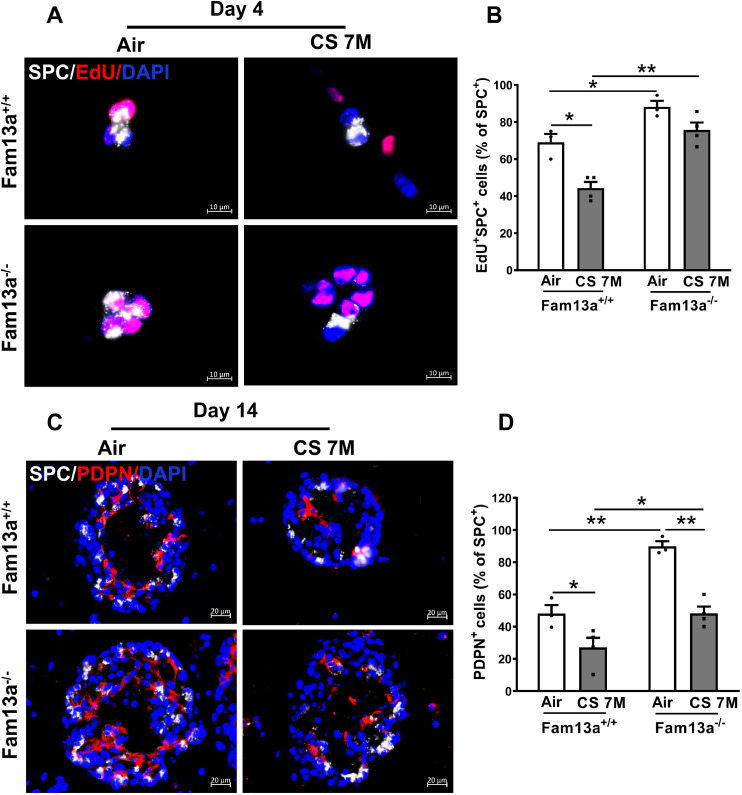
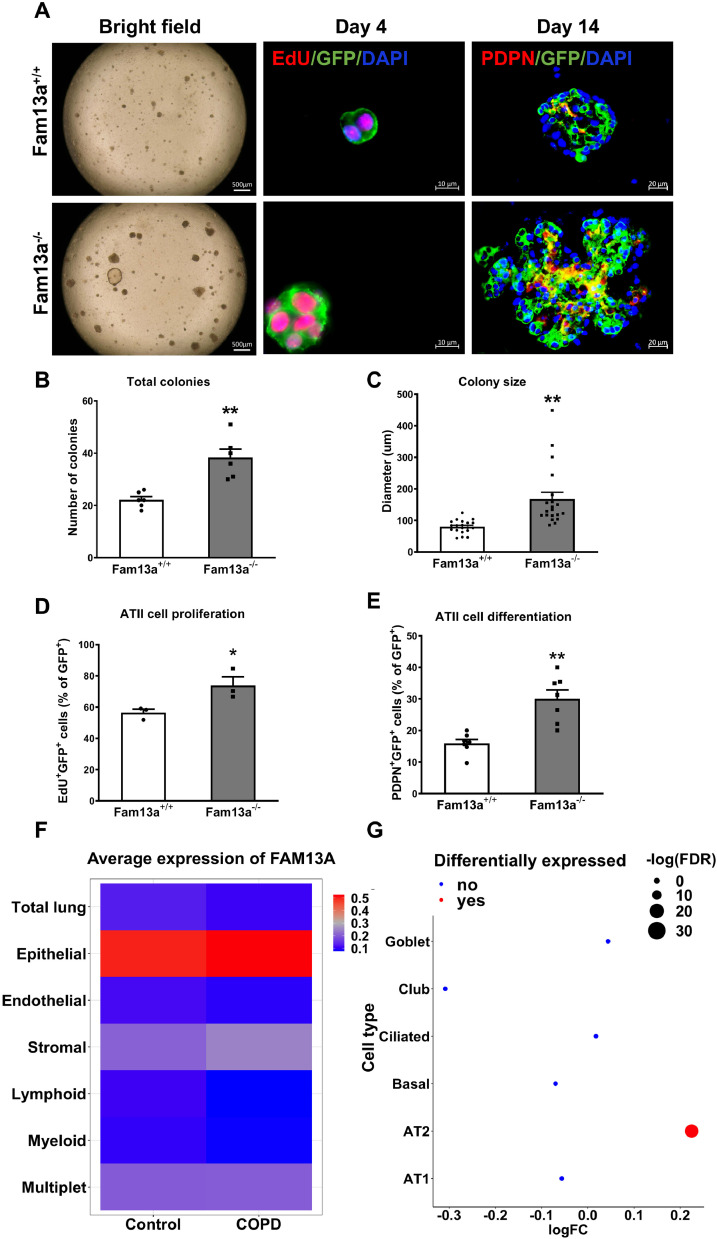
Methods: Fam13a+/+ or Fam13a-/- mice were crossed with TCF/Lef:H2B-GFP Wnt-signaling reporter mouse line to indicate β-catenin/Wnt-activated cells labeled with GFP followed by acute (1 month) or chronic (7 months) CS exposure. Fluorescence-activated flow cytometry analysis, immunofluorescence and organoid culture system were performed to identify the β-catenin/Wnt-activated cells in Fam13a+/+ or Fam13a-/- mice exposed to CS. Fam13a;SftpcCreERT2;Rosa26RmTmG mouse line, where GFP labels ATII cells, was generated for alveolar organoid culture followed by analyses of organoid number, immunofluorescence and gene expression. Single cell RNA-seq data from COPD ever smokers and nonsmoker control lungs were further analyzed.

Findings: We found that FAM13A-deficiency significantly increased Wnt activation mainly in lung epithelial cells. Consistently, after long-term CS exposure in vivo, FAM13A deficiency bestows alveolar epithelial progenitor cells with enhanced proliferation and differentiation in the ex vivo organoid model. Importantly, expression of FAM13A is significantly increased in human COPD-derived ATII cells compared to healthy ATII cells as suggested by single cell RNA-sequencing data.

Interpretation: Our findings suggest that FAM13A-deficiency promotes the Wnt pathway-mediated ATII cell repair/regeneration, and thereby possibly mitigating CS-induced alveolar destruction. FUND: This project is funded by the National Institutes of Health of United States of America (NIH) grants R01HL127200, R01HL137927, R01HL148667 and R01HL147148 (XZ).

Keywords: COPD/emphysema; Cigarette smoke; Epithelial organoids; FAM13A; Repair/regeneration; β-catenin/Wnt pathway.


Conflict of interest statement

Declaration of Competing Interest The authors have declared that no conflict of interest exists.

Figures

Fig 1
Fig. 1
The β-catenin/Wnt signaling is activated in GFP+ cells from Fam13a-TCF/Lef:H2B-GFP Wnt reporter line. A. Experimental scheme of the Fam13a-TCF/Lef:H2B-GFP Wnt reporter line exposed to short-term (1 month) and long-term (7 months) Cigarette Smoke (CS). Expression of Axin2 in CS-exposed Fam13a+/+ mice (B) and CS-exposed Fam13a−/− mice (C) was measured in FACS-sorted GFP+ cells from Fam13a-TCF/Lef:H2B-GFP mouse line by qPCR. Data are expressed as Mean ± SEM. n = 3-4 mice/group. **p < 0.01 by unpaired t test. D. Representative images of immunofluorescence staining showing GFP+ cells co-expressing active β-catenin in lung sections from CS-exposed Fam13a−/− TCF/Lef:H2B-GFP mouse line. Cell stained with GFP (green) and active β-catenin (red) antibodies and nuclei labeled with DAPI (blue) in lung sections. White arrows indicate GFP+ cells expressing active β-catenin.
Fig 2
Fig. 2
β-catenin/Wnt signaling is activated in murine lungs after CS exposure for 1 and 7 months. A. Representative flow cytometry analysis showing GFP+ cell population in Fam13a+/+ and Fam13a−/− murine lungs with or without exposure to CS for 1 month. GFP+ cells in murine lungs were quantified by flow cytometry in mice exposed to CS for 1 (B) and 7 months (C). Data are expressed as Mean ± SEM. n = 5-6 mice/group. *p < 0.05 or **p < 0.01 by unpaired t test. D. Representative immunofluorescence staining showing expression of GFP in murine lungs at high and low magnifications. Cell stained with GFP (green) antibodies and nuclei labeled with DAPI (blue) in lung sections from Fam13a-TCF/Lef:H2B-GFP mice. White arrows indicate GFP+ cells. CS, cigarette smoke; M, month or months.
Fig 3
Fig. 3
FACS analysis showing activated β-catenin/Wnt signaling enriched in lung epithelial cells of Fam13a−/− mice. A. Representative profile of flow cytometry analysis showing gating of GFP+ cells indicated from Fig. 2A co-expressing EpCAM+ in CD45 population in Fam13a+/+ and Fam13a−/− murine lungs with or without exposure to CS for 1 month. B. Distribution of GFP+ cells in different cell subgroups (epithelial cells: CD45EpCAM+, immune cells: CD45+, and non-immune/non-epithelial cells: CD45EpCAM cells) in murine lungs from Fam13a+/+ and Fam13a−/− mice after exposure to CS for 1 month. *p < 0.05 vs air-exposed Fam13a+/+ mice and #p < 0.05 vs CS-exposed Fam13a+/+ mice by unpaired t test. Data are expressed as Mean ± SEM from 5-6 mice/group. Quantification of GFP+ EpCAM+ cell populations in lung epithelial cells from Fam13a+/+ and Fam13a−/− mice after exposure to CS for 1 (C) or 7 months (D). Mean ± SEM are from 5-6 mice/group. *p < 0.05 or **p < 0.01 by unpaired t test. CS, cigarette smoke; M, month or months.
Fig 4
Fig. 4
β-catenin/Wnt signaling is activated in both Club cells and ATII cells of Fam13a−/− mice. A. Representative immunofluorescence images showing location of GFP+ cells in murine lungs: GFP (green); CC10 (red) for Club cells; SPC (red) for ATII cells; and DAPI (blue) in lung tissue sections. Yellow arrows indicate GFP+ cells expressing CC10. White arrows indicate GFP+ cells expressing SPC. B. Representative images showing GFP+ cells co-expressing CC10 or SPC at high magnification. Yellow arrows indicate GFP+ cells expressing CC10. White arrows indicate GFP+ cells expressing SPC. C. Quantification of the mean percentage of GFP+ cells that express CC10 is shown after exposure to CS for 7 months. *p < 0.05 or **p < 0.01 by unpaired t test and significant interaction effects between genotype and CS exposure using two-way ANOVA. D. Quantification of percentage of GFP+ cells that express SPC after exposure to CS for 7 months. *p < 0.05 by Mann-Whitney test. Means ± SEM represent quantification of signals from whole section per mouse and 5-6 mice per group. CS, cigarette smoke; M, month or months.
Fig 5
Fig. 5
Deficiency of Fam13a leads to increased alveolar organoid formation in EpCAM+ cell organoid culture after in vivo CS exposure for 7 months. A. Representative bright field images of organoids derived from EpCAM+ cells from mice exposed to air or CS for 7 months. Quantification on the total colonies (B) and alveolar-like colonies (C) in the organoids model. Mean ± SEM from triplicate wells of each mouse and two mice per genotype. *p < 0.05 or **p < 0.01 by Mann-Whitney test (B) or unpaired t test (C). D. Representative images of organoids from EpCAM+ lung epithelial cells. Histology (left) and immunofluorescence staining (right) for Ac-Tub (white) co-stained with CC10 (red), or SPC (white) co-stained with PDPN (red). Cell nuclei were counterstained with DAPI (blue). E. Quantification of each type of organoid colonies is shown from EpCAM+ cells from mice exposed to air or CS for 7 months. Mean ± SEM from three sections of each mouse and two mice per genotype *p < 0.05 or **p < 0.01 by unpaired t test. CS, cigarette smoke; M, months.
Fig 6
Fig. 6
Deficiency of Fam13a promotes alveolar epithelial cell proliferation and differentiation in the organoid model. A. Representative images of immunofluorescence (IF) staining for proliferating organoids cultured for 4 days. Lung EpCAM+ cells were isolated from Fam13a+/+ or Fam13a−/− mice exposed to in vivo CS for 7 months. ATII cell marker SPC (white) was co-stained with EdU (red) and counterstained with DAPI (blue) for nuclei. B. Quantification of the proliferating ATII cells (EdU+SPC+/ SPC+) in A. Mean ± SEM from ~100 cells per section, three sections of each mouse and two mice per genotype. C. Representative images of differentiating organoids derived from EpCAM+ cells after 14 days of culture. IF images with SPC (white) co-stained with PDPN (red) and nuclei counterstained with DAPI (blue). D. Quantification of the PDPN+ cells in organoids after 14 days of culture. Mean ± SEM from ~200 cells per section, three sections of each mouse and two mice per genotype. *p < 0.05 or **p < 0.01 by unpaired t test. CS, cigarette smoke; M, months.
Fig 7
Fig. 7
Deficiency of FAM13A promotes alveolar organoids formation in the organoid model. A. Representative images of organoids derived from GFP-sorted lineage-labeled ATII cells from Fam13a-SftpcCreERT2;Rosa26RmTmG mice at 4 or 14 days of co-culture. Bright field (left) and immunofluorescence images (right) with GFP (green) co-stained with EdU (red) or GFP (green) co-stained with PDPN (red) antibodies; nuclei are counterstained with DAPI (blue). Quantification showing total colonies (B), colony size (C), proliferation (D) and differentiation (E) of ATII cells. Mean ± SEM shown from ~100 cells per section, three sections of each mouse and two mice per genotype. *p < 0.05 or **p < 0.01 by Mann-Whitney test (B, C and E) or unpaired t test (D). F. Heatmap showing expression levels of FAM13A in multiple cell types in human COPD and control lungs detected by single cell RNA-sequencing (GSE136831). G. Expression of FAM13A is significantly increased in COPD ATII cells compared to control lung ATII cells, in contrast to other lung epithelial cells. Size of the dots indicates the -Log (FDR). FC: fold change indicates the human AT2 cells from COPD vs normal donors.

Similar articles

Cited by

References

    1. Dwyer-Lindgren L, Bertozzi-Villa A, Stubbs RW, Morozoff C, Shirude S, Naghavi M. Trends and Patterns of Differences in Chronic Respiratory Disease Mortality Among US Counties, 1980-2014. Jama. 2017;318(12):1136–1149. - PMC - PubMed
    1. Collaborators GBDCRD. Global, regional, and national deaths, prevalence, disability-adjusted life years, and years lived with disability for chronic obstructive pulmonary disease and asthma, 1990-2015: a systematic analysis for the Global Burden of Disease Study 2015. Lancet Respir Med. 2017;5(9):691–706. - PMC - PubMed
    1. Heron M. Deaths: Leading Causes for 2016. Natl Vital Stat Rep. 2018;67(6):1–77. - PubMed
    1. Kneidinger N, Yildirim AO, Callegari J, Takenaka S, Stein MM, Dumitrascu R. Activation of the WNT/beta-catenin pathway attenuates experimental emphysema. Am J Respir Crit Care Med. 2011;183(6):723–733. - PubMed
    1. Jiang Z, Lao T, Qiu W, Polverino F, Gupta K, Guo F. A Chronic Obstructive Pulmonary Disease Susceptibility Gene, FAM13A, Regulates Protein Stability of beta-Catenin. Am J Respir Crit Care Med. 2016;194(2):185–197. - PMC - PubMed

Substances