

Sex-based clinical and immunological differences in COVID-19
- PMID: 34225644
- PMCID: PMC8256650
- DOI: 10.1186/s12879-021-06313-2
Sex-based clinical and immunological differences in COVID-19
Abstract
Background: Males and females differ in their immunological responses to foreign pathogens. However, most of the current COVID-19 clinical practices and trials do not take the sex factor into consideration.
Methods: We performed a sex-based comparative analysis for the clinical outcomes, peripheral immune cells, and severe acute respiratory syndrome coronavirus (SARS-CoV-2) specific antibody levels of 1558 males and 1499 females COVID-19 patients from a single center. The lymphocyte subgroups were measured by Flow cytometry. The total antibody, Spike protein (S)-, receptor binding domain (RBD)-, and nucleoprotein (N)- specific IgM and IgG levels were measured by chemiluminescence.
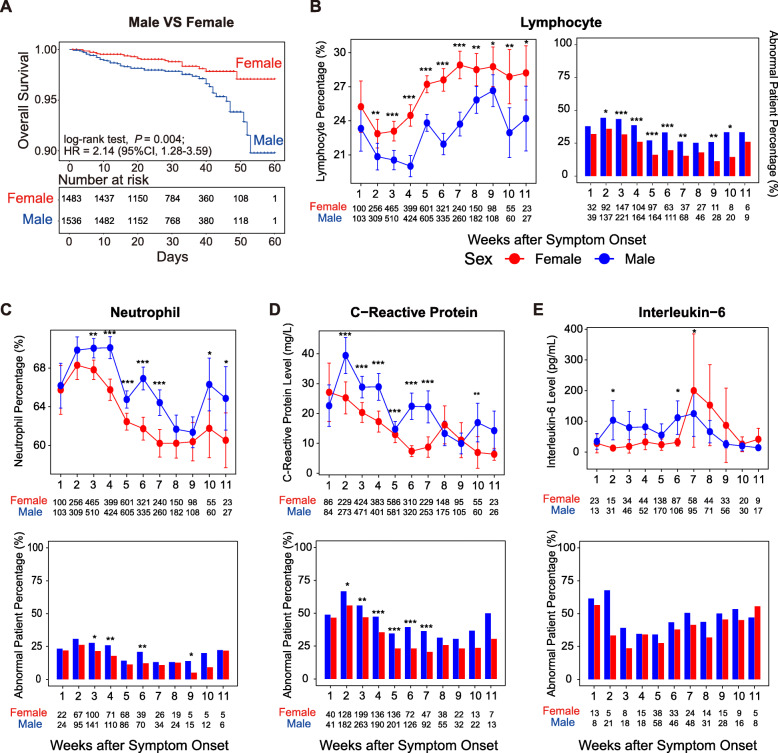
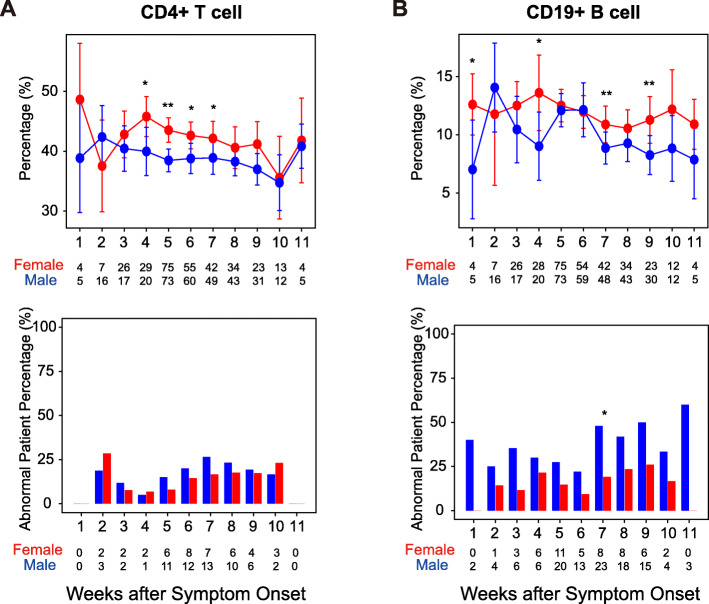
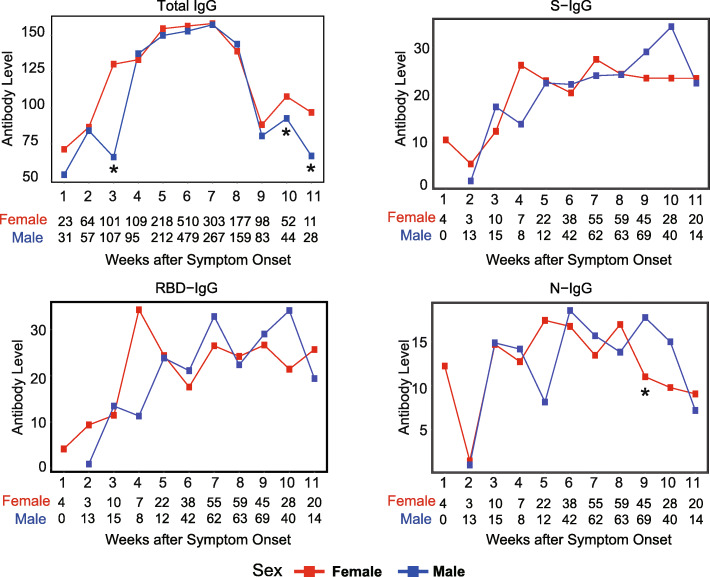
Results: We found that male patients had approximately two-fold rates of ICU admission (4.7% vs. 2.7% in males and females, respectively, P = 0.005) and mortality (3% vs. 1.4%, in males and females, respectively, P = 0.004) than female patients. Survival analysis revealed that the male sex is an independent risk factor for death from COVID-19 (adjusted hazard ratio [HR] = 2.22, 95% confidence interval [CI]: 1.3-3.6, P = 0.003). The level of inflammatory cytokines in peripheral blood was higher in males during hospitalization. The renal (102/1588 [6.5%] vs. 63/1499 [4.2%], in males and females, respectively, P = 0.002) and hepatic abnormality (650/1588 [40.9%] vs. 475/1499 [31.7%], P = 0.003) were more common in male patients than in female patients. By analyzing dynamic changes of lymphocyte subsets after symptom onset, we found that the percentage of CD19+ B cells and CD4+ T cells was generally higher in female patients during the disease course of COVID-19. Notably, the protective RBD-specific IgG against SARS-CoV-2 sharply increased and reached a peak in the fourth week after symptom onset in female patients, while gradually increased and reached a peak in the seventh week after symptom onset in male patients.
Conclusions: Males had an unfavorable prognosis, higher inflammation, a lower percentage of lymphocytes, and indolent antibody responses during SARS-CoV-2 infection and recovery. Early medical intervention and close monitoring are important, especially for male COVID-19 patients.
Keywords: COVID-19; Immunology; Prognosis; SARS-CoV-2; Sex.
Conflict of interest statement
We declare no competing interests.
Figures
References
-
- Grasselli G, Zangrillo A, Zanella A, Antonelli M, Cabrini L, Castelli A, Cereda D, Coluccello A, Foti G, Fumagalli R, Iotti G, Latronico N, Lorini L, Merler S, Natalini G, Piatti A, Ranieri MV, Scandroglio AM, Storti E, Cecconi M, Pesenti A, COVID-19 Lombardy ICU Network. Agosteo E, Alaimo V, Albano G, Albertin A, Alborghetti A, Aldegheri G, Antonini B, Barbara E, Belgiorno N, Belliato M, Benini A, Beretta E, Bianciardi L, Bonazzi S, Borelli M, Boselli E, Bronzini N, Capra C, Carnevale L, Casella G, Castelli G, Catena E, Cattaneo S, Chiumello D, Cirri S, Citerio G, Colombo S, Coppini D, Corona A, Cortellazzi P, Costantini E, Covello RD, de Filippi G, Dei Poli M, Della Mura F, Evasi G, Fernandez-Olmos R, Forastieri Molinari A, Galletti M, Gallioli G, Gemma M, Gnesin P, Grazioli L, Greco S, Gritti P, Grosso P, Guatteri L, Guzzon D, Harizay F, Keim R, Landoni G, Langer T, Lombardo A, Malara A, Malpetti E, Marino F, Marino G, Mazzoni MG, Merli G, Micucci A, Mojoli F, Muttini S, Nailescu A, Panigada M, Perazzo P, Perego GB, Petrucci N, Pezzi A, Protti A, Radrizzani D, Raimondi M, Ranucci M, Rasulo F, Riccio M, Rona R, Roscitano C, Ruggeri P, Sala A, Sala G, Salvi L, Sebastiano P, Severgnini P, Sforzini I, Sigurtà FD, Subert M, Tagliabue P, Troiano C, Valsecchi R, Viola U, Vitale G, Zambon M, Zoia E. Baseline characteristics and outcomes of 1591 patients infected with SARS-CoV-2 admitted to ICUs of the Lombardy region, Italy. JAMA. 2020;323(16):1574–1581. doi: 10.1001/jama.2020.5394. - DOI - PMC - PubMed
-
- Zhu N, Zhang DY, Wang WL, Li XW, Yang B, Song JD, Zhao X, Huang BY, Shi WF, Lu RJ, Niu P, Zhan F, Ma X, Wang D, Xu W, Wu G, Gao GF, Tan W, China Novel Coronavirus Investigating and Research Team A novel coronavirus from patients with pneumonia in China, 2019. N Engl J Med. 2020;382(8):727–733. doi: 10.1056/NEJMoa2001017. - DOI - PMC - PubMed
MeSH terms
Substances
Grants and funding
LinkOut - more resources
Full Text Sources
Medical
Research Materials
Miscellaneous
