. 2021 Jul 5;22(1):197.
doi: 10.1186/s13059-021-02414-y.

Coordinated changes in gene expression kinetics underlie both mouse and human erythroid maturation

Affiliations

Coordinated changes in gene expression kinetics underlie both mouse and human erythroid maturation

Melania Barile et al. Genome Biol. .

Abstract

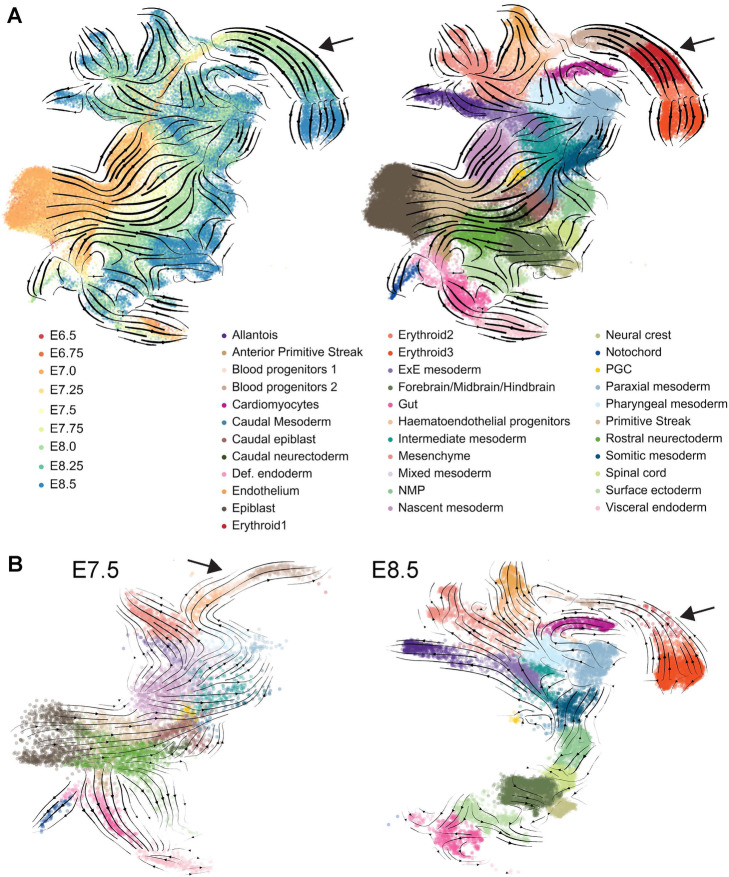
Background: Single-cell technologies are transforming biomedical research, including the recent demonstration that unspliced pre-mRNA present in single-cell RNA-Seq permits prediction of future expression states. Here we apply this RNA velocity concept to an extended timecourse dataset covering mouse gastrulation and early organogenesis.

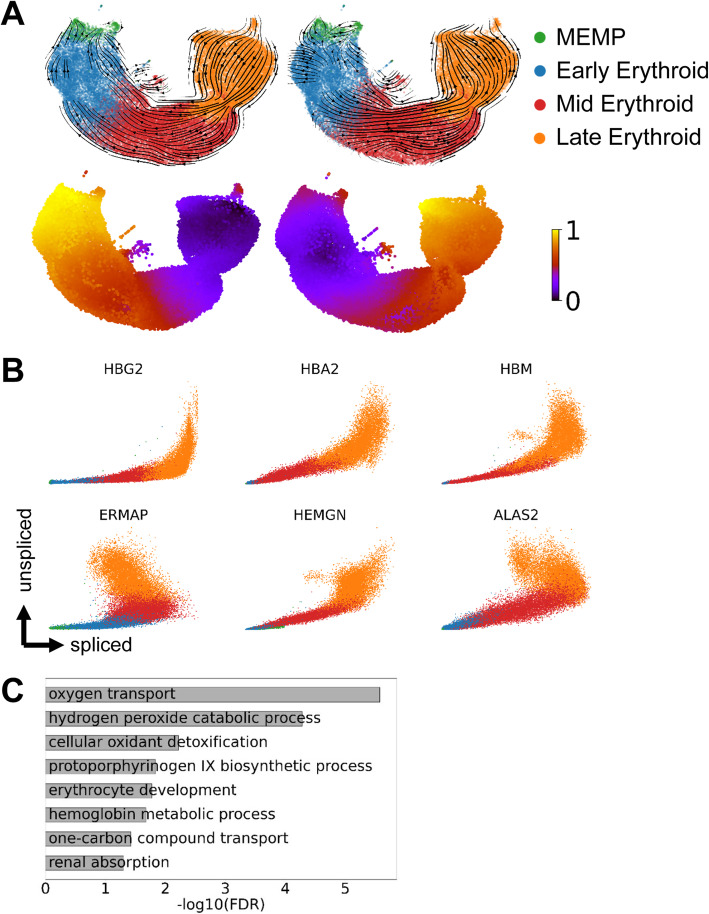
Results: Intriguingly, RNA velocity correctly identifies epiblast cells as the starting point, but several trajectory predictions at later stages are inconsistent with both real-time ordering and existing knowledge. The most striking discrepancy concerns red blood cell maturation, with velocity-inferred trajectories opposing the true differentiation path. Investigating the underlying causes reveals a group of genes with a coordinated step-change in transcription, thus violating the assumptions behind current velocity analysis suites, which do not accommodate time-dependent changes in expression dynamics. Using scRNA-Seq analysis of chimeric mouse embryos lacking the major erythroid regulator Gata1, we show that genes with the step-changes in expression dynamics during erythroid differentiation fail to be upregulated in the mutant cells, thus underscoring the coordination of modulating transcription rate along a differentiation trajectory. In addition to the expected block in erythroid maturation, the Gata1-chimera dataset reveals induction of PU.1 and expansion of megakaryocyte progenitors. Finally, we show that erythropoiesis in human fetal liver is similarly characterized by a coordinated step-change in gene expression.

Conclusions: By identifying a limitation of the current velocity framework coupled with in vivo analysis of mutant cells, we reveal a coordinated step-change in gene expression kinetics during erythropoiesis, with likely implications for many other differentiation processes.

Keywords: Erythropoiesis; Gastrulation; Gata1; RNA velocity.


Conflict of interest statement

The authors declare that they have no competing interests.

Figures

Fig. 1
Fig. 1
Inferring differentiation trajectories at organismal scale. A Pijuan-Sala et al. [25] layout containing single-cell transcriptomes from E6.5 to E8.5, colored by sampled timepoint (left) and by cell-type (right). The overlaying arrows result from applying the scVelo pipeline to the whole embryonic dataset and represent inferred developmental trajectories. Arrowheads highlight the erythroid branch, displaying scVelo trajectory predictions that are inconsistent with real-time sampling. B Pijuan-Sala et al. [25] layout highlighting single-cell transcriptomes belonging to E7.5 (left) and E8.5 (right) and colored by cell-type (see legend in A). The overlaying arrows result from applying the scVelo pipeline to these individual timepoints and represent inferred developmental trajectories. Arrowheads highlight the erythroid branch
Fig. 2
Fig. 2
Unspliced counts contribute to explaining the variability among cell types. A Dimensionality reduction with the first two principal components/MOFA factors using spliced reads alone (left), unspliced reads alone (middle), and both spliced and unspliced (right). Single-cell transcriptomes are colored by cell-type annotation; see Fig. 1 for full legend. B MOFA characterization of spliced and unspliced reads assessing proportion of variance explained (i), overlap in highly variable genes calculating using either spliced or unspliced reads (ii), and factor weight distributions (iii)
Fig. 3
Fig. 3
A set of genes with complex expression kinetics confounds velocity estimation in erythropoiesis. A Illustration of phase plot representation in datasets of differentiating cell populations, and associated scVelo predictions. B Illustration of strategy for MURK gene identification. C Phase plots of representative MURK genes. x-axis: normalized imputed counts of spliced transcript; y-axis: normalized imputed counts of unspliced transcript. D GO-term enrichment of MURK genes identified in mouse yolk sac erythropoiesis. E Zoomed-in UMAP of the erythroid branch (see Fig. 1 for full UMAP) with scVelo calculations, before and after removing MURK genes identified in B. Distinct waves of embryonic erythropoiesis are visible upon MURK gene removal, highlighted with arrowheads
Fig. 4
Fig. 4
In vivo analysis of Gata1 function using a chimaera assay coupled with scRNA-Seq. A Schematic of the G1ER system [29, 30]. B Behavior of the 89 MURK genes identified in Fig. 3 upon Gata1 induction in the G1ER system [28]. Wu et al. report that upon Gata1 induction they obtained a total of 2769 upregulated genes, 6079 mildly upregulated, 3566 downregulated, and 3445 with no response. C UMAPS of Gata1 chimera cells allocated a hemato-endothelial identity colored by cell-type (sub-clusters defined in Pijuan-Sala et al. [25]—BP: blood progenitors, EC: endothelial cells, Haem: hemato-endothelial progenitors, Mk: megakaryocytes, My: myeloid cells, Ery: erythroid cells) and split by genotype. Orange arrowheads highlight increased population with megakaryocytic signature in Gata1 fraction. D UMAPS of Gata1 chimera cells allocated a hemato-endothelial identity colored by sampling timepoint and split by genotype. E Barplots with the quantification of chimera cells mapping to each hemato-endothelial lineage of the reference dataset (left) and to sampled timepoints of the reference dataset (right)
Fig. 5
Fig. 5
Gata1 chimaera assay reveals disruption of MURK genes and perturbed yolk sac hematopoiesis. A Violin plots of representative genes differentially regulated in Gata1 hematopoietic lineages. B GO-term enrichment of genes downregulated in Gata1 Ery1 cells compared to their WT counterparts in chimeras. C Venn diagram showing overlap between MURK genes and genes downregulated in Gata1 Ery1 cells. D Phase plots of MURK genes identified along erythroid differentiation, in E8.5 Gata1 chimera datasets, colored by tdTom status
Fig. 6
Fig. 6
Concept of dual kinetics of gene expression is also revealed in human fetal liver hematopoiesis. A UMAP representation of human fetal liver erythroid cell populations. The overlaying arrows result from applying the scVelo pipeline using all genes (left) or after MURK gene exclusion (right). Bottom UMAPs are colored by corresponding scVelo-inferred latent time. In order to facilitate comparison with the mouse data, a new clustering was performed on the erythroid cells, see “Methods.” MEMP: megakaryocyte-erythroid-mast cell progenitor. B Phase plots of representative MURK genes identified in human fetal liver erythropoiesis single-cell RNA-Seq dataset. C GO-term enrichment of MURK genes identified in human fetal liver erythropoiesis

References

    1. Akunuru S, Geiger H. Aging, clonality, and rejuvenation of hematopoietic stem cells. Trends Mol Med. 2016;22(8):701–712. doi: 10.1016/j.molmed.2016.06.003. - DOI - PMC - PubMed
    1. Schultz MB, Sinclair DA. When stem cells grow old: phenotypes and mechanisms of stem cell aging. Development. 2016;143(1):3–14. doi: 10.1242/dev.130633. - DOI - PMC - PubMed
    1. Mahadevaiah SK, Sangrithi MN, Hirota T, Turner JMA. A single-cell transcriptome atlas of marsupial embryogenesis and X inactivation. Nature. 2020;586(7830):612–617. doi: 10.1038/s41586-020-2629-6. - DOI - PMC - PubMed
    1. Gerber T, Murawala P, Knapp D, Masselink W, Schuez M, Hermann S, et al. Single-cell analysis uncovers convergence of cell identities during axolotl limb regeneration. Science. 2018;362(6413):eaaq0681. - PMC - PubMed
    1. Wagner DE, Weinreb C, Collins ZM, Briggs JA, Megason SG, Klein AM. Single-cell mapping of gene expression landscapes and lineage in the zebrafish embryo. Science. 2018;360(6392):981–987. doi: 10.1126/science.aar4362. - DOI - PMC - PubMed

Publication types

MeSH terms