. 2021 Aug 4;41(31):6699-6713.
doi: 10.1523/JNEUROSCI.2864-20.2021. Epub 2021 Jul 5.

Paraventricular Nucleus Oxytocin Subsystems Promote Active Paternal Behaviors in Mandarin Voles

Affiliations

Paraventricular Nucleus Oxytocin Subsystems Promote Active Paternal Behaviors in Mandarin Voles

Zhixiong He et al. J Neurosci. .

Abstract

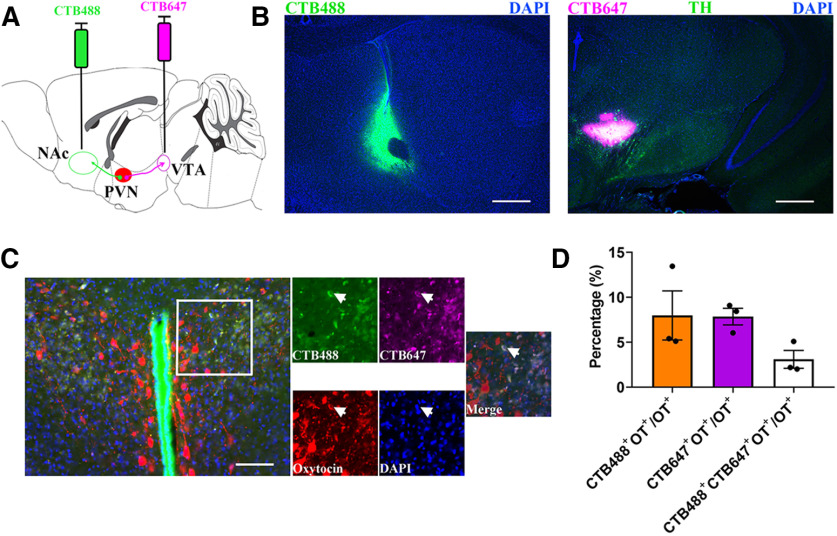
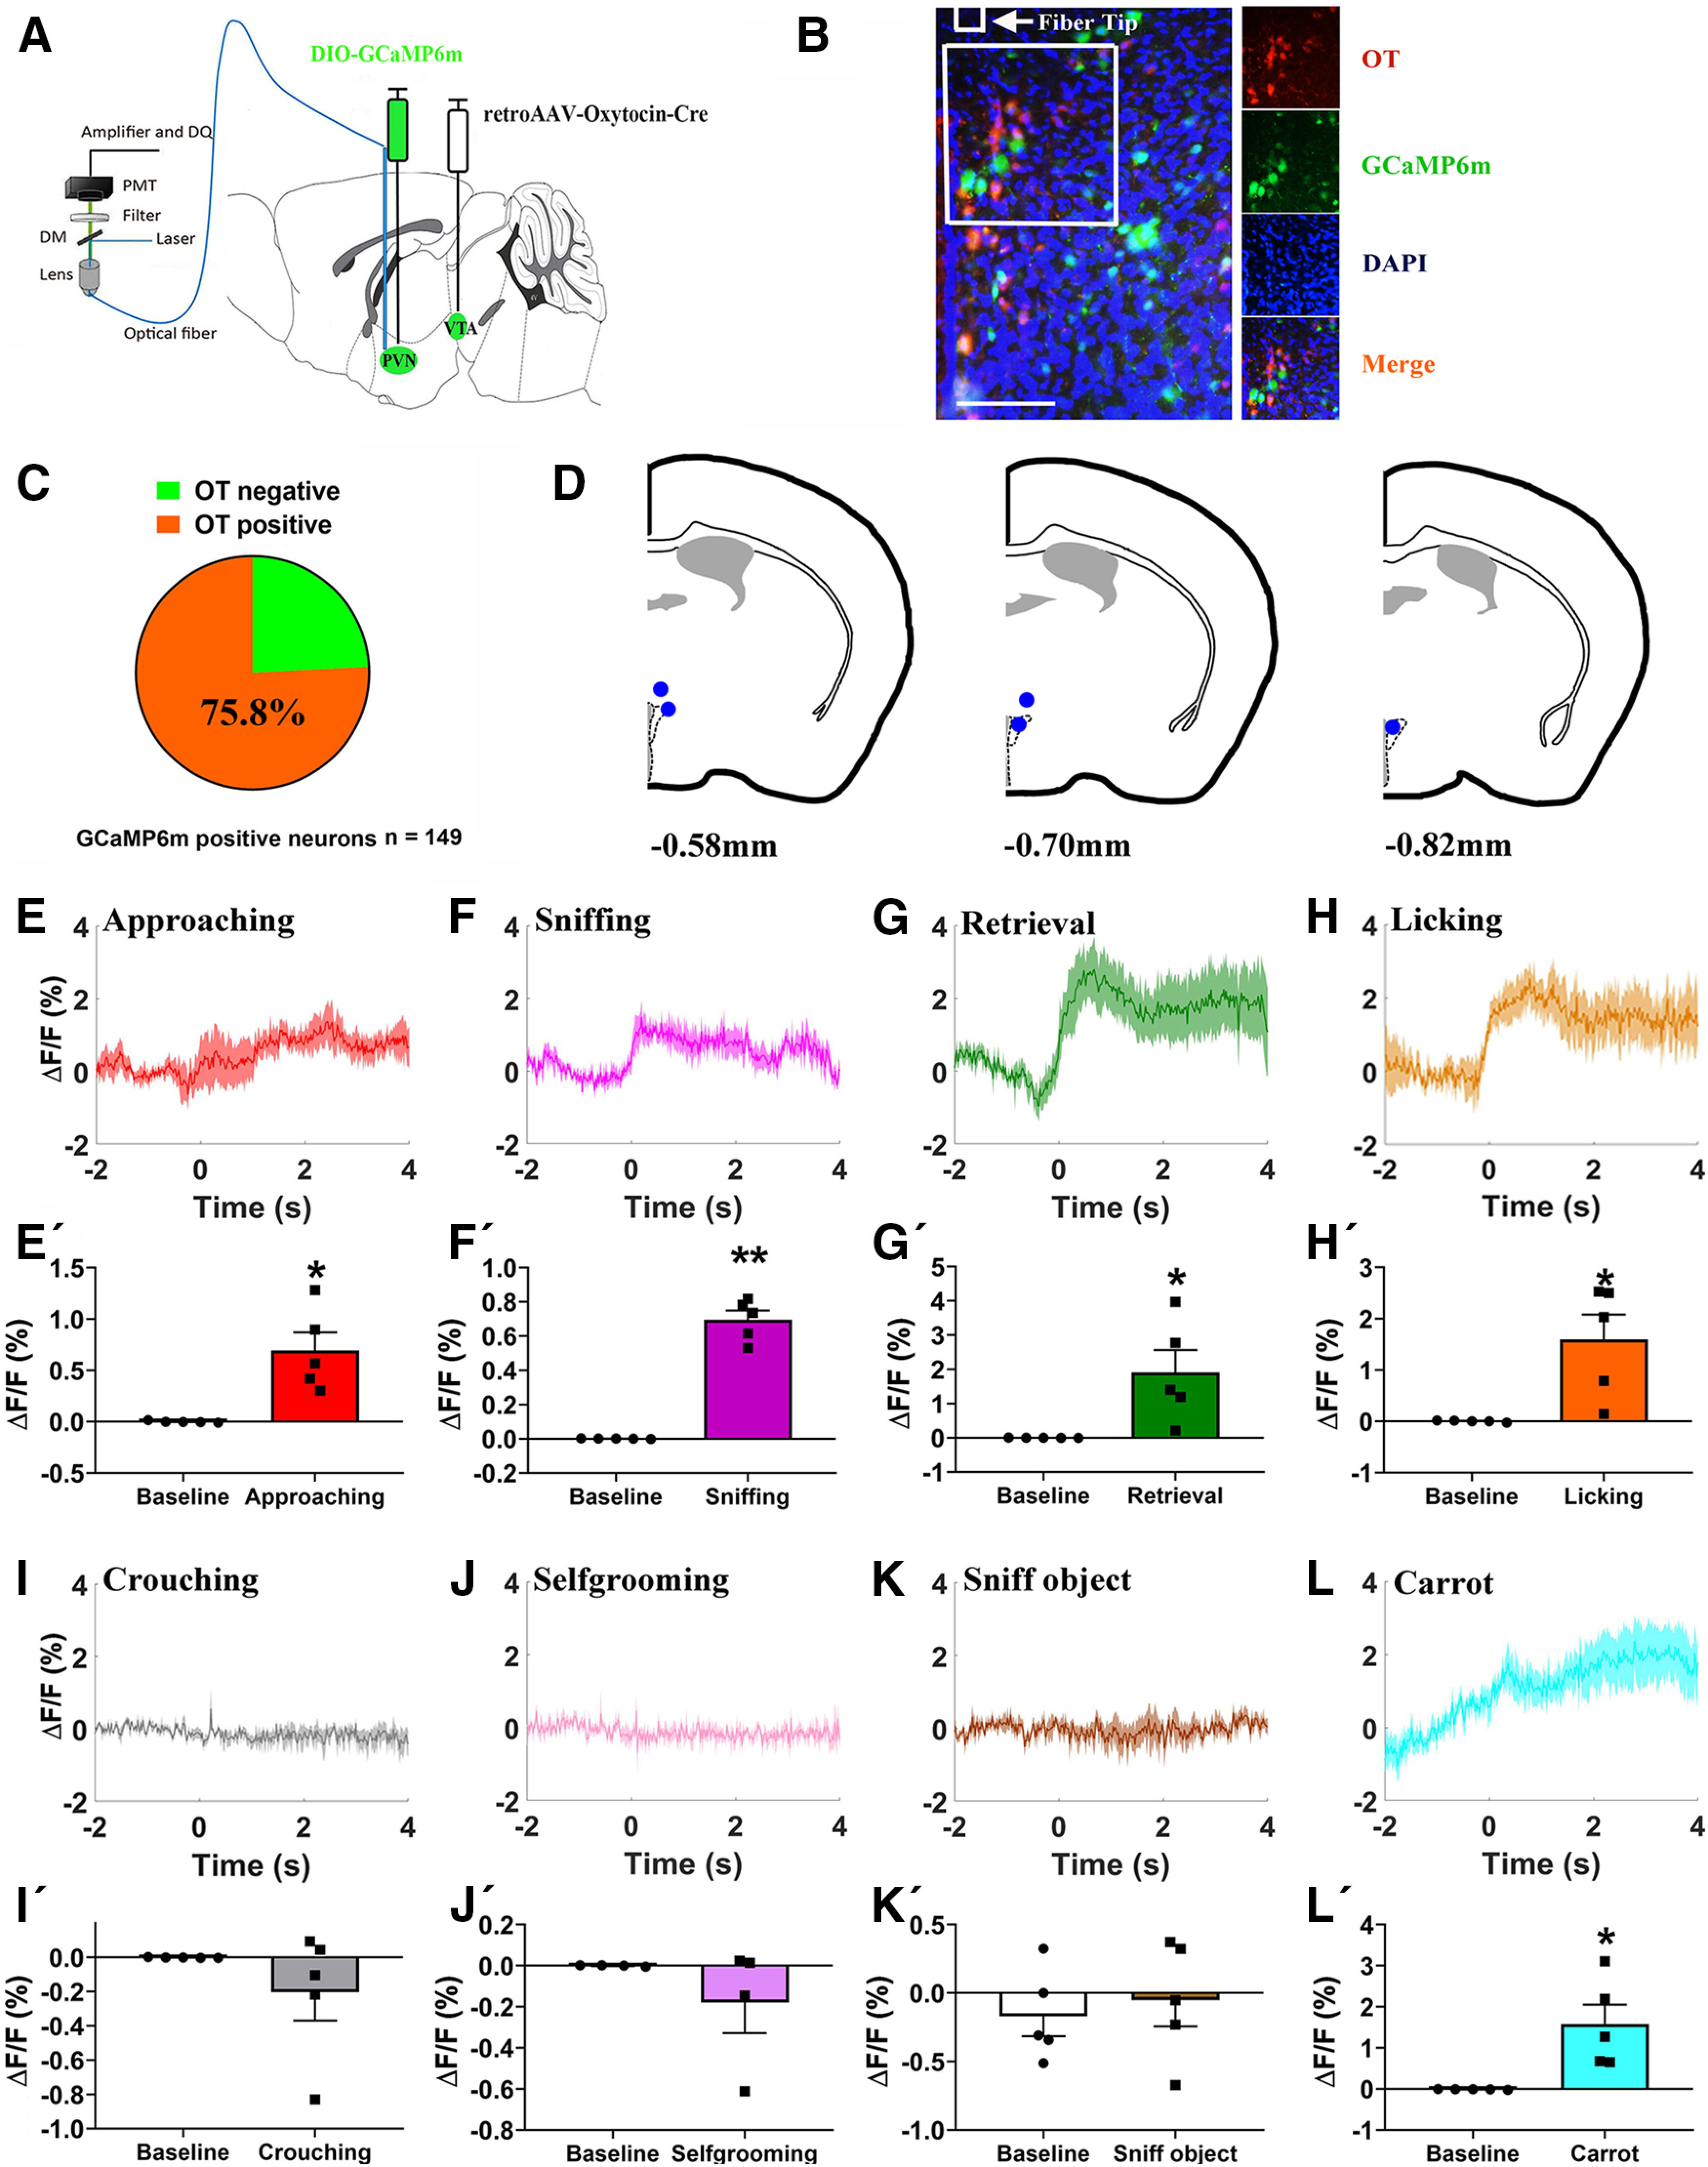
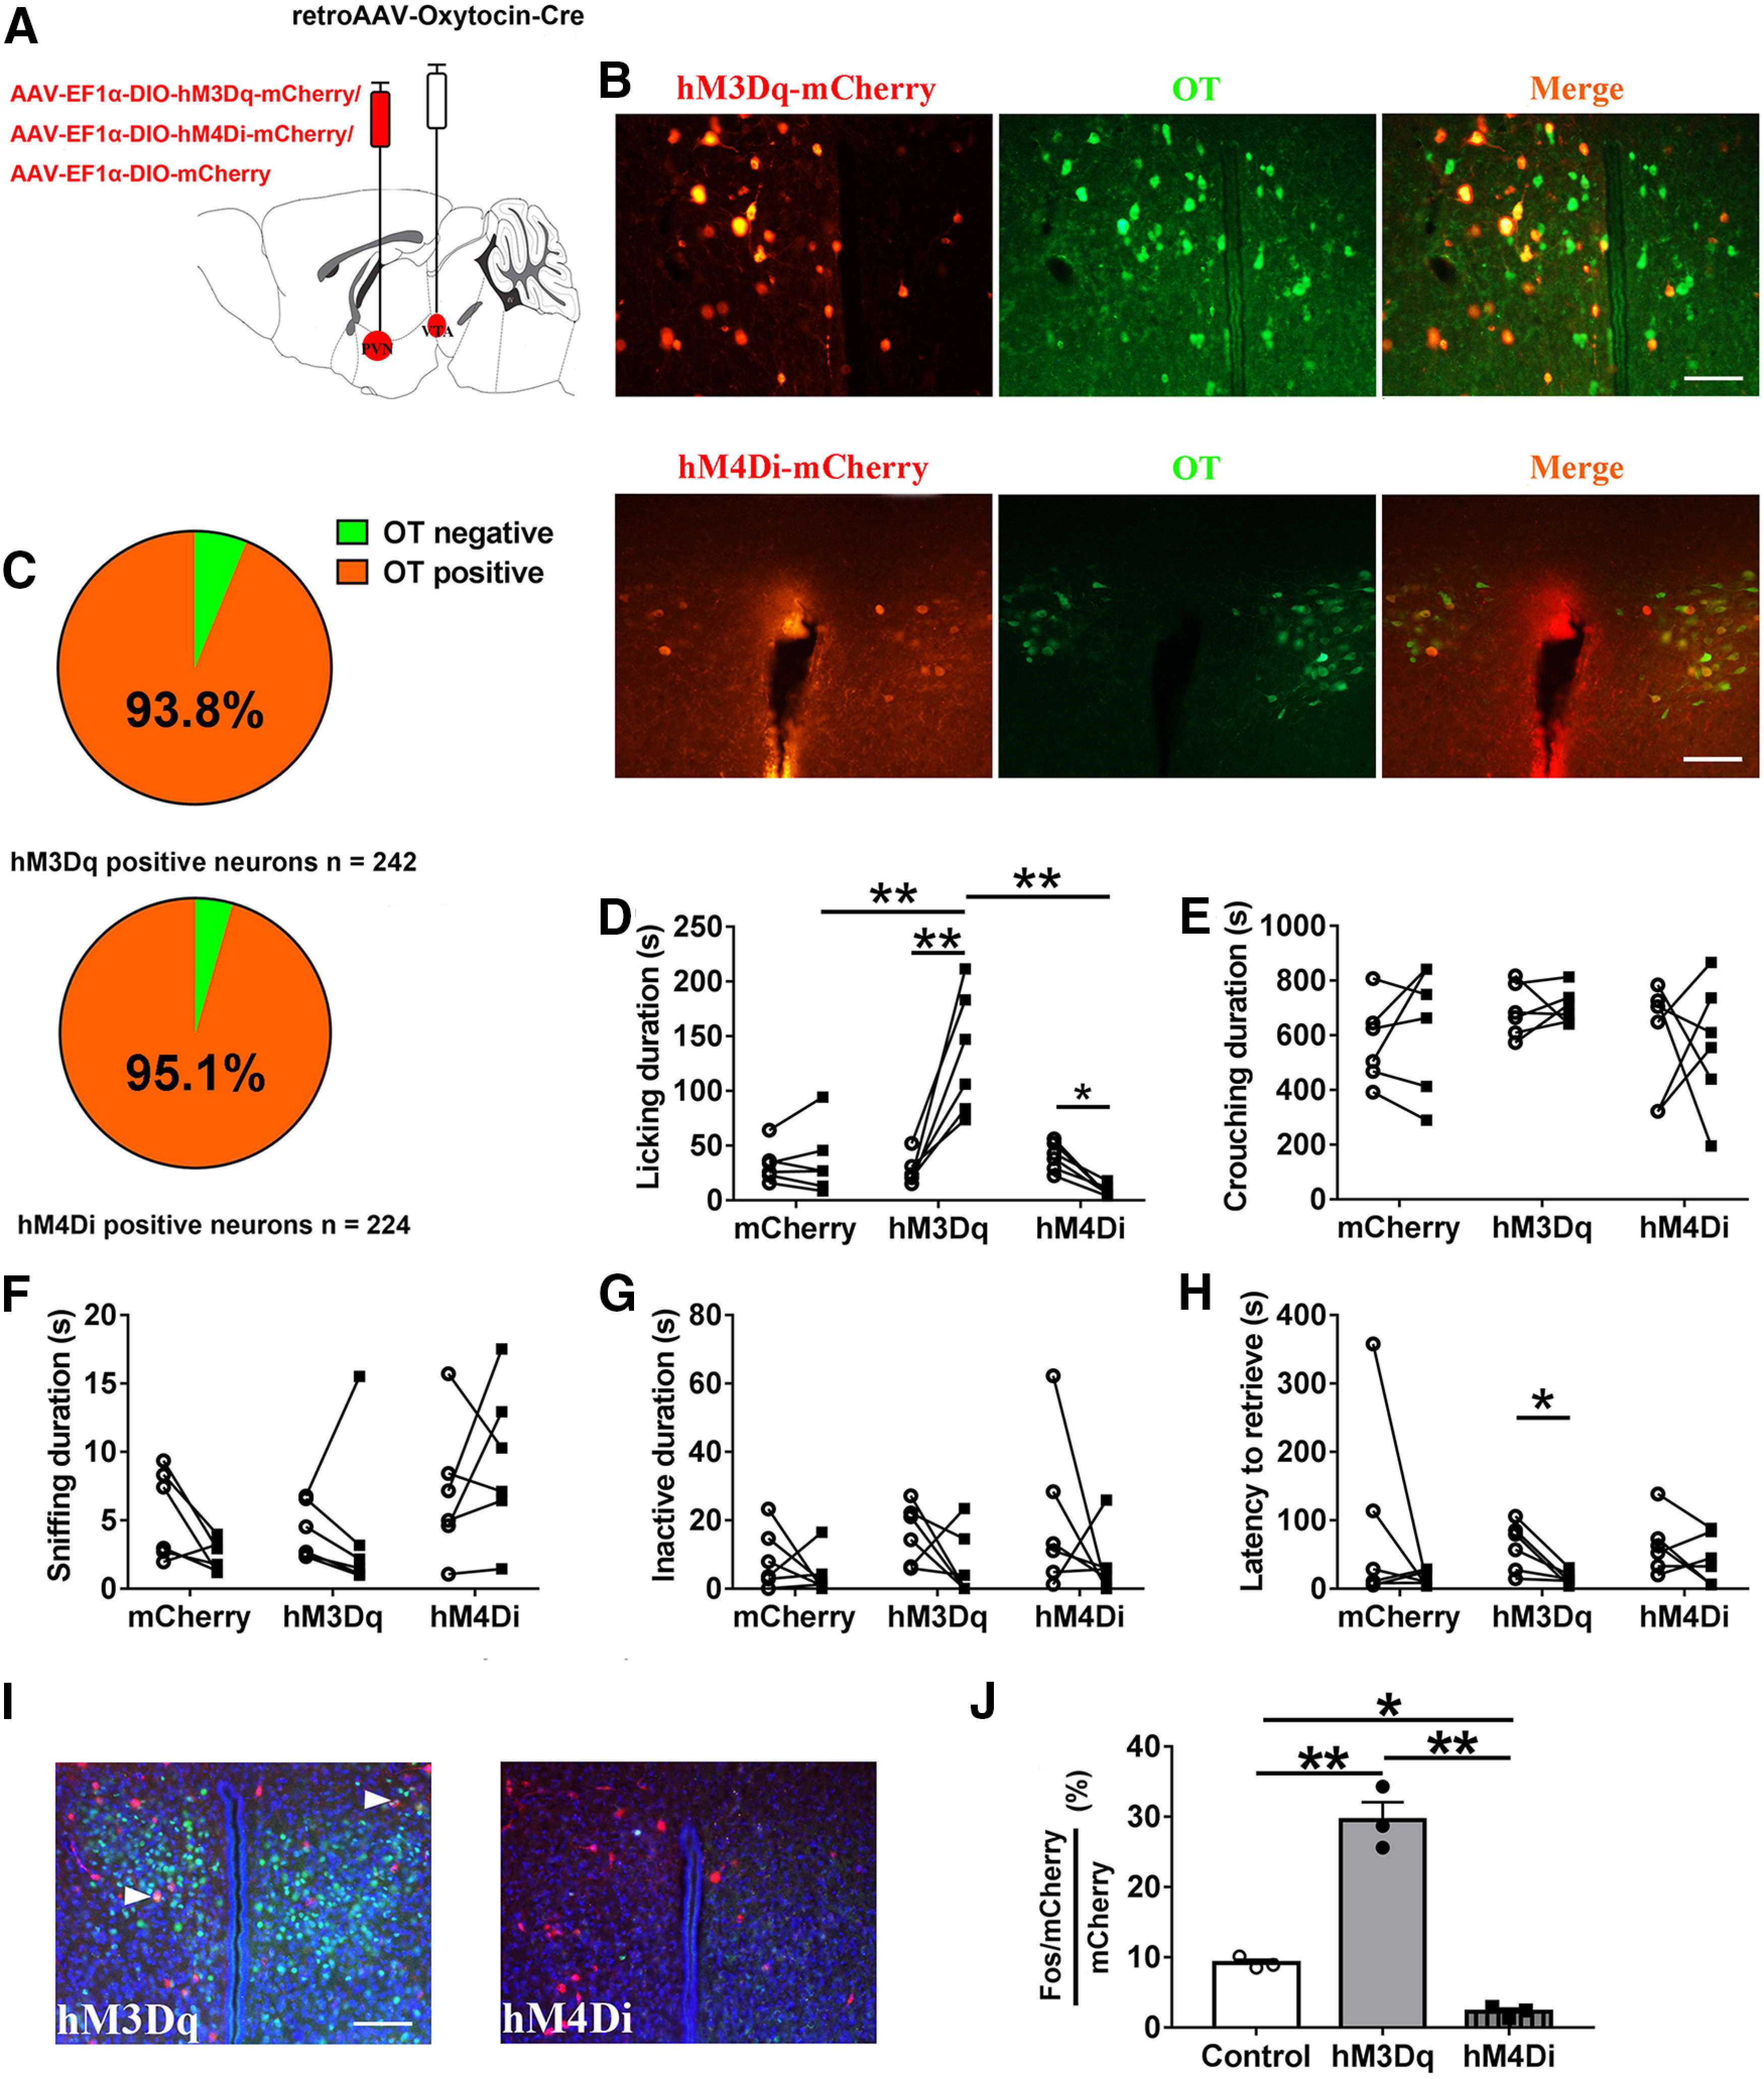
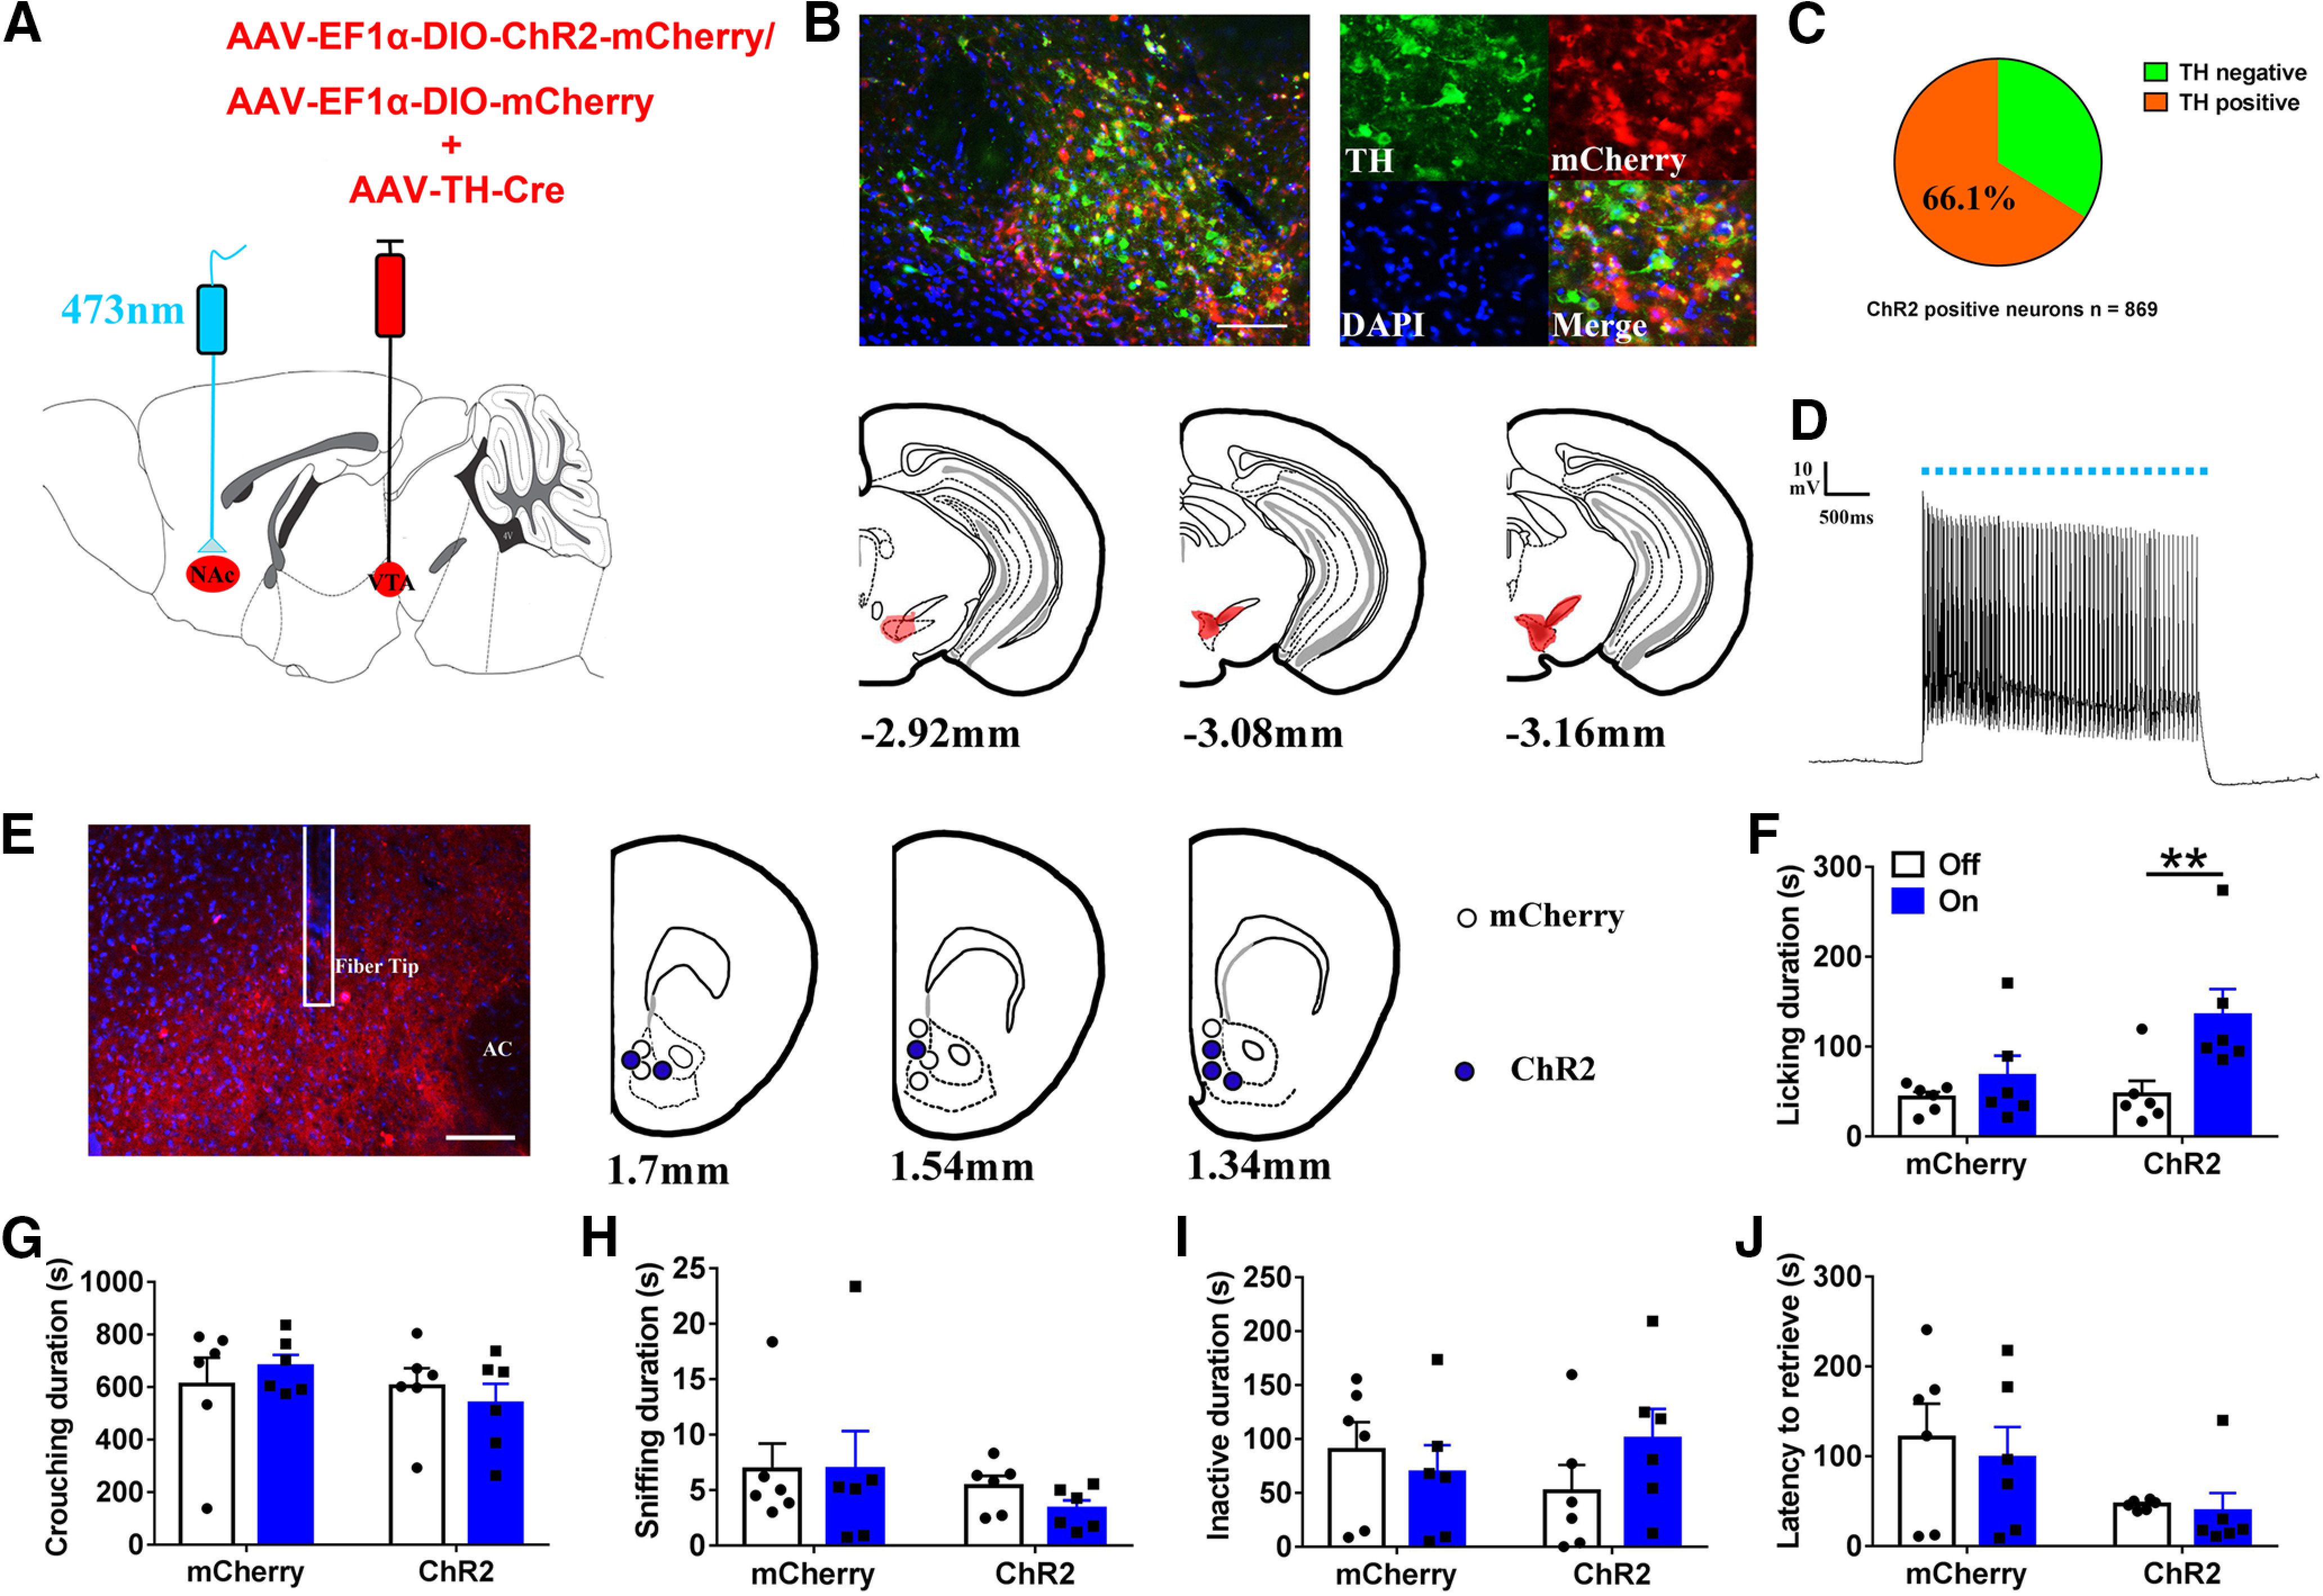
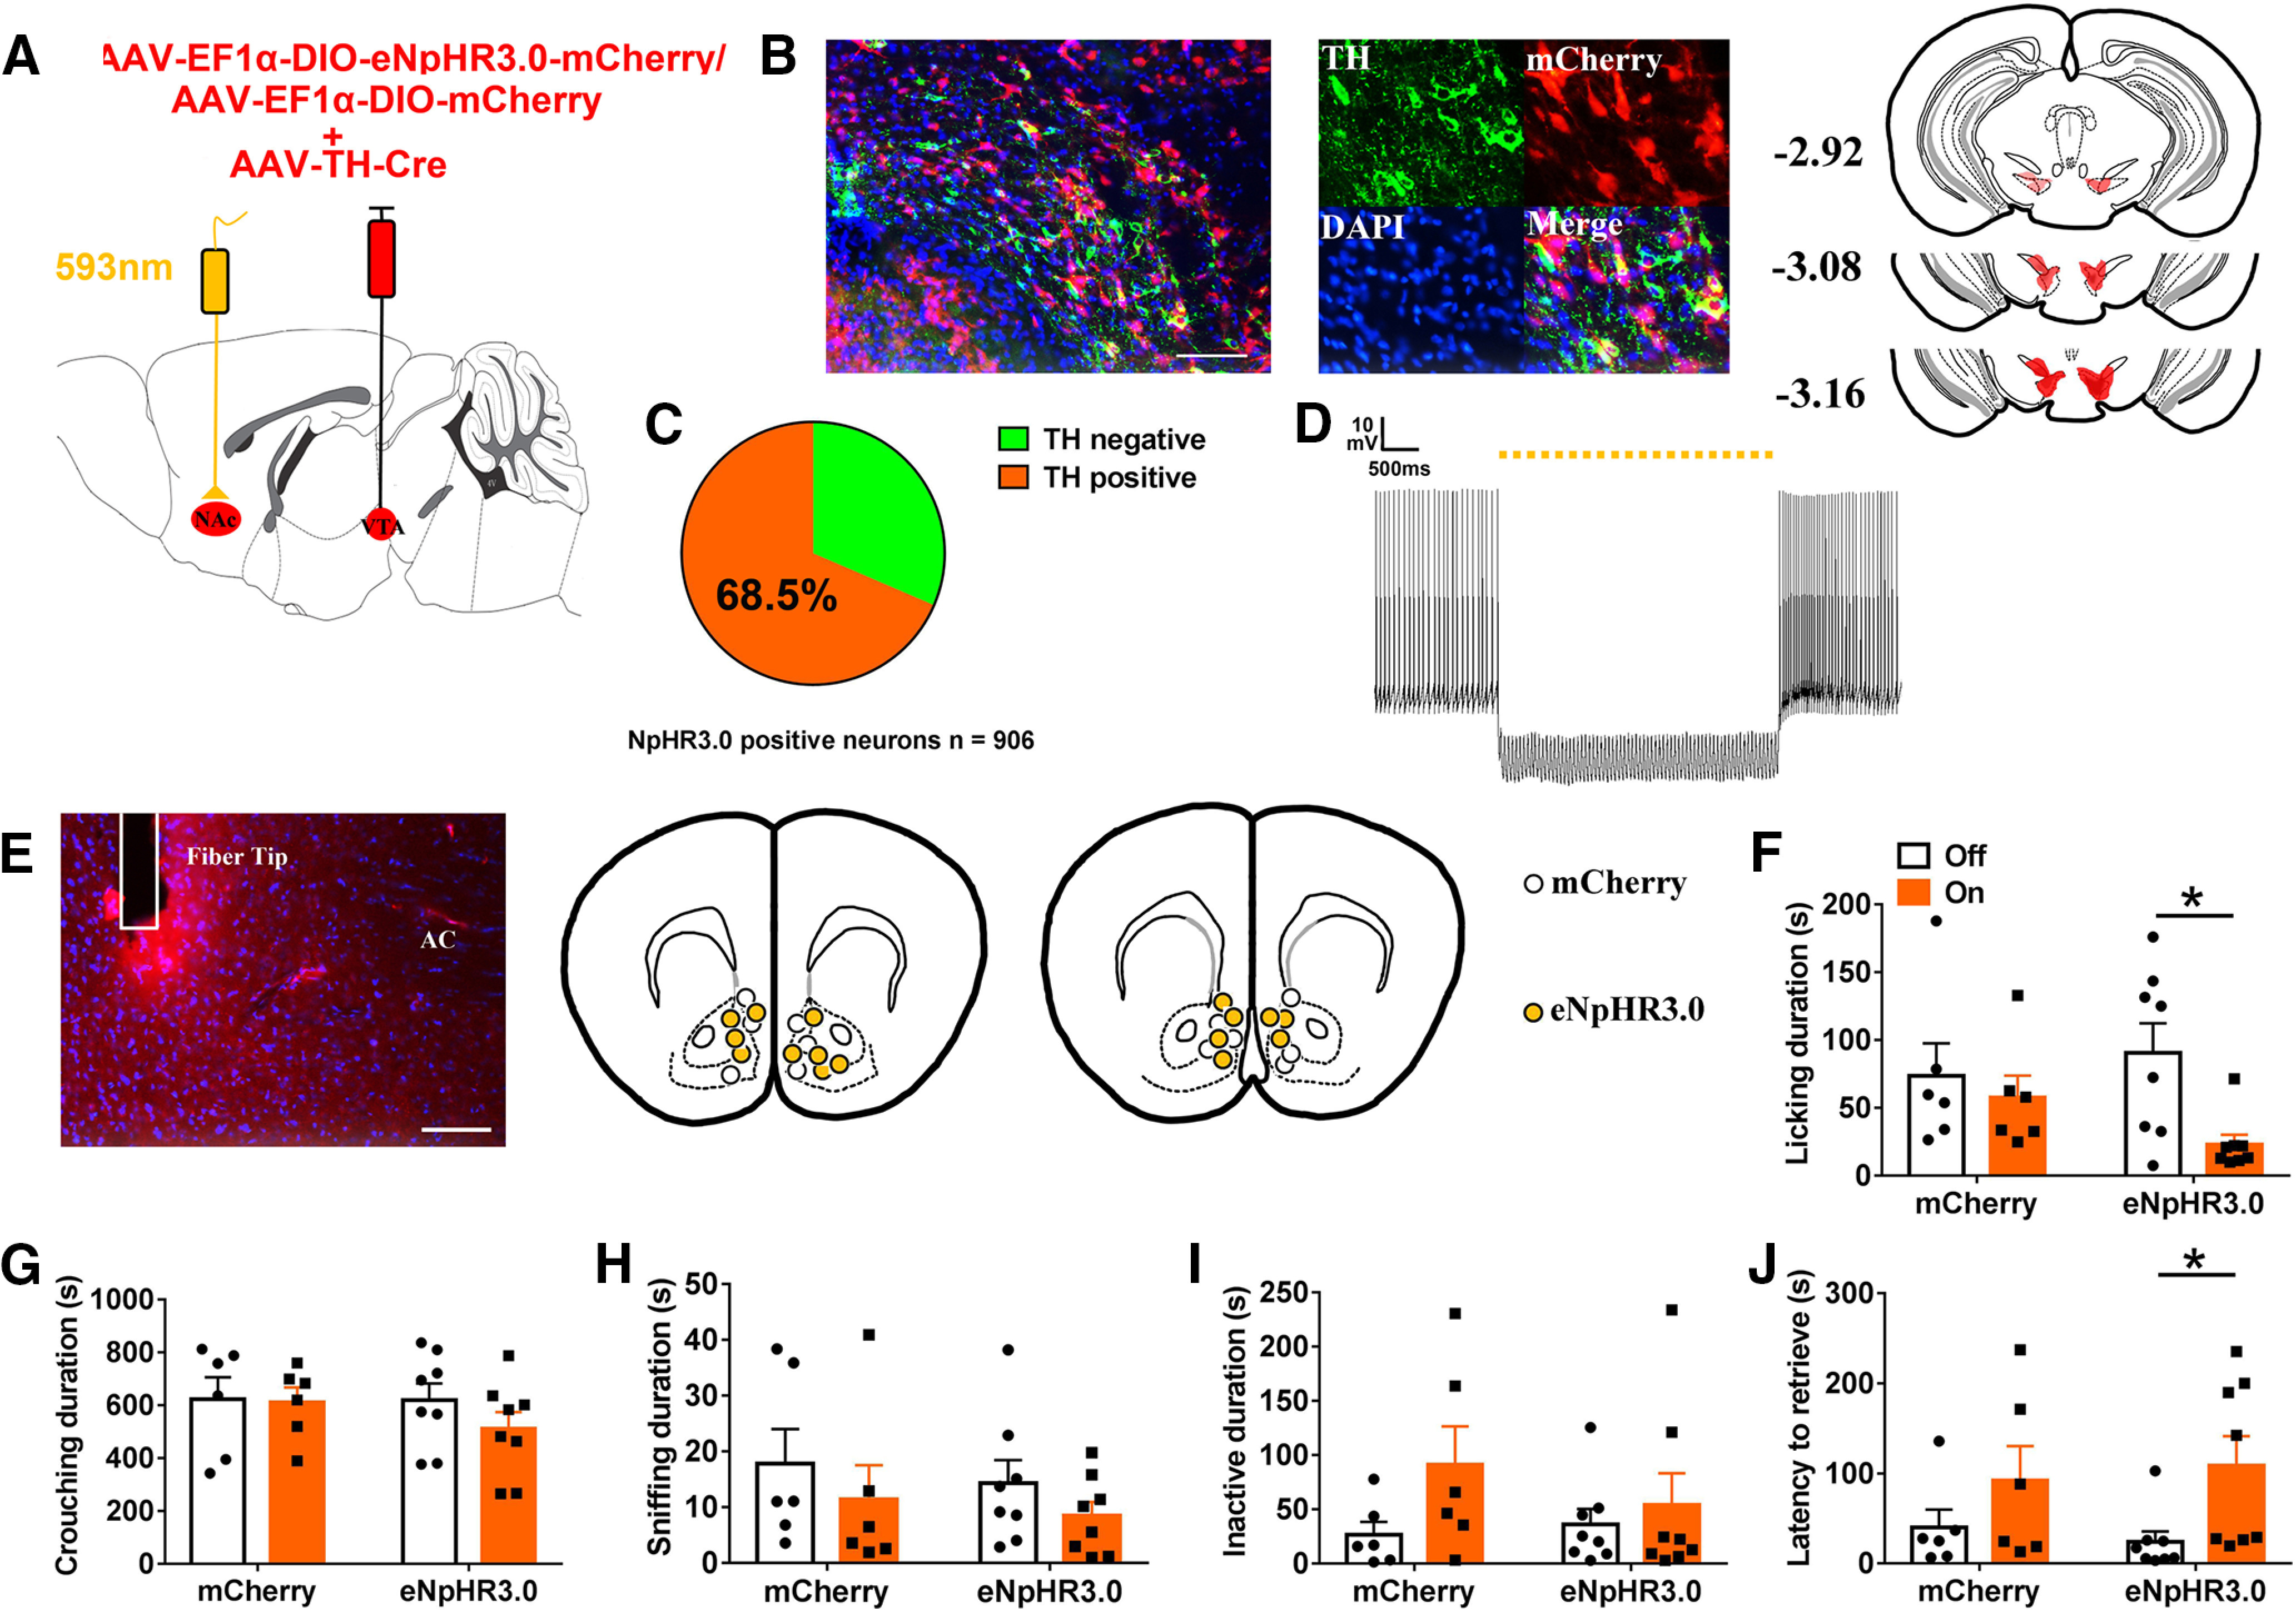
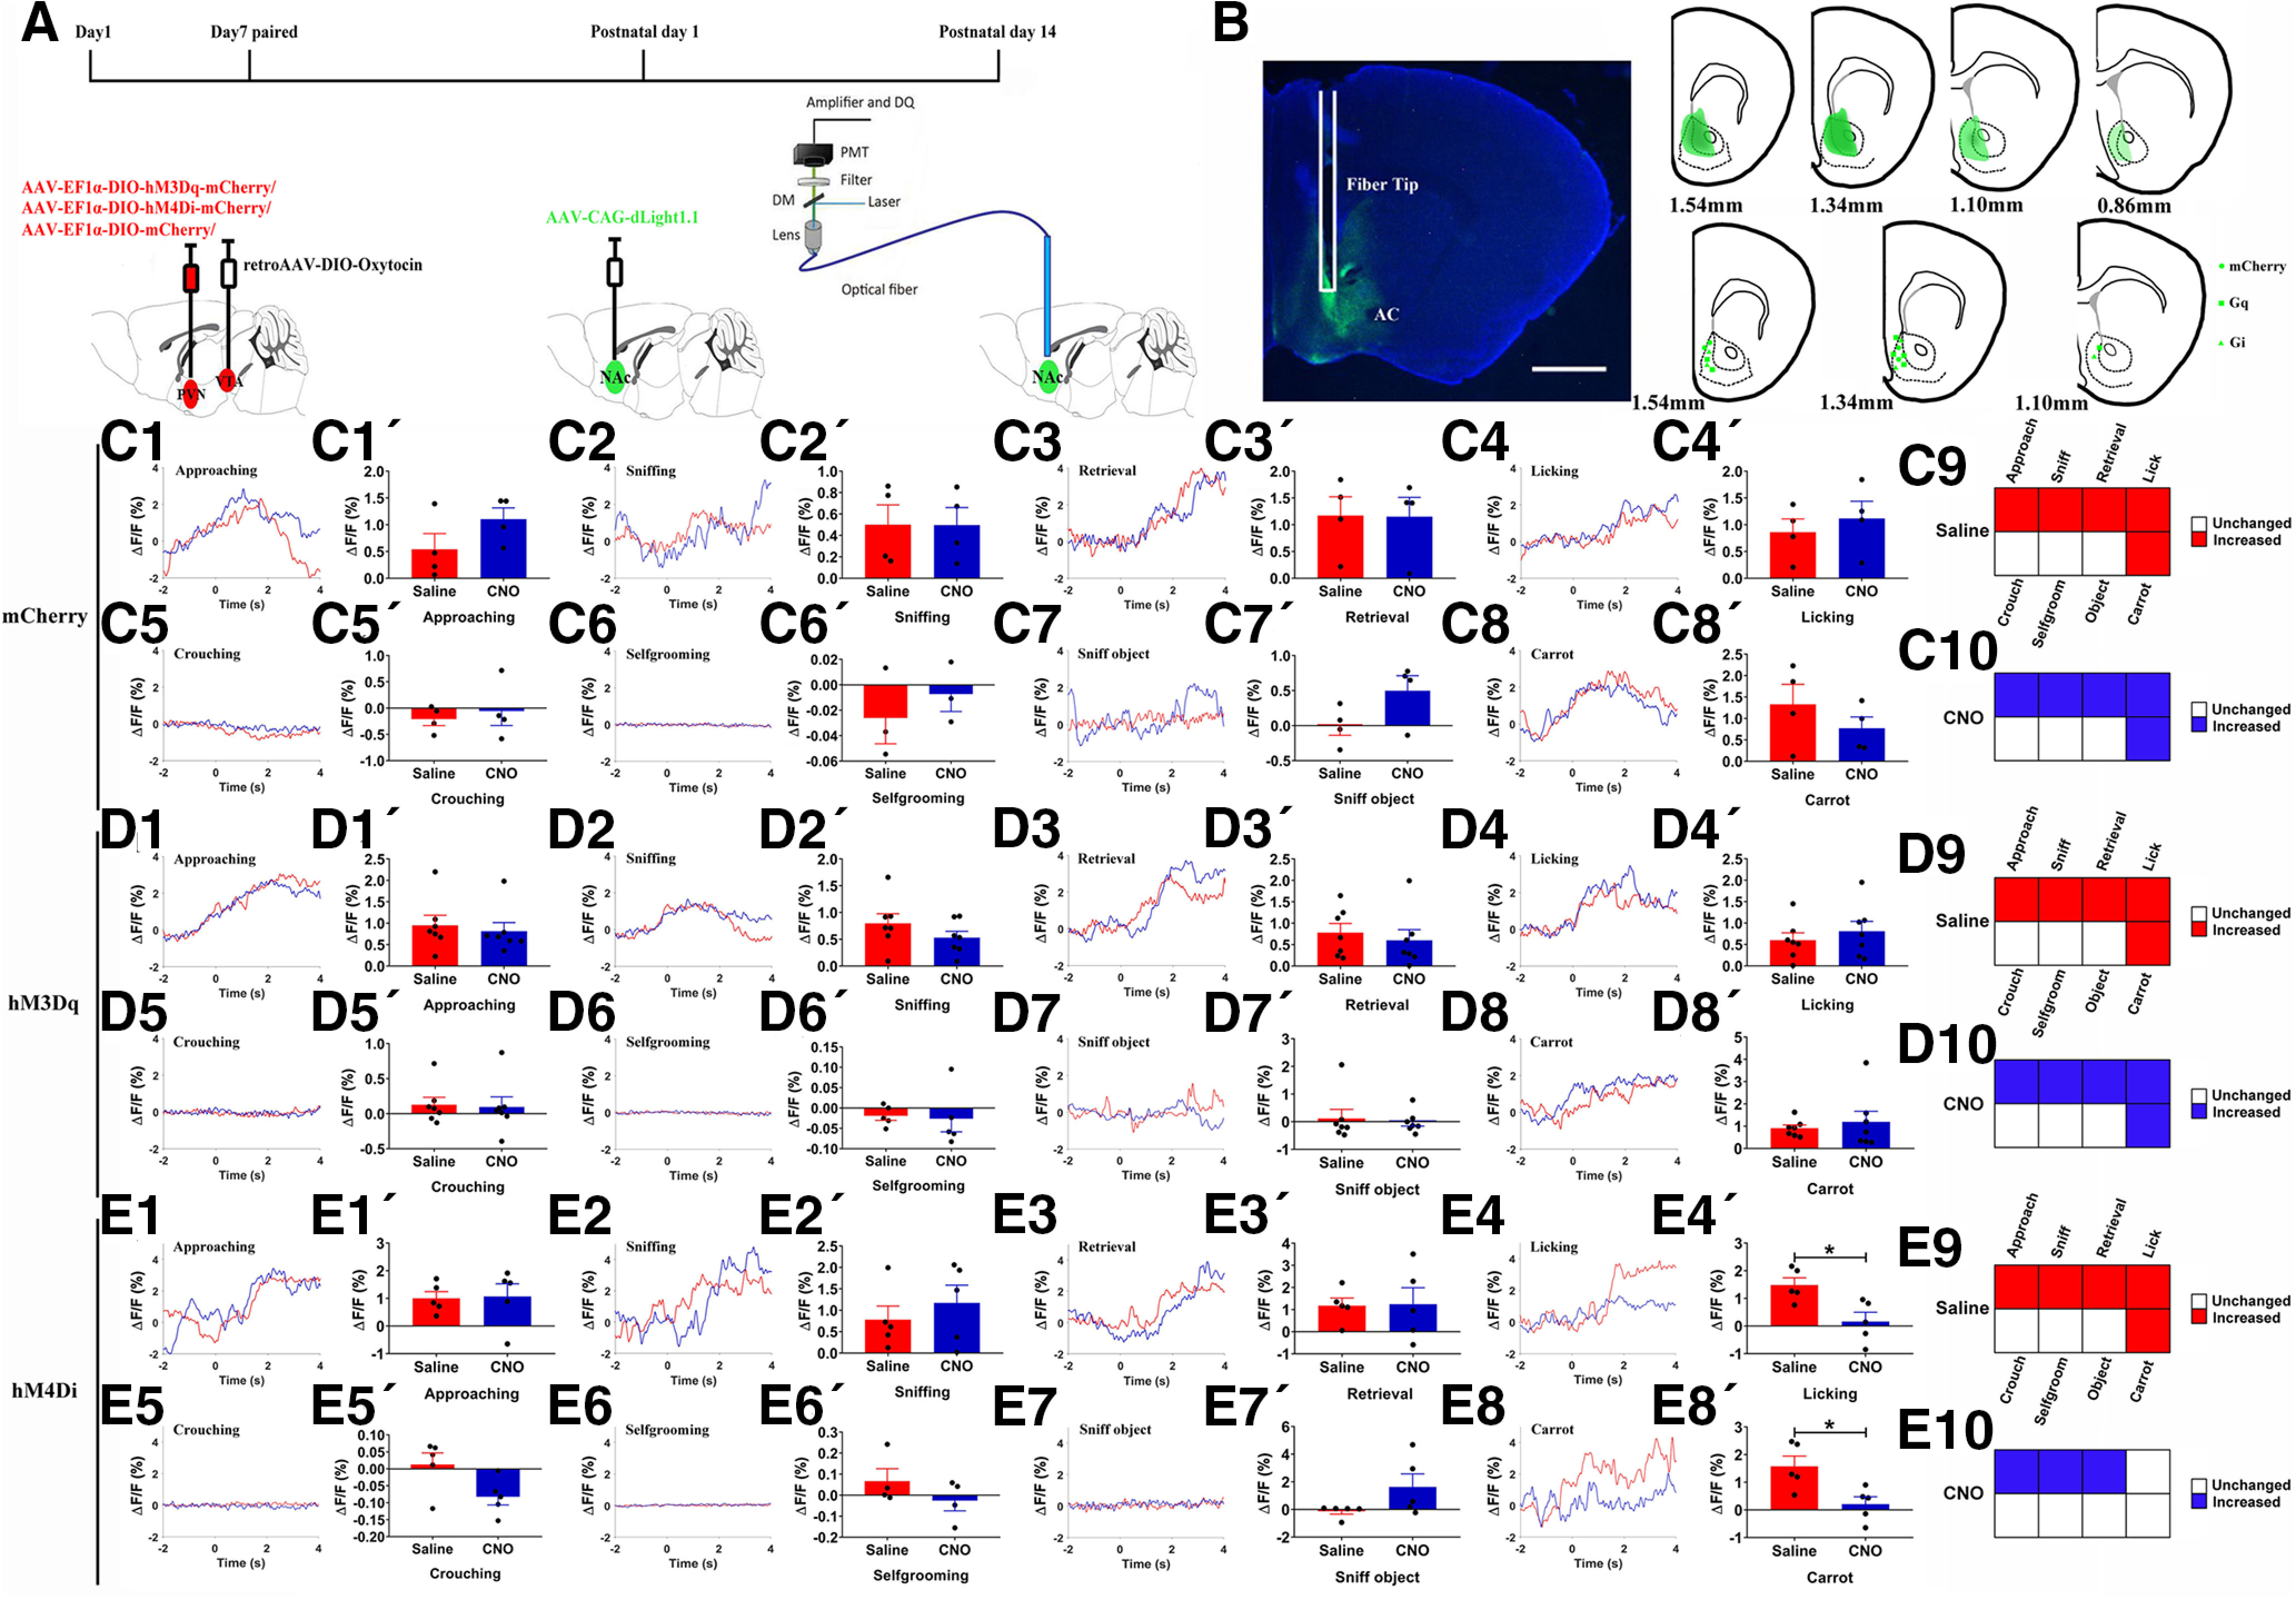
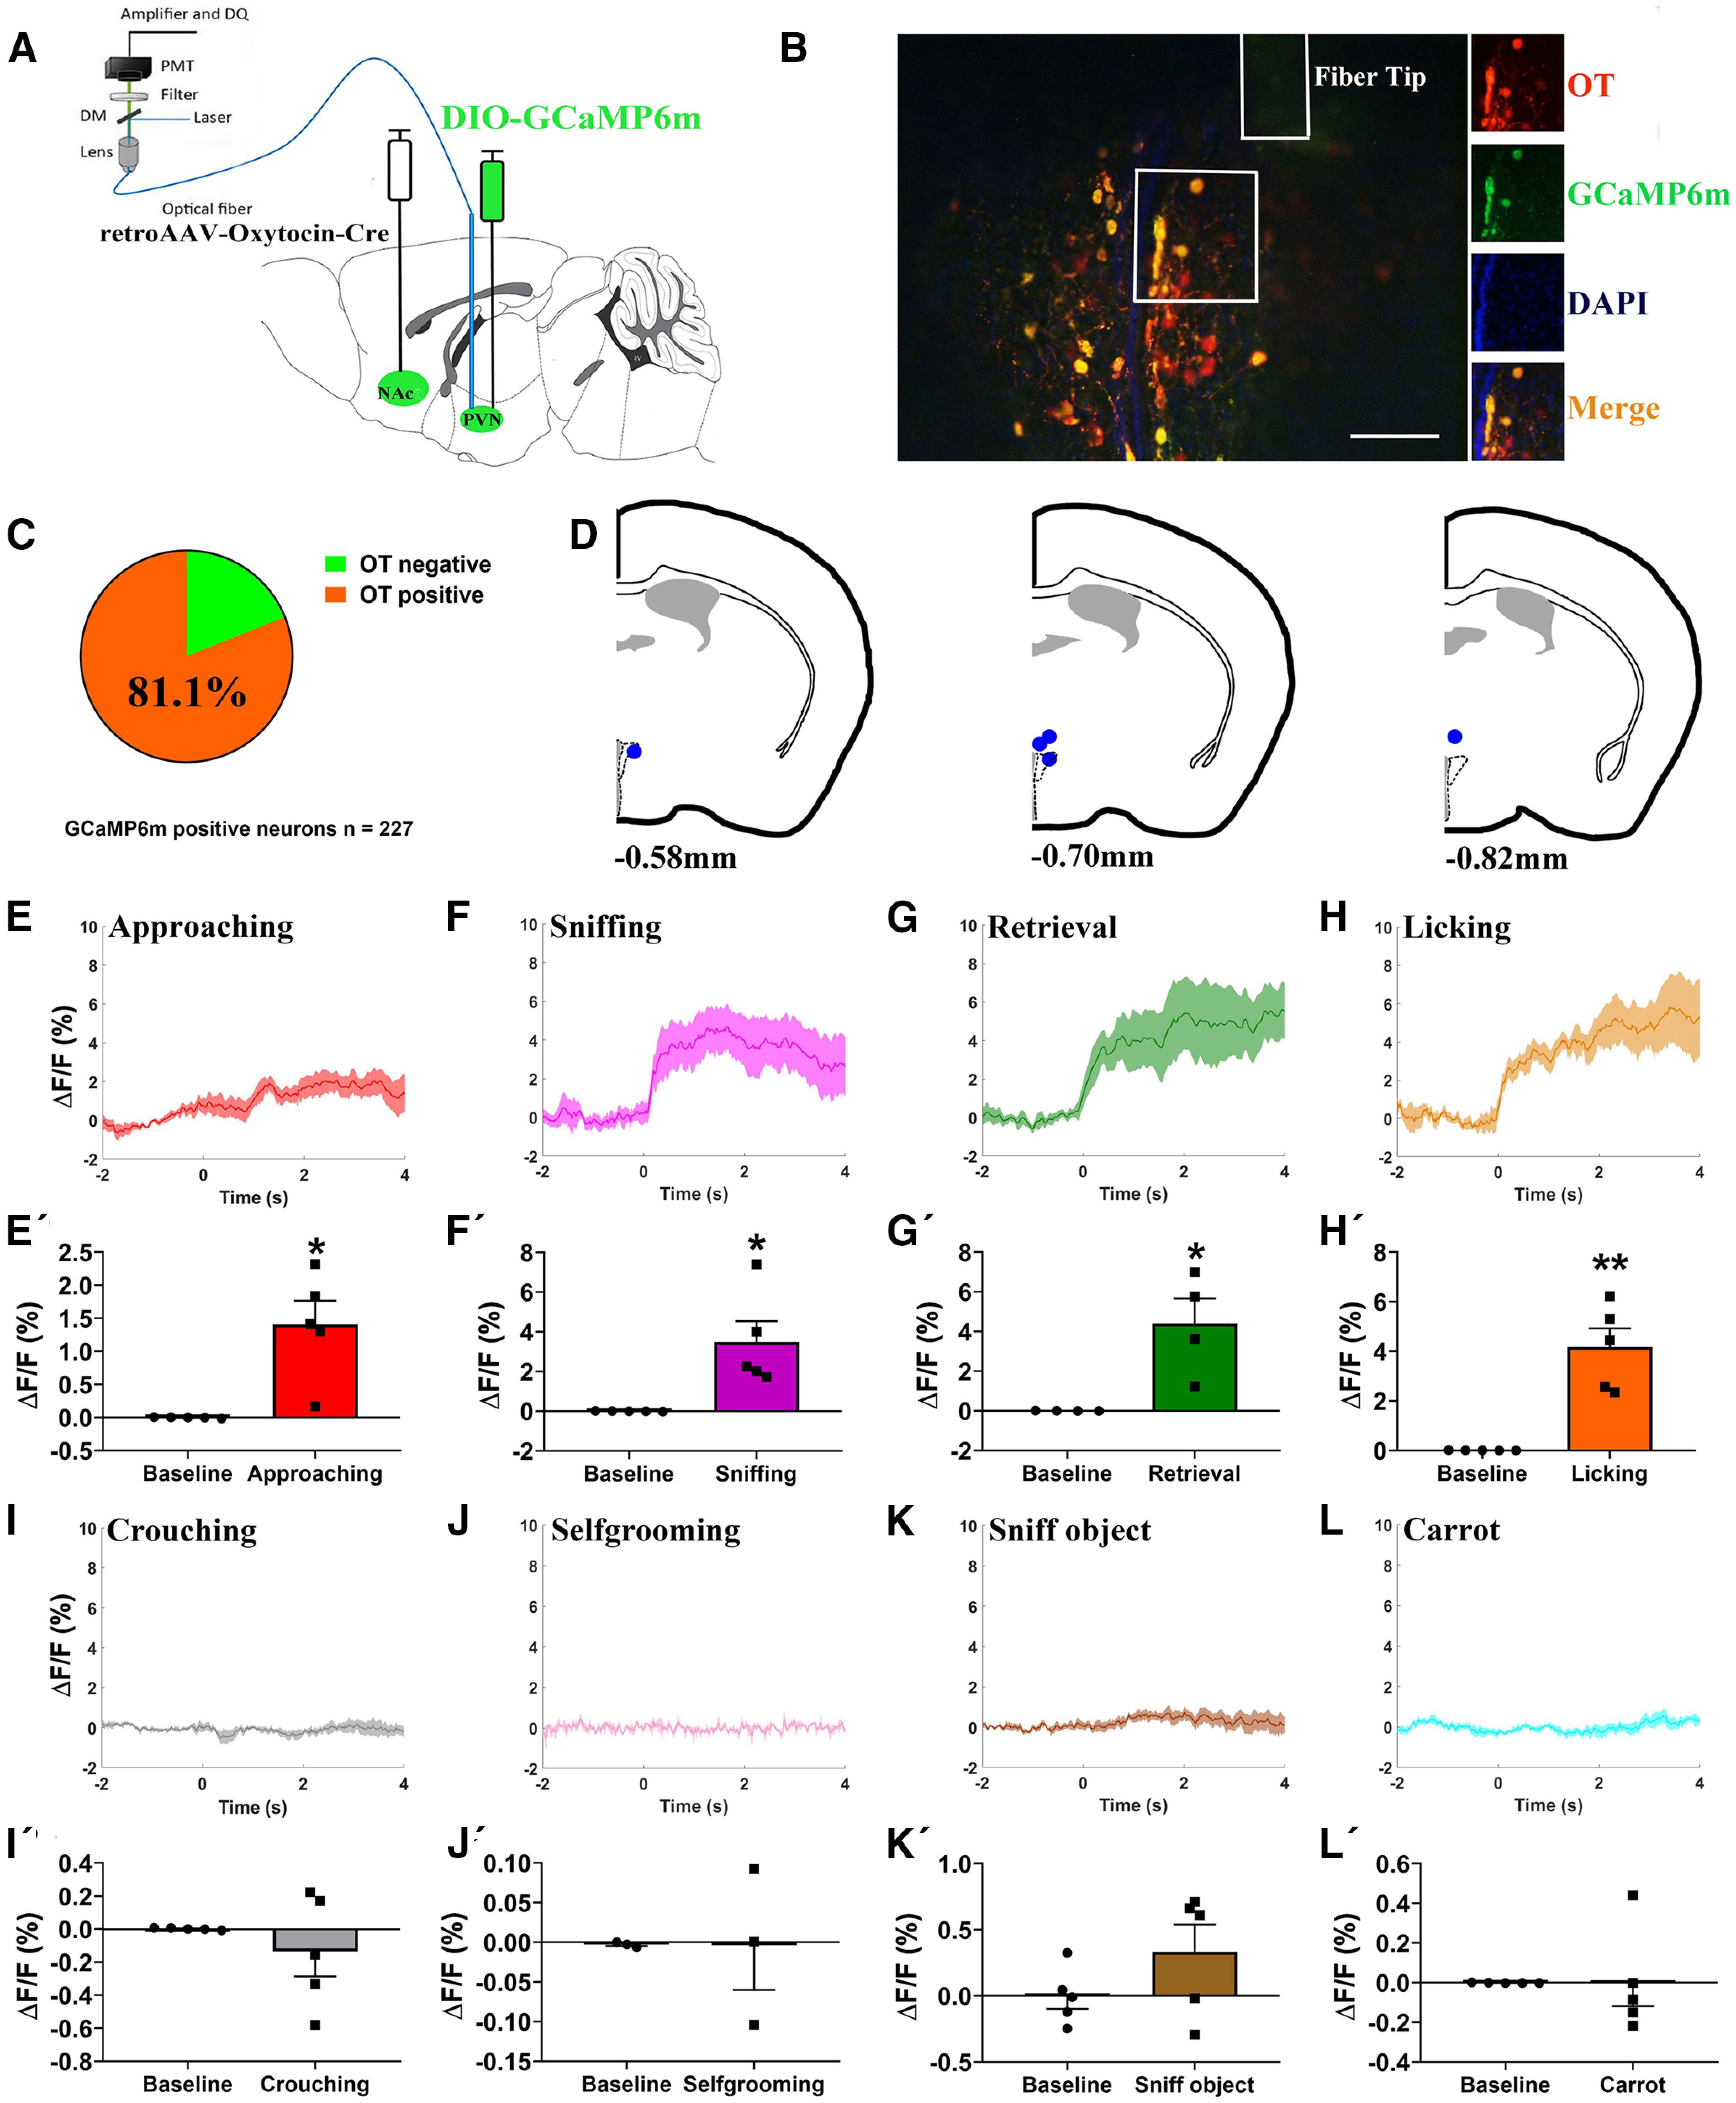
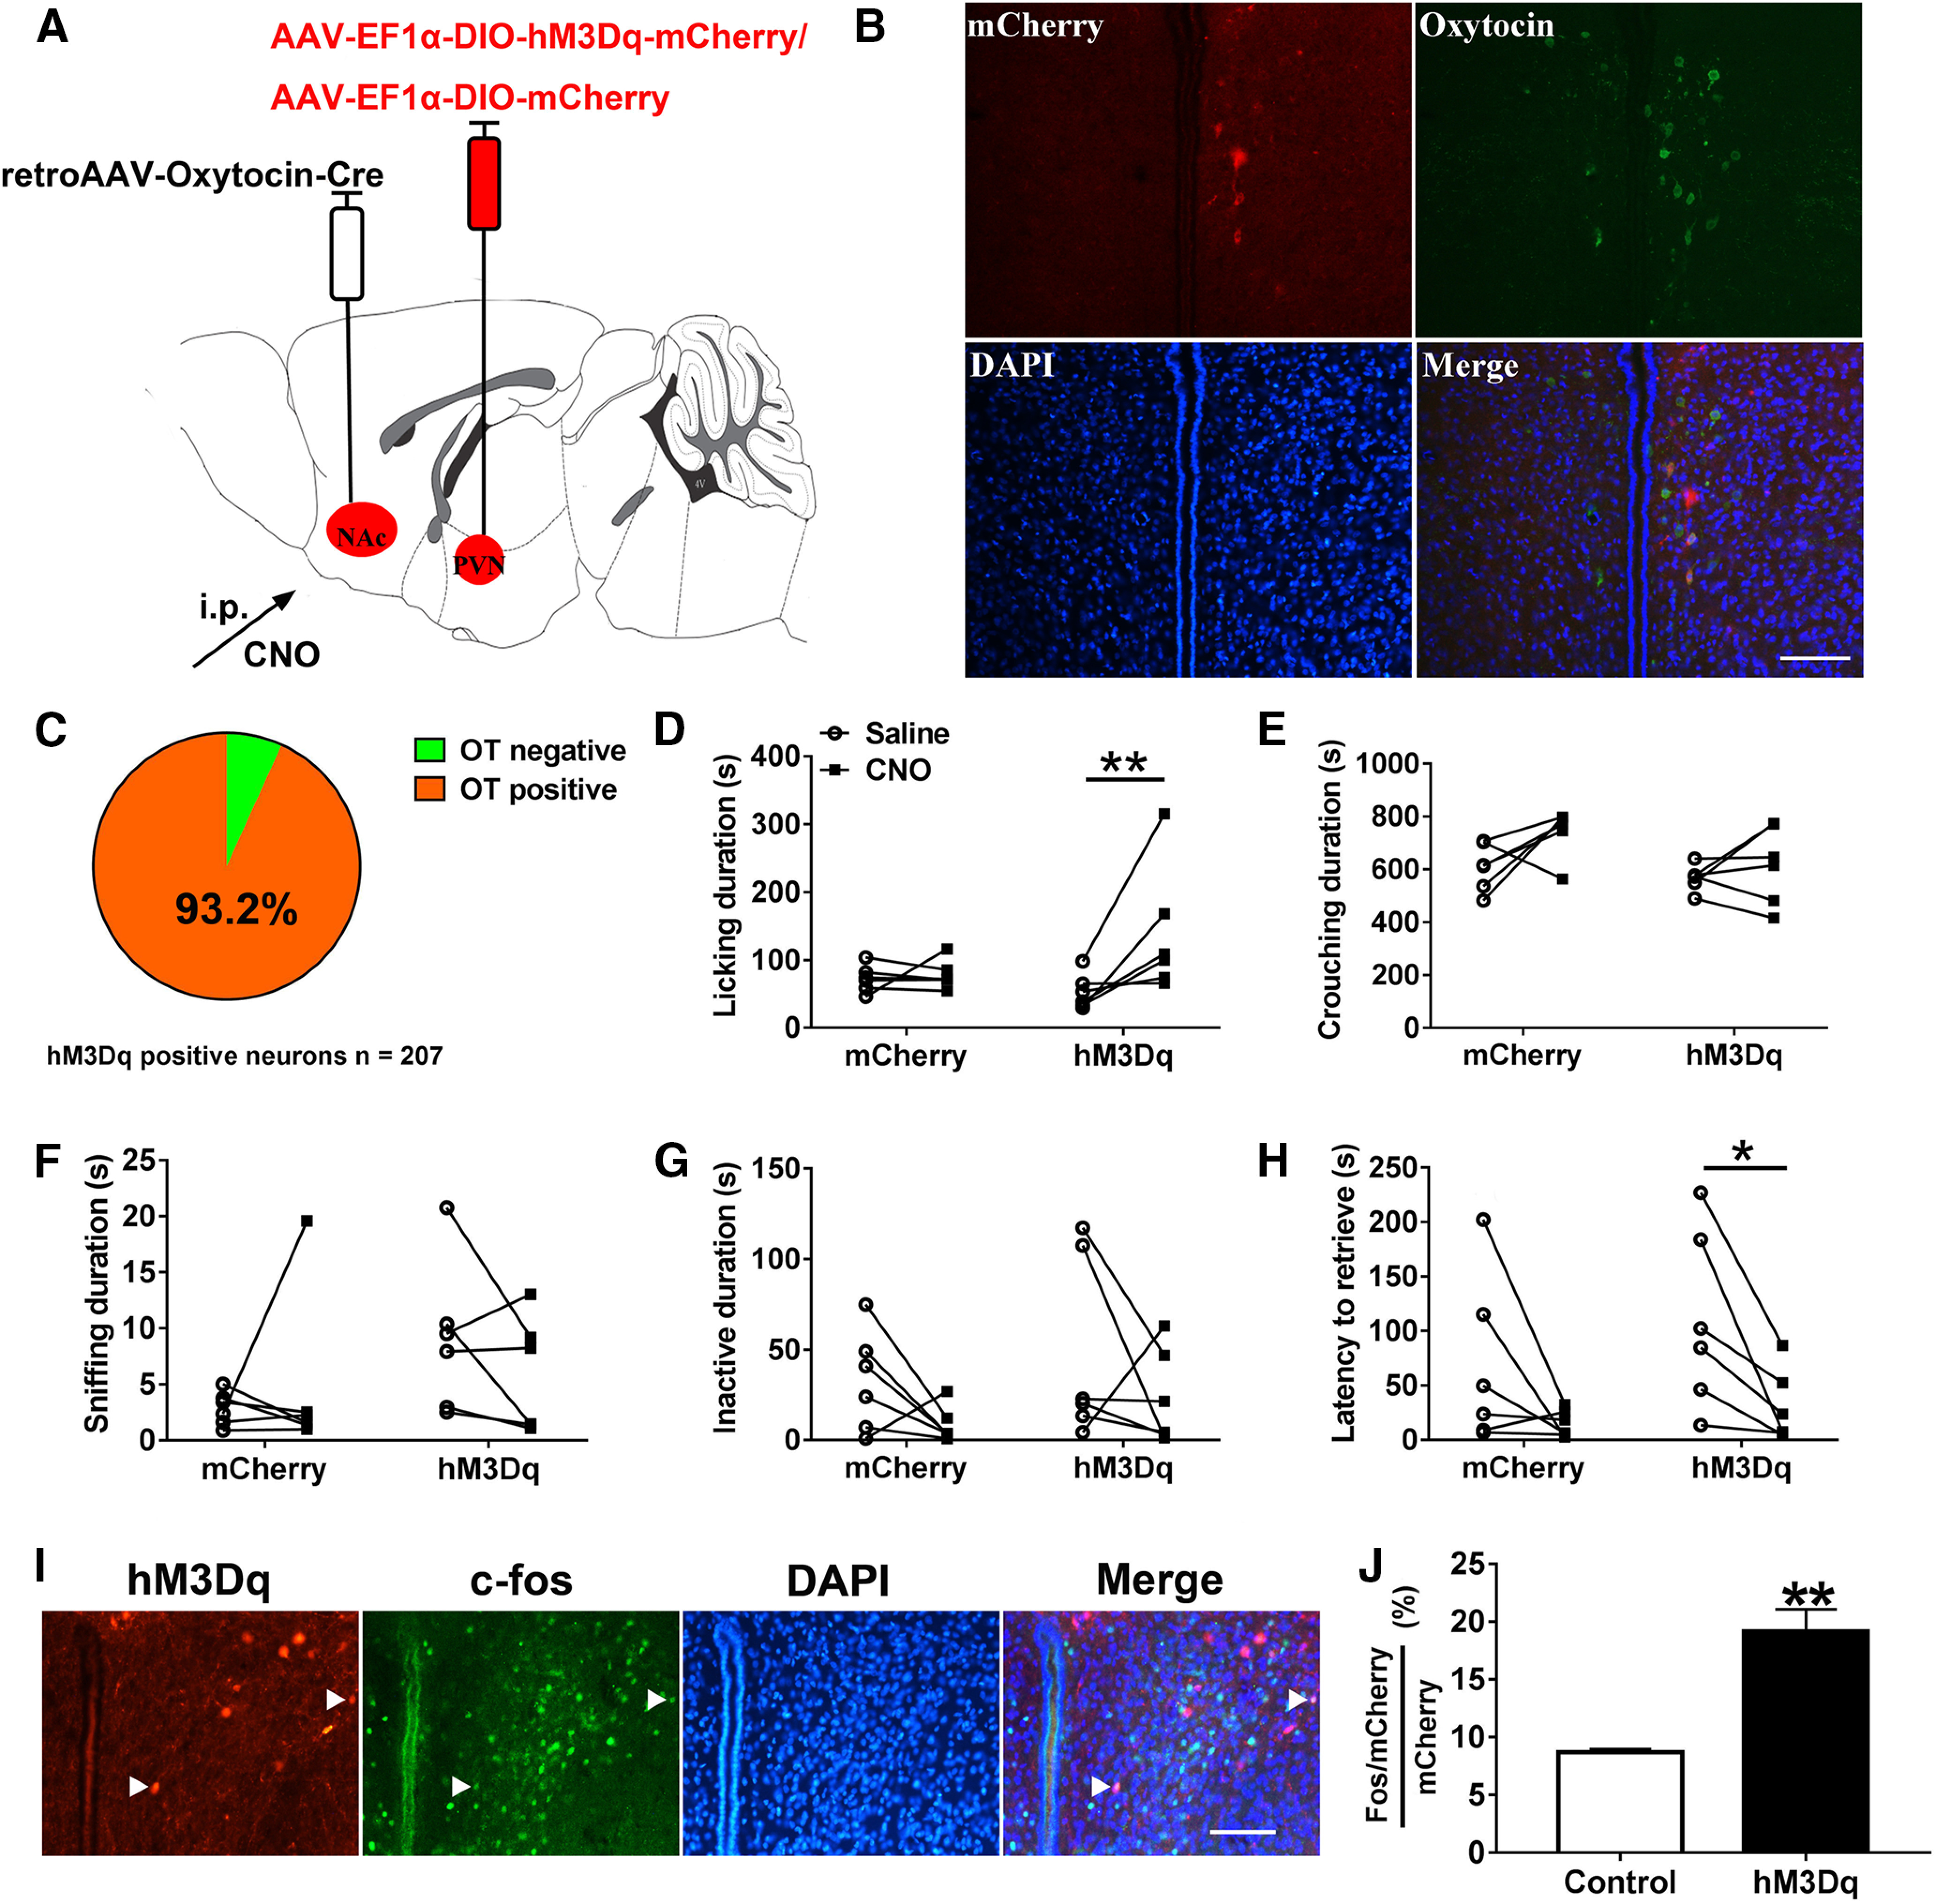
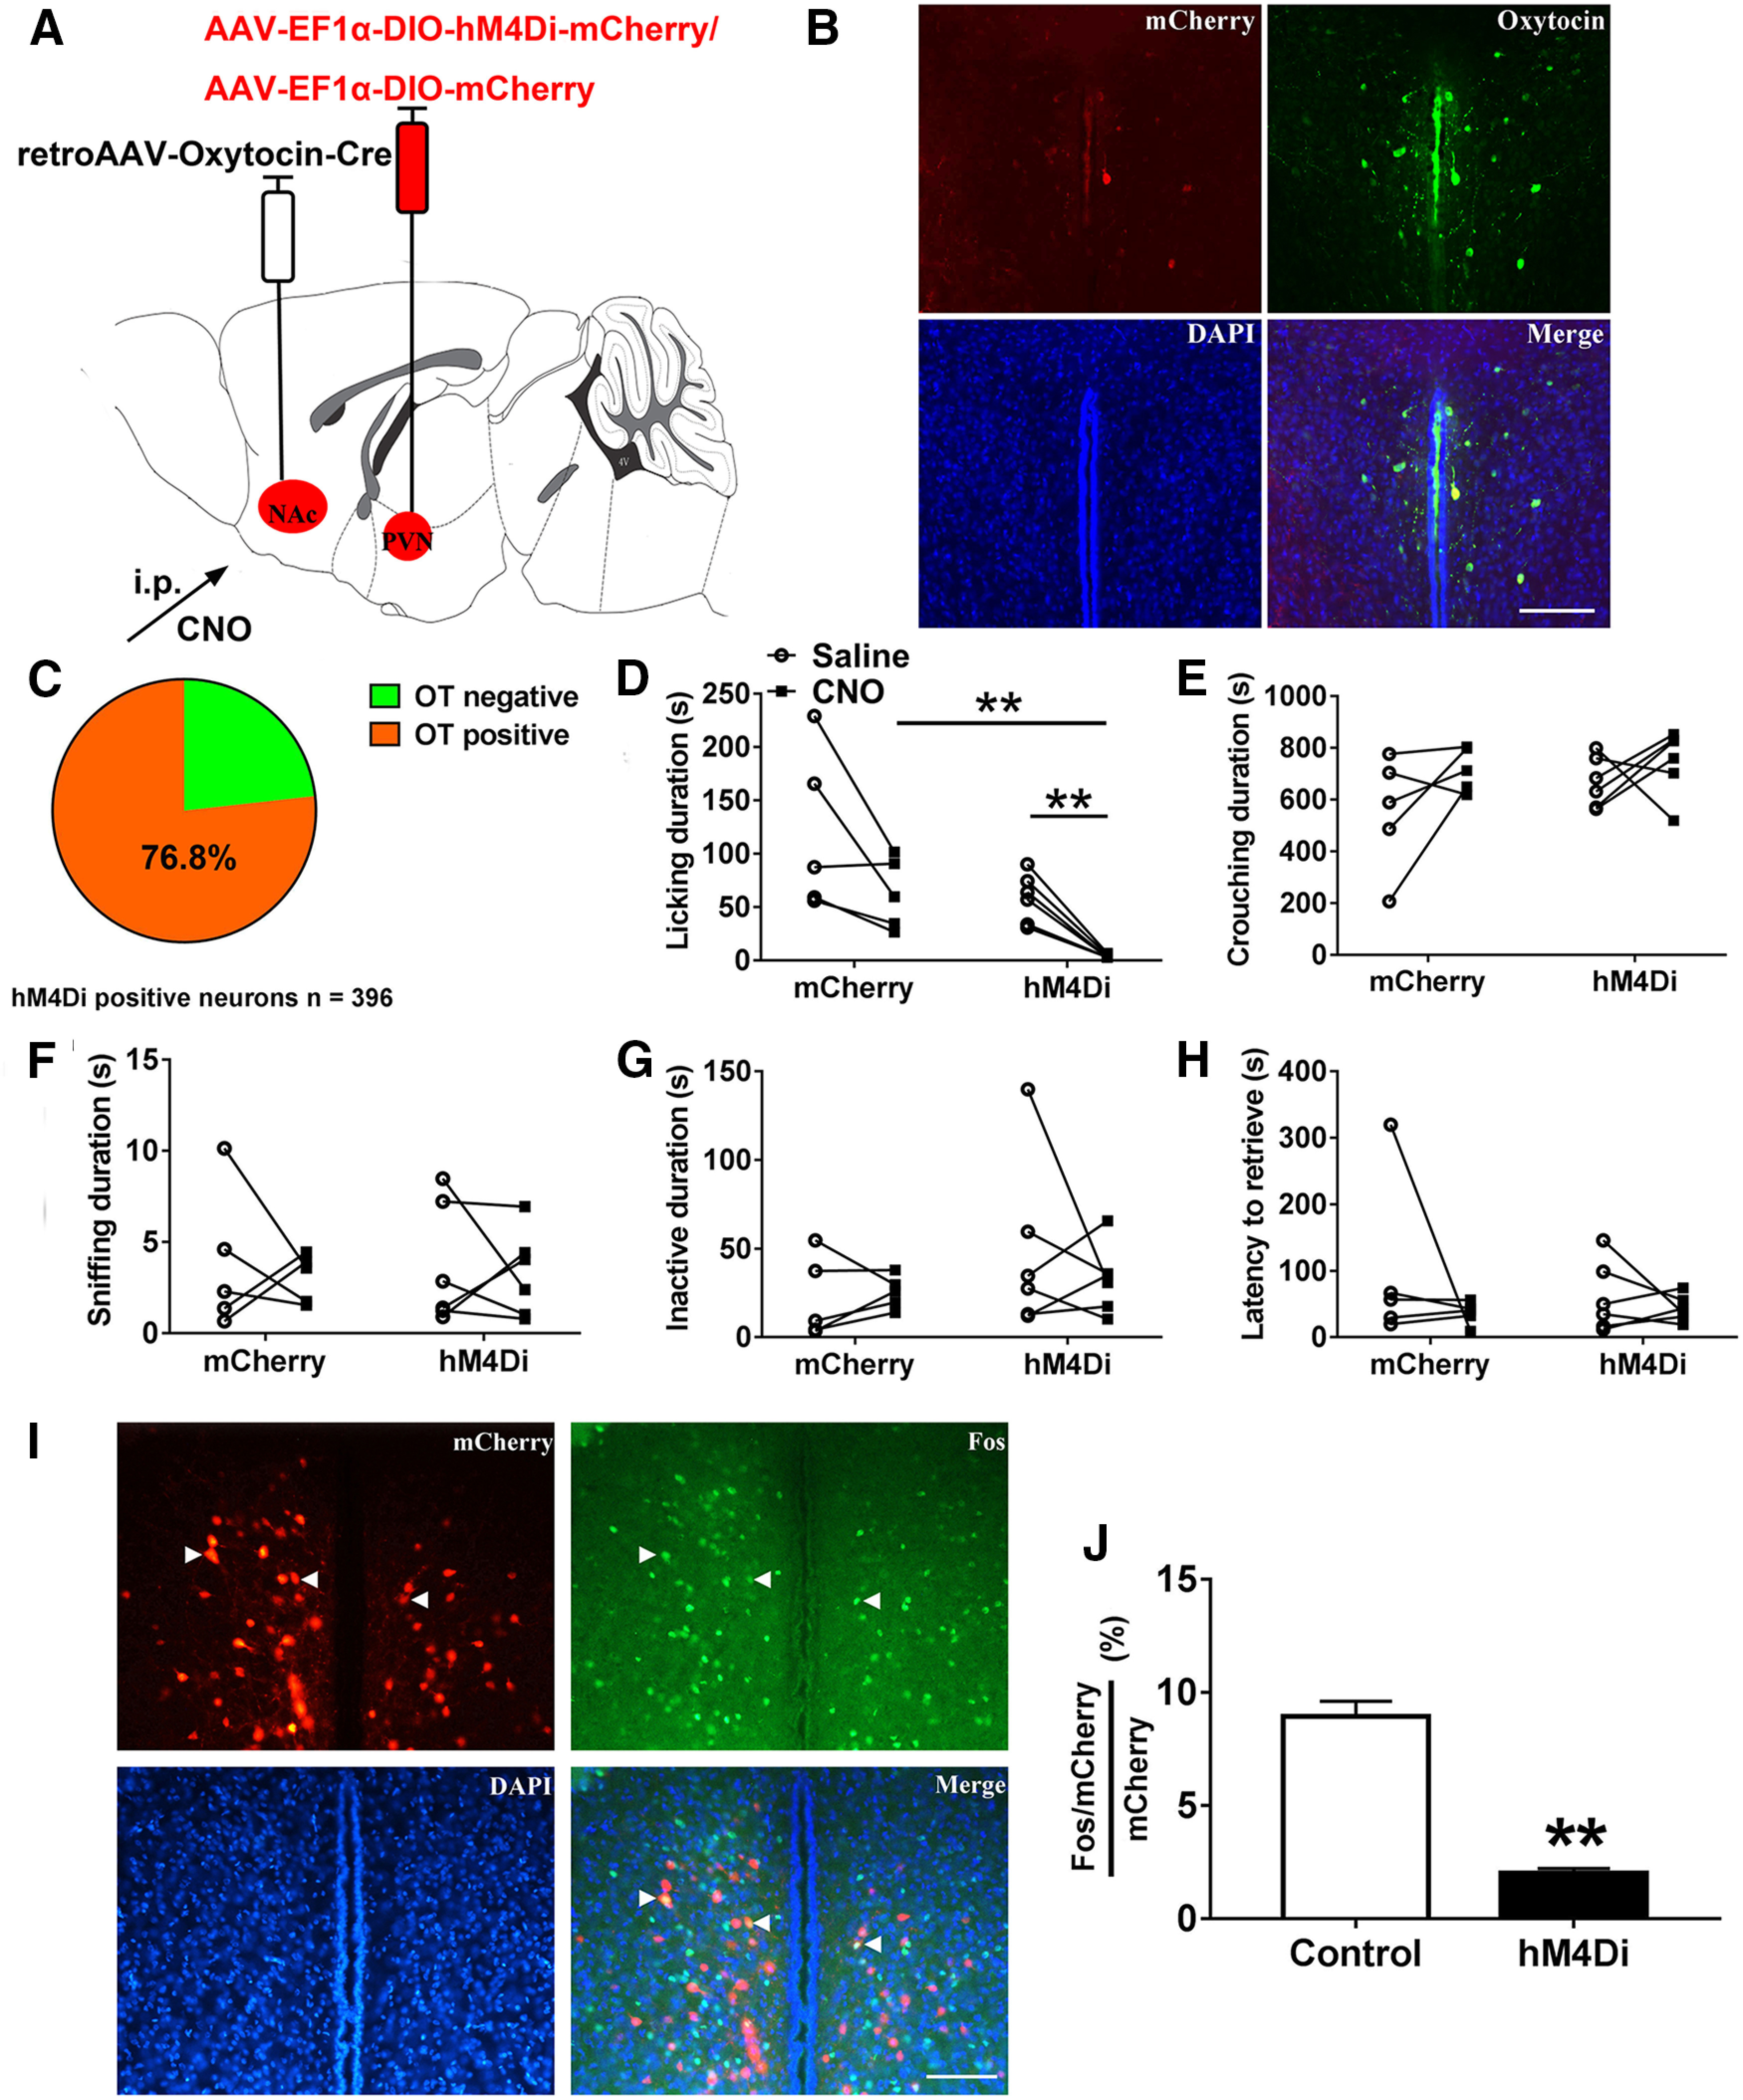
Paternal care plays a critical role in the development of brain and behaviors in offspring in monogamous species. However, the neurobiological mechanisms, especially the neuronal circuity, underlying paternal care is largely unknown. Using socially monogamous male mandarin voles (Microtus mandarinus) with high levels of paternal care, we found that paraventricular nucleus of the hypothalamus (PVN) to ventral tegmental area (VTA) or nucleus accumbens (NAc) oxytocin (OT) neurons are activated during paternal care. Chemogenetic activation/inhibition of the PVN OT projection to VTA promoted/decreased paternal care, respectively. Chemogenetic inhibition of the PVN to VTA OT pathway reduced dopamine (DA) release in the NAc of male mandarin voles during licking and grooming of pups as revealed by in vivo fiber photometry. Optogenetic activation/inhibition of the VTA to NAc DA pathway possibly enhanced/suppressed paternal behaviors, respectively. Furthermore, chemogenetic activation/inhibition of PVN to NAc OT circuit enhanced/inhibited paternal care. This finding is a first step toward delineating the neuronal circuity underlying paternal care and may have implications for treating abnormalities in paternal care associated with paternal postpartum depression or paternal abuse.SIGNIFICANCE STATEMENT Paternal behavior is essential for offspring survival and development in some mammalian species. However, the circuit mechanisms underlying the paternal brain are poorly understood. We show that manipulation of paraventricular nucleus of the hypothalamus (PVN) to ventral tegmental area (VTA) oxytocin (OT) projections as well as VTA to nucleus accumbens (NAc) DA projections promote paternal behaviors. Inhibition the PVN to VTA OT pathway reduces DA release in the NAc during pup licking and grooming. PVN to NAc OT circuit is also essential for paternal behaviors. Our findings identify two new neural circuits that modulate paternal behaviors.

Keywords: dopamine; nucleus accumbens; oxytocin; paraventricular nucleus of the hypothalamus; paternal behavior; ventral tegmental area.


Figures

Figure 1.
Figure 1.
Anatomically distinct OT neurons project from PVN to the NAc and VTA. A, Experimental schematics for determine collaterals between pairwise injected PVN OT projections. B, Histology of CTB488 injection sites in the NAc (left) and CTB647 injection sites in the VTA (right). Scale bar: 500 μm. TH, tyrosine hydroxylase; DAPI, 4',6-diamidine-2'-phenylindole dihydrochloride. C, An example with three-labeled PVN OT cells (red) is shown after injection of CTB-488 (green) into NAc and CTB-647 (violet) into VTA (indicated by arrowheads). Scale bar: 100 μm. D, Quantification of CTB + and overlapping neurons in all PVN OT population; n = 3.
Figure 2.
Figure 2.
Paternal behaviors and carrot consumption evoked activation of VTA projecting PVN OT neuron. A, Schematic of viral injection and optical fiber implantation above the PVN. B, Co-localization of immunoreactive GCaMP6m (green), OT (red), and DAPI (blue) and the optical fiber location in the PVN. Scale bar: 100 μm. C, Statistical chart showed that GCaMP6m was relatively restricted to OT-positive neurons (n = 2). D, Schematic diagrams showing the target of fiber tip placements in the PVN. E–L, Average △F/F during various paternal behaviors: (E) approaching, (F) sniffing, (G) retrieval, (H) grooming, (I) crouching, (J) selfgrooming, (K) sniff object, and (L) approaching/eating carrot. E'–L', Comparison of average calcium signal for –2–0 and 0–4 s after various paternal behaviors: (E') approaching (t(4) = −3.932, p = 0.017), (F') first sniffing (t(4) = −13.084, p < 0.001), (G') retrieval (t(4) = −2.905, p = 0.044), (H') grooming (t(4) = −3.332, p = 0.0290), (I') crouching (t(4) = 1.216, p = 0.291), (J') selfgrooming (t(3) = 1.220, p = 0.310), (K') sniff object (t(4) = −0.429, p = 0.690), and (L') approaching/eating carrot (t(4) = −3.358, p = 0.028); n = 4–5. Paired t test; *p < 0.05, **p < 0.01. Data are mean ± SEM.
Figure 3.
Figure 3.
Influences of chemogenetic activation/inhibition of the PVN to VTA OT circuit on paternal behaviors. A, Schematic of AAV injection. B, Confocal image depicting OT immunostaining (green), hM3Dq-mCherry/hM4Di-mCherry immunostaining (red), and DAPI (blue) in the PVN. Scale bar: 100 μm. C, Statistical chart showed that hM3Dq-mCherry (n = 2) or hM4Di-mCherry neurons (n = 2) were relatively restricted to OT-positive cells. D–H, Effects of chemogenetic activation (hM3Dq) or inhibition (hM4Di) of PVN OT neurons projecting to VTA on the duration of (D) licking/grooming (interaction: F(2,15) = 27.447, p < 0.001, post hoc test: mCherry saline vs CNO, p = 0.850; hM3Dq saline vs CNO, p < 0.001; hM4Di saline vs CNO, p = 0.035; saline mCherry vs hM3Dq, p = 0.866; saline mCherry vs hM4Di, p = 0.801; saline hM3Dq vs hM4Di, p = 0.370; CNO mCherry vs hM3Dq, p = 0.001; CNO mCherry vs hM4Di, p = 0.522; CNO hM3Dq vs hM4Di, p < 0.001), (E) crouching (interaction: F(2,15) = 0.152, p = 0.861; treatment: F(1,15) = 0.114, p = 0.740; group: F(2,15) = 1.480, p = 0.259), (F) sniffing pup (interaction: F(2,15) = 1.982, p = 0.172; treatment: F(1,15) = 0.077, p = 0.785; group: F(2,15) = 2.832, p = 0.091), (G) inactivity (interaction: F(2,15) = 0.276, p = 0.763; treatment: F(1,15) = 3.454, p = 0.083; group: F(2,15) = 1.836, p = 0.194), and (H) the latency to retrieve a pup (interaction: F(2,15) = 0.548, p = 0.590; treatment: F(1,15) = 4.969, p = 0.042, hM3Dq saline vs CNO, paired t test: t(5) = 3.390, p = 0.019; group: F(2,15) = 0.193, p = 0.827). Sample sizes are n = 6 for each group. Data were analyzed by two-way ANOVA with repeated measures; *p < 0.05, **p < 0.01. Data are mean ± SEM. I, Representative images of the PVN illustrating c-Fos in neurons expressing hM3Dq-mCherry. Scale bar: 100 μm. J, Percentage of mCherry+ neurons that were also Fos+ in the PVN after CNO injection (n = 3; F(2,6) = 87.264, p < 0.001, post hoc test: control vs hM3Dq, p < 0.001; control vs hM4Di, p = 0.041; hM3Dq vs hM4Di, p < 0.001). One-way ANOVA; *p < 0.05, **p < 0.01. Data are mean ± SEM.
Figure 4.
Figure 4.
Optogenetic activation of VTA-originating DA terminals in NAc increased licking and grooming of fathers for own pups. A, Schematic of viral strategy and optical fiber implantation above the NAc. B, Overlap of TH immunoreactivity (green), ChR2 expression (red), and DAPI (blue) in the VTA (up); schematic representations of the viral injection spread in the VTA (down). Scale bar: 100 μm. C, Statistical chart showed that ChR2-mCherry was relatively restricted to TH-positive cells (n = 2). D, Optical stimulation evoke action potentials of a ChR2-expressing neuron in the VTA. E, Confocal image showing axonal mCherry signal and the optical fiber track in the NAc. Scale bar: 100 μm. AC: anterior commissure. F–J, Effect of activating the VTA to NAc DA pathways on the total of time spent on (F) licking/grooming (interaction: F(1,10) = 5.459, p = 0.042, post hoc test: ChR2 off vs on, p = 0.001; mCherry off vs on, p = 0.250; light off ChR2 vs mCherry, p = 0.839; light on ChR2 vs mCherry, p = 0.098), (G) crouching (interaction: F(1,10) = 0.753, p = 0.406; treatment: F(1,10) = 0.001, p = 0.980; group: F(1,10) = 1.047, p = 0.330), (H) sniffing (interaction: F(1,10) = 0.216, p = 0.652); treatment: F(1,10) = 0.195, p = 0.668; group: F(1,10) = 1.487, p = 0.251), (I) inactivity (interaction: F(1,10) = 2.766, p = 0.127; treatment: F(1,10) = 0.439, p = 0.522; group: F(1,10) = 0.014, p = 0.907), and (J) the latency to retrieve a pup (interaction: F(1,10) = 0.008, p = 0.929; treatment: F(1,10) = 0.116, p = 0.741; group: F(1,10) = 2.567, p = 0.140). mCherry (n = 6), ChR2-mCherry (n = 6). Two-way ANOVA with repeated measures; **p < 0.01. Error bars indicate SEM.
Figure 5.
Figure 5.
Optogenetic inhibition of VTA to NAc DA pathways in NAc decreased paternal behaviors. A, Schematic of viral injection and optical fiber implantation above the NAc. B, Co-localization of TH immunoreactivity (green), eNpHR3.0 expression (red), and DAPI (blue) in the VTA (left); schematic representations of the viral injection spread in the VTA (right). Scale bar: 100 μm. C, Statistical chart showed that eNpHR3.0-mCherry was relatively restricted to TH-positive cells (n = 2). D, Trace showing the yellow light stimulation inhibits firing of a eNpHR3.0-expressing neuron in the VTA. E, Confocal images showing axonal mCherry signal and the optical fiber track in the NAc. Scale bar: 100 μm. AC: anterior commissure. F–J, Effect of inhibition of VTA to NAc DA pathways on the total of time spent (F) licking/grooming the pup (interaction: F(1,12) = 2.009, p = 0.182; treatment: F(1,12) = 5.271, p = 0.041, eNpHR3.0 off vs on, paired t test: t(7) = 3.333, p = 0.013; group: F(1,12) = 0.223, p = 0.645), (G) crouching (interaction: F(1,12) = 0.599, p = 0.454; treatment: F(1,12) = 0.878, p = 0.367; group: F(1,12) = 0.525, p = 0.482), (H) sniffing the pup (interaction: F(1,12) = 0.009, p = 0.925; treatment: F(1,12) = 4.499, p = 0.055; group: F(1,12) = 0.293, p = 0.598), (I) inactivity (interaction: F(1,10) = 0.868, p = 0.370; treatment: F(1,10) = 2.727, p = 0.125; group: F(1,12) = 0.302, p = 0.593), and (J) the latency to retrieve a pup (interaction: F(1,12) = 0.408, p = 0.535; treatment: F(1,12) = 7.205, p = 0.020, eNpHR3.0 off vs on, paired t test: t(7) = −2.488, p = 0.042; group: F(1,12) < 0.01, p = 0.995; I). mCherry (n = 6), eNpHR3.0-mCherry (n = 8). Two-way ANOVA with repeated measures; *p < 0.05. Error bars indicate SEM.
Figure 6.
Figure 6.
Chemogenetic activation/inhibition of PVN-NAc projections influenced DA release in the NAc simultaneously on paternal behaviors. A, Experimental design. B, dLight1.1 expression and fiber tips location in the NAc (left), schematic representations of the viral injection spread in the NAc (right). Scale bar: 1 mm. C1–E8, Representative traces showing DA signal changes aligned to onsets of various paternal behaviors (C1–C5, D1–D5, E1–E5), selfgrooming (C6, D6, E6), sniff object (C7, D7, E7), or approach/eating carrot (C8, D8, E8). 1 = approach, 2 = first sniff own pups, 3 = retrieval, 4 = licking, 5 = crouching, 6 = selfgrooming, 7 = sniff object, 8 = carrot. C1'–E8', Mean △F/F during approaching (mCherry: t(3) = −1.548, p = 0.219; Gq: t(6) = 0.430, p = 0.682; Gi: t(4) = −0.099, p = 0.926; C1', D1', E1'), first sniff own pups (mCherry: t(3) = 0.012, p = 0.991; Gq: t(6) = 1.096, p = 0.315; Gi: t(4) = −0.593, p = 0.585; C2', D2', E2'), retrieval (mCherry: t(3) = 0.095, p = 0.931; Gq: t(6) = 0.861, p = 0.422; Gi: t(4) = −0.076, p = 0.943; C3', D3', E3'), licking (mCherry: t(3) = −1.122, p = 0.344; Gq: t(6) = −1.179, p = 0.283; Gi: t(4) = 4.341, p = 0.012; C4', D4', E4'), crouching (mCherry: t(3) = −0.702, p = 0.533; Gq: t(6) = 0.155, p = 0.882; Gi: t(4) = 2.619, p = 0.059; C5', D5', E5'), selfgrooming (mCherry: t(2) = −0.661, p = 0.577; Gq: t(4) = 0.234, p = 0.826; Gi: t(3) =1.758, p = 1.777; C6', D6', E6'), sniff object (mCherry: t(3) = −1774, p = 0.174; Gq: t(6) = 0.353, p = 0.736; Gi: t(4) = −1.946, p = 0.124; C7', D7', E7'), or approach/eating carrot (mCherry: t(3) = 1.814, p = 0.167; Gq: t(6) = −0.572, p = 0.588; Gi: t(4) = 2.841, p = 0.047; C8', D8', E8') shown in all fathers. C9, C10, D9, D10, E9, E10, Tuning matrix for DA release (baseline vs signals) in mCherry (C9, C10), Gq-mCherry (D9, D10), and Gi-mCherry (E9, E10) groups, these DA changes are relative to the. mCherry: n = 3–4; Gq-mCherry: n = 5–7; Gi-mCherry: n = 4–5. Paired t test; *p < 0.05. Error bars indicate SEM.
Figure 7.
Figure 7.
In vivo recording of PVN –NAc OT neurons on paternal behaviors. A, Schematic of viral injection and optical fiber implantation above the PVN. B, Co-localization of immunoreactive GCaMP6m (green), OT (red), and DAPI (blue) and the optical fiber location in the PVN. Scale bar: 100 μm. C, Statistical chart showed that GCaMP6m was relatively restricted to OT-positive neurons (n = 2). D, Schematic diagrams showing the target of fiber tip placements in the PVN. E–L, Average △F/F during various paternal behaviors: (E) approaching, (F) first sniffing pups, (G) retrieval, (H) licking, (I) crouching, (J) selfgrooming, (K) sniff object, and (L) approach/eating carrot. E'–L', Comparison of average calcium signal for 2 s before and 4 s after various paternal behaviors: (E') approaching (t(4) = −3.921, p = 0.017), (F') first sniffing pups (t(4) = −3.269, p = 0.031), (G') retrieval (t(3) = −3.486, p = 0.040), (H') licking (t(4) = −5.489, p = 0.005), (I') crouching (t(4) = 0.893, p = 0.422), (J') selfgrooming (t(2) = 0.012, p = 0.992), (K') sniffing object (t(4) = −1.680, p = 0.168), and (L') approach/eating carrot (t(4) = 0.017, p = 0.987); n = 3–5. Paired t test; *p < 0.05, **p < 0.01. Data are mean ± SEM.
Figure 8.
Figure 8.
Chemogenetic activation of the PVN to NAc OT circuit promoted paternal behaviors. A, Viral strategy. B, Co-localization of hM3Dq expression (red), OT immunoreactivity (green), and DAPI (blue) in the PVN. Scale bar: 100 μm. C, Statistical chart showed that hM3Dq-mCherry was relatively restricted to OT-positive cells (n = 2). D–H, Effect of activation of PVN to NAc OT pathways on the duration of (D) Licking/grooming (interaction: F(1,10) = 5.103, p = 0.047, post hoc test: hM3Dq saline vs CNO, p = 0.006; mCherry saline vs CNO, p = 0.820; saline mCherry vs hM3Dq, p = 0.172; CNO mCherry vs hM3Dq, p = 0.156), (E) crouching over pups (interaction: F(1,10) = 1.016, p = 0.337; treatment: F(1,10) = 4.767, p = 0.054; group: F(1,10) = 4.452, p = 0.061), (F) sniffing pups (interaction: F(1,10) = 1.735, p = 0.217; treatment: F(1,10) = 0.129, p = 0.727; group: F(1,10) = 1.994, p = 0.193), (G) inactivity (interaction: F(1,10) = 0, p = 1; treatment: F(1,10) = 3.295, p = 0.100; group: F(1,10) = 1.346, p = 0.273), and (H) the latency to retrieve a pup (interaction: F(1,10) = 0.443, p = 0.521; treatment: F(1,10) = 10.905, p < 0.01, hM3Dq saline vs CNO paired t test: t(5) = 3.003, p = 0.030; group: F(1,10) = 1.007, p = 0.324). mCherry (n = 6), hM3Dq-mCherry (n = 6). Two-way ANOVA with repeated measures; *p < 0.05, **p < 0.01. I, Representative images of the PVN illustrating c-Fos in neurons expressing hM3Dq-mCherry. Scale bar: 100 μm. J, Percentage of mCherry neurons in the PVN that are Fos+ after CNO administration (t(4) = −5.400, p = 0.006; n = 3). Independent t test; **p < 0.01. Data are mean ± SEM.
Figure 9.
Figure 9.
Chemogenetic inhibition of the PVN to NAc OT pathways suppresses paternal behaviors. A, Viral strategy. B, Co-localization of hM4Di expression (red), OT immunoreactivity (green), and DAPI (blue) in the PVN. Scale bar: 100 μm. C, Statistical chart showed that hM4Di-mCherry was relatively restricted to OT-positive cells (n = 2). D–H, Effect of inhibition of PVN to NAc OT pathways on the duration of (D) licking/grooming (interaction: F(1,9) = 0.011, p = 0.920; treatment: F(1,9) = 19.826, p = 0.002, t(5) = 6.087, p = 0.002; group: F(1,9) = 7.903, p = 0.020, t(9) = 4.366, p = 0.017), (E) crouching (interaction: F(1,9) = 0.431, p = 0.528; treatment: F(1,9) = 3.697, p = 0.087; group: F(1,9) = 1.719, p = 0.222), (F) sniffing pups (interaction: F(1,9) = 0.024, p = 0.881; treatment: F(1,9) = 0.270, p = 0.616; group: F(1,9) = 0.001, p = 0.973), (G) inactivity (interaction: F(1,9) = 0.616, p = 0.453; treatment: F(1,9) = 0.238, p = 0.637; group: F(1,9) = 1.510, p = 0.250), and (H) the latency to retrieve a pup (interaction: F(1,9) = 0.567, p = 0.471; treatment: F(1,9) = 1.640, p = 0.232; group: F(1,9) = 0.369, p = 0.559). mCherry (n = 5), hM4Di-mCherry (n = 6). Two-way ANOVA with for repeated measures; **p < 0.01. Data are mean ± SEM. I, Representative images of the PVN illustrating Fos in neurons expressing mCherry. Scale bar: 100 μm. J, Percentage mCherry neurons in the PVN expressing Fos after CNO injection (t(4) = 9.926, p = 0.001; n = 3). Independent t test; **p < 0.01. Data are mean ± SEM.

References

    1. Ahern TH, Young LJ (2009) The impact of early life family structure on adult social attachment, alloparental behavior, and the neuropeptide systems regulating affiliative behaviors in the monogamous prairie vole (Microtus ochrogaster). Front Behav Neurosci 3:17. - PMC - PubMed
    1. Ahern TH, Hammock EA, Young LJ (2011) Parental division of labor, coordination, and the effects of family structure on parenting in monogamous prairie voles (Microtus ochrogaster). Dev Psychobiol 53:118–131. 10.1002/dev.20498 - DOI - PMC - PubMed
    1. Bartz JA (2016) Oxytocin and the pharmacological dissection of affiliation. Curr Dir Psychol Sci 25:104–110. 10.1177/0963721415626678 - DOI
    1. Bhatti P, Delaney T, Poulin M, Hahn-Holbrook J (2019) Oxytocin receptor gene (OXTR) and father support interact to predict depressive symptoms postpartum. Biol Psychol 147:107686. 10.1016/j.biopsycho.2019.03.015 - DOI - PubMed
    1. Boender AJ, Young LJ (2020) Oxytocin, vasopressin and social behavior in the age of genome editing: a comparative perspective. Horm Behav 124:104780. 10.1016/j.yhbeh.2020.104780 - DOI - PMC - PubMed

Publication types

LinkOut - more resources