. 2021 Jul 5;12(1):4117.
doi: 10.1038/s41467-021-24360-w.

Monocyte-driven atypical cytokine storm and aberrant neutrophil activation as key mediators of COVID-19 disease severity

Affiliations

Monocyte-driven atypical cytokine storm and aberrant neutrophil activation as key mediators of COVID-19 disease severity

L Vanderbeke et al. Nat Commun. .

Abstract

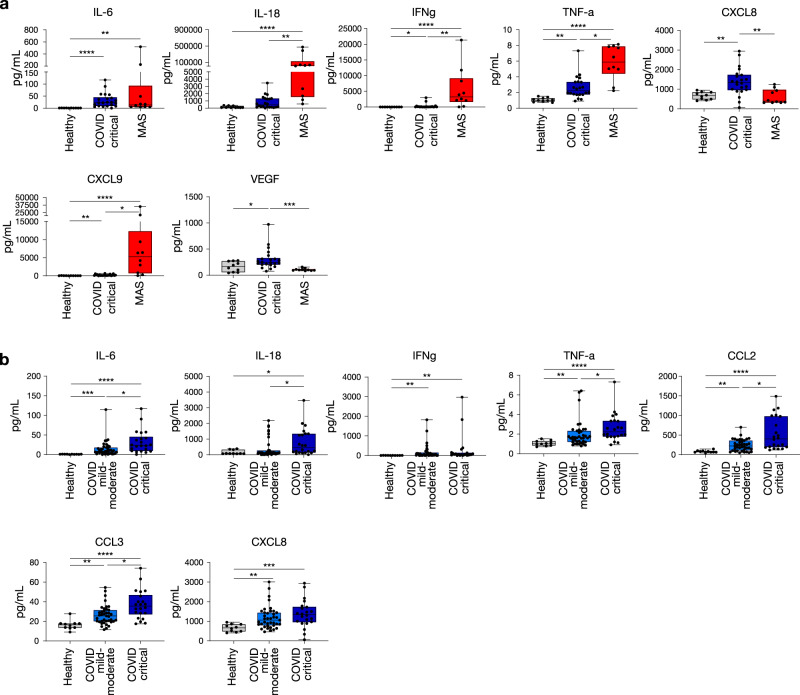
Epidemiological and clinical reports indicate that SARS-CoV-2 virulence hinges upon the triggering of an aberrant host immune response, more so than on direct virus-induced cellular damage. To elucidate the immunopathology underlying COVID-19 severity, we perform cytokine and multiplex immune profiling in COVID-19 patients. We show that hypercytokinemia in COVID-19 differs from the interferon-gamma-driven cytokine storm in macrophage activation syndrome, and is more pronounced in critical versus mild-moderate COVID-19. Systems modelling of cytokine levels paired with deep-immune profiling shows that classical monocytes drive this hyper-inflammatory phenotype and that a reduction in T-lymphocytes correlates with disease severity, with CD8+ cells being disproportionately affected. Antigen presenting machinery expression is also reduced in critical disease. Furthermore, we report that neutrophils contribute to disease severity and local tissue damage by amplification of hypercytokinemia and the formation of neutrophil extracellular traps. Together our findings suggest a myeloid-driven immunopathology, in which hyperactivated neutrophils and an ineffective adaptive immune system act as mediators of COVID-19 disease severity.


Conflict of interest statement

The authors declare no competing interests.

Figures

Fig. 1
Fig. 1. Hypercytokinemia in COVID-19 as a distinct cytokine release syndrome.
Comparison of plasma levels of selected cytokines and chemokines from healthy controls (HC, n = 10), COVID-19 critical condition (CCC, n = 22) and MAS patients (n = 10) (a) and COVID-19 subgroups (for mild-moderate (CMM), n = 39; for critical (CCC), n = 22) versus healthy controls (n = 10) (b). Plasma concentrations were measured by MSD (Meso Scale Discovery). Boxplot representation (centre line, mean; box limits, upper and lower quartiles; whiskers, range; points, data points per patient). A two-sided Kruskal–Wallis test with Dunn’s correction for multiple comparisons was used; IL-6: p < 0.0001 HC vs CCC, p = 0.003 HC vs MAS; IL-18: p < 0.0001 HC vs MAS, p = 0.005 CCC vs MAS; IFNg: p = 0.014 HC vs CCC, p < 0.0001 HC vs MAS, p = 0.008 CCC vs MAS; TNF-a: p = 0.004 HC vs CCC, p < 0.0001 HC vs MAS, p = 0.015 CCC vs MAS; CXCL8: p = 0.008 HC vs CCC, p = 0.002 CCC vs MAS; CXCL9: p = 0.007 HC vs CCC, p < 0.0001 HC vs MAS, p = 0.014 CCC vs MAS; VEGF: p = 0.049 HC vs CCC, p = 0.0004 CCC vs MAS (a) and IL-6: p = 0.0009 HC vs CMM, p < 0.0001 HC vs CCC, p = 0.014 CMM vs CCC; IL-18: p = 0.019 HC vs CCC, p = 0.024 CMM vs CCC; IFNg: p = 0.004 HC vs CMM, p = 0.003 HC vs CCC; TNF-a: p = 0.009 HC vs CMM, p < 0.0001 HC vs CCC, p = 0.038 CMM vs CCC; CCL2: p = 0.003 HC vs CMM, p < 0.0001 HC vs CCC, p = 0.026 CMM vs CCC; CCL3: p = 0.006 HC vs CMM, p < 0.0001 HC vs CCC, p = 0.016 CMM vs CCC; CXCL8: p = 0.007 HC vs CMM, p = 0.0005 HC vs CCC (b). Significance is shown as *p < 0.05; **p < 0.01; ***p < 0.001 and ****p < 0.0001. MAS = macrophage activation syndrome. See Figs. S1 and S2 for additional cytokine results. Source data are provided as a Source data file.
Fig. 2
Fig. 2. Peripheral blood immunophenotyping.
a Heatmap representation of immune cell subset changes between healthy controls (n = 8), COVID-19 mild-moderate (n = 32) and critical (n = 14) condition based on mass cytometry measurements on whole blood; representation shows relative fold change compared to healthy per cell subset. A two-sided Wilcoxon rank-sum test with Benjamini–Hochberg correction for multiple group comparisons was used. b scRNA-seq data of COVID-19 PBMCs: UMAP plot of 83,524 single cells, colour-coded per cell type. c Violin plots of expression level of key cytokine/chemokine/chemokine receptor coding genes in the cell types identified in PBMCs from COVID-19 patients, as shown in (b). d CD4+/CD8+ ratios in healthy controls (HC, n = 6), mild-moderate (CMM, n = 13) and critical (CCC, n = 10) COVID-19 cases, based on scRNA-seq. Healthy control data were derived from a publicly available dataset (GSE150728). Boxplot representation (centre line, mean; box limits, upper and lower quartiles; whiskers, range; points, data points per patient). A two-sided Wilcoxon rank-sum test with Benjamini–Hochberg correction for multiple group comparisons was used. p = 0.002 HC vs CMM, p = 0.011 HC vs CCC. Significance is shown as *p < 0.05; **p < 0.01. See Figs. S4 and S5 for further supporting data. Source data are provided as a Source data file.
Fig. 3
Fig. 3. Reduced MHC class II on antigen-presenting cells marks critical COVID-19.
a Heatmap of differential monocyte clusters between healthy (n = 8), mild-moderate (n = 32) and critical (n = 14) COVID-19 groups based on mass cytometry measurements on whole blood. Rows indicate monocyte subclusters. Columns indicate patient groups (left) and cell surface markers (right). A two-sided Wilcoxon rank-sum test with Benjamini–Hochberg correction for multiple group comparisons was used. b HLA-DR expression on CD14hi monocytes in healthy (HC, n = 6; mean 95,72%), mild-moderate (CMM, n = 21; mean 84,14%) and critical (CCC, n = 20; mean 70,97%) groups based on flow cytometric analyses of PBMCs. Boxplot representation (centre line, mean; box limits, upper and lower quartiles; whiskers, range; points, data points per patient). A two-sided Wilcoxon rank-sum test with Benjamini–Hochberg correction for multiple group comparisons was used; p = 0.0014 HC vs CCC, p = 0.046 CMM vs CCC. c Gene set enrichment analysis of HLA-DR complex coding genes in professional antigen-presenting cells, comparing scRNA-seq data from mild-moderate (n = 13) and critical (n = 10) COVID-19 cases. Boxplot representation (centre line, mean; box limits, upper and lower quartiles; whiskers, range; points, data points per patient). A two-sided Wilcoxon rank-sum test was used, p = 0.0303 for dendritic cells (DC). d Expression of HLA-DR on myeloid DC based on mass cytometry measurements (mild-moderate n = 32, critical n = 14). Boxplot representation (centre line, mean; box limits, upper and lower quartiles; whiskers, range; points, data points per patient). A two-sided Wilcoxon rank-sum test was used, p = 0.0098. e Heatmap of genes coding for co-stimulatory molecules involved in MHC class II-restricted antigen presentation by dendritic cells, comparing mild-moderate versus critical COVID-19. Individual dots in boxplots represent data points per patient. Source data are provided as a Source data file. Statistical significance is shown as *p < 0.05; **p < 0.01.
Fig. 4
Fig. 4. Disturbed immune regulation in severe COVID-19.
Pearson correlation-driven similarity/correlation matrix analysis of cytokines/chemokines and mass cytometry data in critical (n = 14) (a) and mild-moderate (n = 31) (b) COVID-19 patient subgroups. This correlation matrix analysis is a form of statistical modelling by which statistically stable relationships between the different variables (i.e. cytokines/chemokines and immune cell subpopulations) allows their categorization into different clusters indicating high levels of correlation (indicated by the clustering dendrograms). Of note, the diagonal correlation value is 1, which denotes the highest possible statistically significant correlation value between the given variables and represents the highest comparative threshold that “centers” the correlation network. See also Fig. S3. Source data are provided as a Source data file.
Fig. 5
Fig. 5. Contribution of neutrophils to COVID-19 immunopathology at a local level: scRNA-seq data of COVID-19 BAL fluid.
UMAP plot of 26,605 single cells (from 11 patients, n = 6 for COVID-19, n = 5 for non-COVID pneumonia), colour-coded per cell type (a) and UMAP showing active and resting neutrophil subclusters (b) present in the bronchoalveolar lavage fluid of COVID-19 and non-COVID pneumonia patients. c Feature plots of key differentially expressed genes, with IL1B, CXCL8 and S100A12 being upregulated in the active neutrophil population. d Boxplots showing a significant abundance of active neutrophils in COVID-19 pneumonitis, as compared to non-COVID pneumonia. Boxplot representation (centre line, mean; box limits, upper and lower quartiles; whiskers, range; points, data points per patient). A two-sided Wilcoxon rank-sum test was used, p = 0.009 active neutrophils COVID vs Non-COVID pneumonia. e Relative immune cell type abundance in bronchoalveolar lavage fluid of COVID-19, compared to non-COVID pneumonia. Boxplot representation (centre line, mean; box limits, upper and lower quartiles; whiskers, range; points, data points per patient). A two-sided Wilcoxon rank-sum test was used, p = 0.017 neutrophils COVID vs non-Covid pneumonia. Source data are provided as a Source data file. Significance is shown as *p < 0.05; **p < 0.01. See also Fig. S8.

References

    1. WHO. Coronavirus Disease (COVID-2019) Situation Reports (2021).
    1. Huang C, et al. Clinical features of patients infected with 2019 novel coronavirus in Wuhan, China. Lancet. 2020;395:497–506. doi: 10.1016/S0140-6736(20)30183-5. - DOI - PMC - PubMed
    1. Blanco-Melo D, et al. Imbalanced host response to SARS-CoV-2 drives development of COVID-19. Cell. 2020;181:1036–1045. doi: 10.1016/j.cell.2020.04.026. - DOI - PMC - PubMed
    1. Zhang, D. et al. Frontline Science: COVID-19 infection induces readily detectable morphologic and inflammation-related phenotypic changes in peripheral blood monocytes. J Leukoc Biol 109, 13–22 (2021). - PMC - PubMed
    1. Giamarellos-Bourboulis EJ, et al. Complex immune dysregulation in COVID-19 patients with severe respiratory failure. Cell Host Microbe. 2020;27:992–1000. doi: 10.1016/j.chom.2020.04.009. - DOI - PMC - PubMed

Publication types

MeSH terms

Substances