. 2021 Jul 5;12(1):4132.
doi: 10.1038/s41467-021-23889-0.

A synthetic circuit for buffering gene dosage variation between individual mammalian cells

Affiliations

A synthetic circuit for buffering gene dosage variation between individual mammalian cells

Jin Yang et al. Nat Commun. .

Abstract

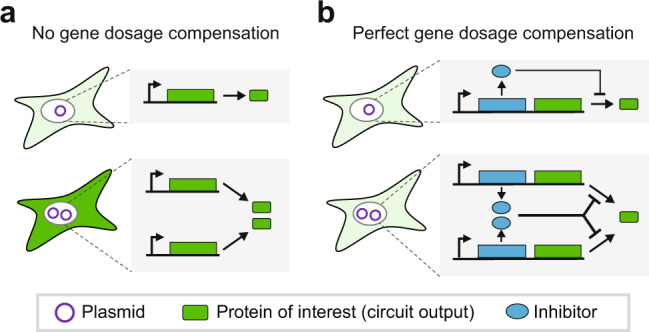
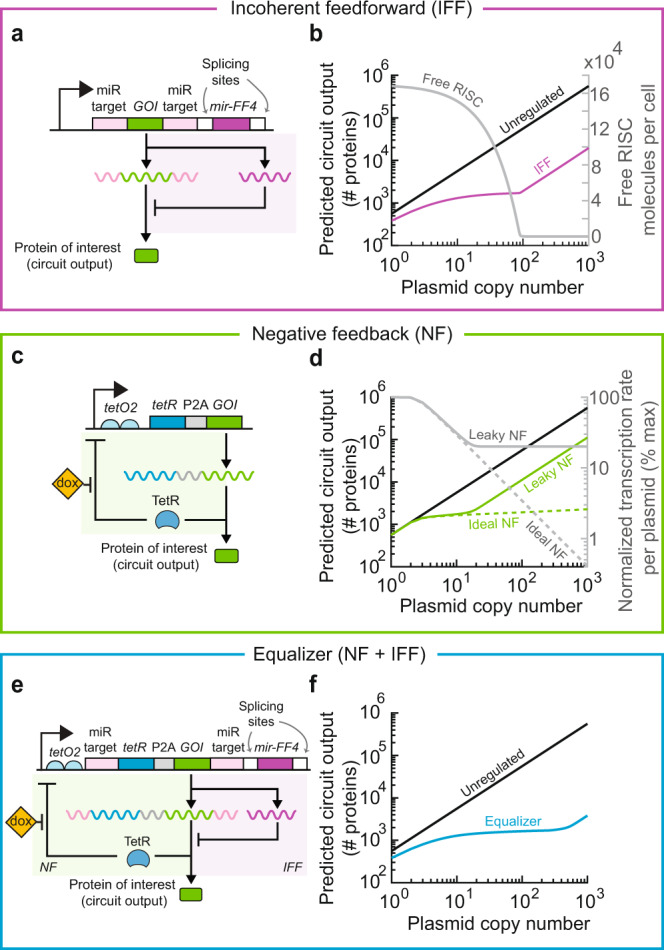
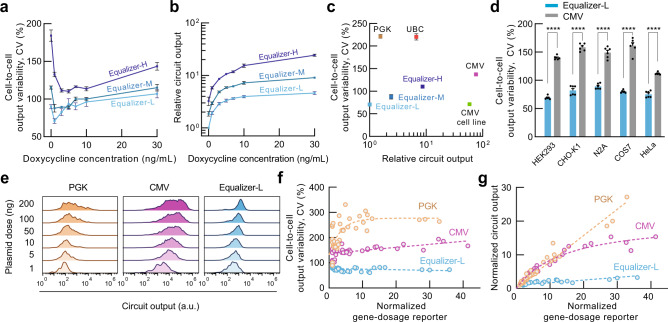
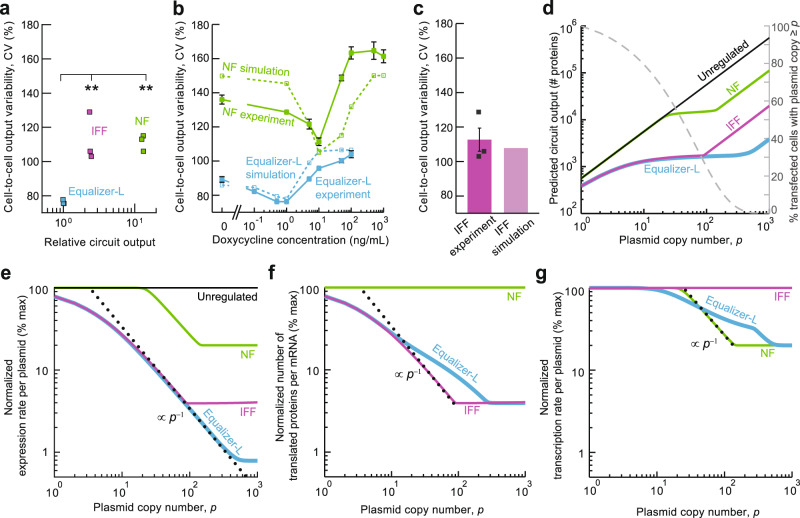
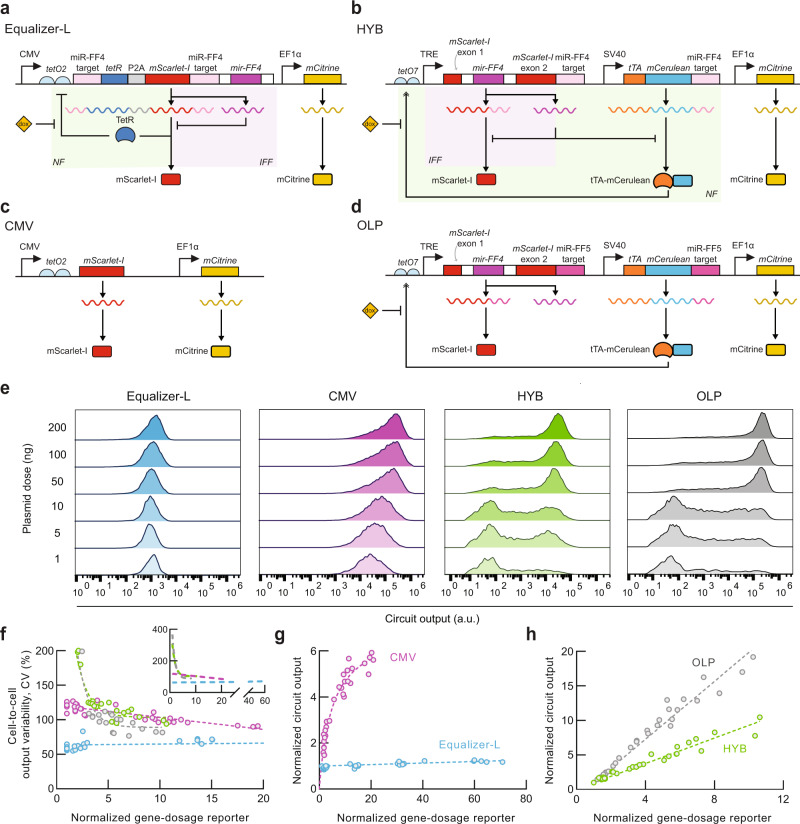
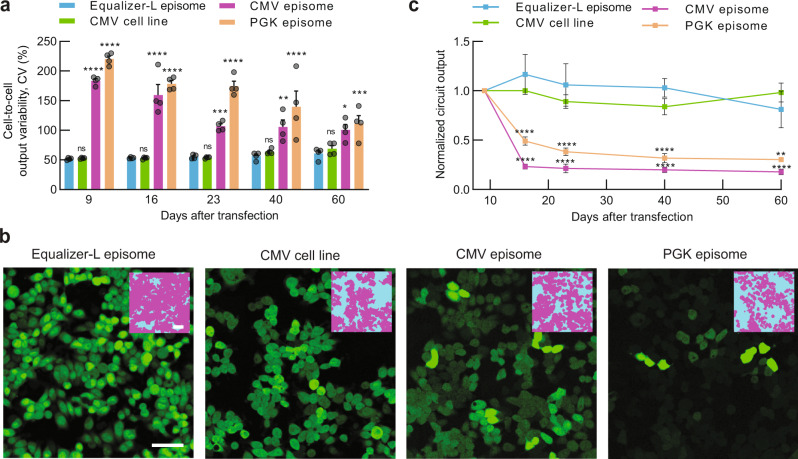
Precise control of gene expression is critical for biological research and biotechnology. However, transient plasmid transfections in mammalian cells produce a wide distribution of copy numbers per cell, and consequently, high expression heterogeneity. Here, we report plasmid-based synthetic circuits - Equalizers - that buffer copy-number variation at the single-cell level. Equalizers couple a transcriptional negative feedback loop with post-transcriptional incoherent feedforward control. Computational modeling suggests that the combination of these two topologies enables Equalizers to operate over a wide range of plasmid copy numbers. We demonstrate experimentally that Equalizers outperform other gene dosage compensation topologies and produce as low cell-to-cell variation as chromosomally integrated genes. We also show that episome-encoded Equalizers enable the rapid generation of extrachromosomal cell lines with stable and uniform expression. Overall, Equalizers are simple and versatile devices for homogeneous gene expression and can facilitate the engineering of synthetic circuits that function reliably in every cell.


Conflict of interest statement

The authors declare the following competing interests: on May 12, 2021, Baylor College of Medicine and William Marsch Rice University filed a provisional patent application (#63187704) based on this work. F.S.-P., J.Y., and O.A.I. are the inventors, and all authors are contributors. The application covers most of the work described in the manuscript, including systems, compositions, and methods for regulating gene expression, including in a manner that allows for enhanced control of copy-number variation at both the population and single-cell levels compared with known systems.

Figures

Fig. 1
Fig. 1. Gene expression from ideal dosage compensation circuits does not vary with plasmid copy number.
a Expression from promoters with no control circuitry (i.e. open-loop circuits) is proportional to the plasmid copy number. b An ideal dosage compensation system uses control mechanisms to tune the per-copy expression rate, thereby maintaining constant expression regardless of copy number.
Fig. 2
Fig. 2. Combining incoherent feedforward (IFF) and negative feedback (NF) loops is predicted to widen the copy number range with efficient dosage compensation.
a Schematic of the miRNA-based post-transcriptional IFF circuit. b The depletion of free RISC (gray trace) at high plasmid copy numbers abolishes dosage compensation by the IFF circuit (purple trace). c Schematic of the transcriptional NF circuit. d Incomplete repression by TetR results in a higher baseline transcription rate per plasmid (solid gray trace) that narrows the compensation range (leaky vs. ideal NF). Simulations were run with a doxycycline concentration that resulted in a wide compensation range of the NF circuit (1 ng/mL for both the ideal and leaky NF loops; see Supplementary Fig. 2). e Schematic of the Equalizer circuit, which combines transcriptional NF (green shaded area) with post-transcriptional IFF (purple shaded area). f Equalizer has the potential for compensating for a wider range of plasmid copy numbers than NF and IFF circuits alone. Simulated doxycycline concentration, 1 ng/mL.
Fig. 3
Fig. 3. Equalizers demonstrate robust gene dosage compensation at the single-cell and population levels.
Circuit output variability (a) and relative mean circuit output levels (b) of HEK293 cells transfected with the Equalizer plasmids and cultured under different inducer concentrations. Output levels are relative to that of uninduced Equalizer-L. Mean values ± SEM are shown. n = 8 (Equalizer-L) or 3 (-M/-H) independent transfections. Here and for c, d, 100 ng of circuit plasmids were used per transfection. c Equalizer plasmids produced lower cell-to-cell expression variability than plasmids with unregulated promoters. p < 0.01 for all pairs in Tukey’s multiple comparison tests. Cells transfected with Equalizer-L produced similar variability as cells with a chromosomally integrated unregulated CMV cassette (CMV cell line); p > 0.99, Tukey’s multiple comparison test. Circuit output values were relative to that of Equalizer-L. Mean ± SEM are shown; some error bars are too small to be seen. n = 3 (unregulated circuits and Equalizer-M & -H) or 8 (Equalizer-L) independent transfections. n = 3 independent cell cultures (CMV cell line). Equalizer-L was induced with 1 ng/mL of doxycycline. d Equalizer-L produced lower cell-to-cell variability than the CMV promoter in five cell lines. The black circles are independent transfections. Equalizer-L was induced with 1 ng/mL of doxycycline. Mean ± SEM are shown; some error bars are too small to be seen. n = 6 independent transfections per circuit. ****p < 0.0001; Sidak’s multiple comparison test. e Representative output-level histograms. Each histogram was normalized to its peak. For eg, Equalizer-L was induced with 1 ng/mL of doxycycline. f Equalizer-L produced lower cell-to-cell variability than unregulated promoters at different gene dosage levels. The circles represent independent transfections. n = 36 per circuit (6 per dose and 6 doses per circuit). The dashed lines indicate trend lines (linear for Equalizer-L and CMV; exponential for PGK). The gene-dosage reporter values were normalized to those obtained when transfecting 1 ng of plasmid. g The mean Equalizer-L output is robust to increases in gene dosage. The gene-dosage and circuit output values were normalized to those obtained when transfecting 1 ng of plasmid. The circles and sample sizes are as in (f). The dashed lines indicate trend lines (linear for Equalizer-L and PGK, hyperbolic for CMV). Source data are provided as a Source Data file.
Fig. 4
Fig. 4. Equalizer-L combines NF and IFF circuitry to increase the range of gene dosage compensation.
a Equalizer-L produced lower cell-to-cell variability than either NF or IFF circuits alone. In this experiment and in simulations (d–g), doxycycline was used at the concentration producing the lowest cell-to-cell variability for each circuit (Equalizer-L, 1 ng/mL; NF, 10 ng/mL). **p < 0.01 (Tukey’s multiple comparison test). Square markers indicate n = 3 independent transfections. Simulation results closely matched the experimentally determined cell-to-cell output variability of the NF (b) and IFF (c) circuits. For b, the filled markers indicate the mean of n = 3 independent transfections per construct. For c, the square markers indicate independent transfections. The error bars are the SEM. Each simulation datapoint (open markers) was computed from 10,000 cells whose plasmid copy number was sampled from the estimated plasmid copy number distribution. See Supplementary Notes 1, 3, and 5 for simulation models and methods. d Deterministic simulations predicted that Equalizer-L has a wider compensation range than standalone NF and IFF circuits. The dashed gray curve (right axis) illustrates the estimated plasmid copy number distribution. Simulated overall expression rate (e), number of proteins translated per mRNA (f), and transcription rate per plasmid (g) for each topology. The dotted lines indicate the slopes corresponding to perfect dosage compensation. Source data are provided as a Source Data file.
Fig. 5
Fig. 5. Equalizer-L has superior gene dosage compensation than an alternative circuit that combines post-transcriptional NF and IFF motifs.
ad Circuit schematics. mScarlet-I (RFP) and mCitrine (YFP) are reporters of circuit output and gene dosage, respectively. CMV (c) and OLP (d) do not have dosage compensation circuitry and are used as controls for Equalizer-L (a) and HYB (b), respectively. e Representative circuit output histograms. For all experiments (eh), Equalizer-L was induced with 1 ng/mL of doxycycline. f HYB produces high cell-to-cell circuit output variability. The gene-dosage values were normalized to those obtained when transfecting 1 ng of plasmid. The circles represent independent transfections. n = 36 per circuit (6 per dose and 6 doses per circuit). The dashed lines are trend lines (linear for Equalizer-L and CMV; exponential for HYB and OLP). The inset shows the trend lines for the entire range of gene-dosage reporter levels. See Supplementary Statistics for statistical comparisons. Equalizer-L (g) showed superior gene dosage compensation than HYB (h) at the population level. The gene-dosage and circuit output values were normalized to those obtained when transfecting 1 ng of plasmid. Dashed lines indicate trend lines (hyperbolic for CMV and linear otherwise). Sample sizes are as in (f). p < 0.0001 for the two-sided Welch’s t-test comparing the trendline slopes of Equalizer-L and HYB. Source data are provided as a Source Data file.
Fig. 6
Fig. 6. A replicating variant of Equalizer-L enables the development of extra-chromosomal cell lines that have stable gene expression with low cell-to-cell variation.
a Over the course of >8 weeks, the Equalizer-L episome produced similar cell-to-cell variation as a chromosomally integrated CMV cassette (CMV cell line) and lower variation than episomes with unregulated promoters. HEK293 cells were used. For all experiments ac, Equalizer-L was induced with 1-ng/mL doxycycyline. The error bars represent SEM. n = 4 independent trials. Tukey’s multiple comparison test was used to compare the Equalizer-L episome with the other conditions. ns not significant; *p < 0.05; **p < 0.01; ***p < 0.001; ****p < 0.0001. b Representative images of HEK293 cells expressing EGFP from episomes or the chromosome at 23 days post transfection. Each image is displayed with a linear lookup table with the minimum set to 0 and the maximum set to the sum of the mean intensity value and three standard deviations (see Methods). This approach enables a qualitative comparison of the cell-to-cell expression variability despite large differences in mean circuit output. Insets, binary masks to help identify regions of the images that correspond to cells (magenta region). Scale bar, 50 μm. See Supplementary Fig. 18 for images acquired on other days. c The circuit output levels from the Equalizer-L episome were stable for >50 days, whereas episomes with unregulated promoters displayed pronounced declines. Each circuit’s mean output levels were normalized to levels at 9 days post transfection. Induction, sample sizes, error bars, and statistical tests are as in (a). Source data are provided as a Source Data file.

References

    1. Rice AM, McLysaght A. Dosage sensitivity is a major determinant of human copy number variant pathogenicity. Nat. Commun. 2017;8:14366. doi: 10.1038/ncomms14366. - DOI - PMC - PubMed
    1. Kfir S, et al. Pathway- and expression level-dependent effects of oncogenic n-ras: p27(kip1) mislocalization by the ral-GEF pathway and erk-mediated interference with smad signaling. Mol. Cell Biol. 2005;25:8239–8250. doi: 10.1128/MCB.25.18.8239-8250.2005. - DOI - PMC - PubMed
    1. Liu Y, Lehmann M. A genomic response to the yeast transcription factor GAL4 in drosophila. Fly. 2008;2:92–98. doi: 10.4161/fly.6311. - DOI - PMC - PubMed
    1. Wang X, Li S. Protein mislocalization: mechanisms, functions and clinical applications in cancer. Biochim. Biophys. Acta. 2014;1846:13–25. - PMC - PubMed
    1. Moriya H. Quantitative nature of overexpression experiments. Mol. Biol. Cell. 2015;26:3932–3939. doi: 10.1091/mbc.E15-07-0512. - DOI - PMC - PubMed

Publication types