. 2021 Jul 5;12(1):4135.
doi: 10.1038/s41467-021-24502-0.

Ultralow-threshold laser using super-bound states in the continuum

Affiliations

Ultralow-threshold laser using super-bound states in the continuum

Min-Soo Hwang et al. Nat Commun. .

Abstract

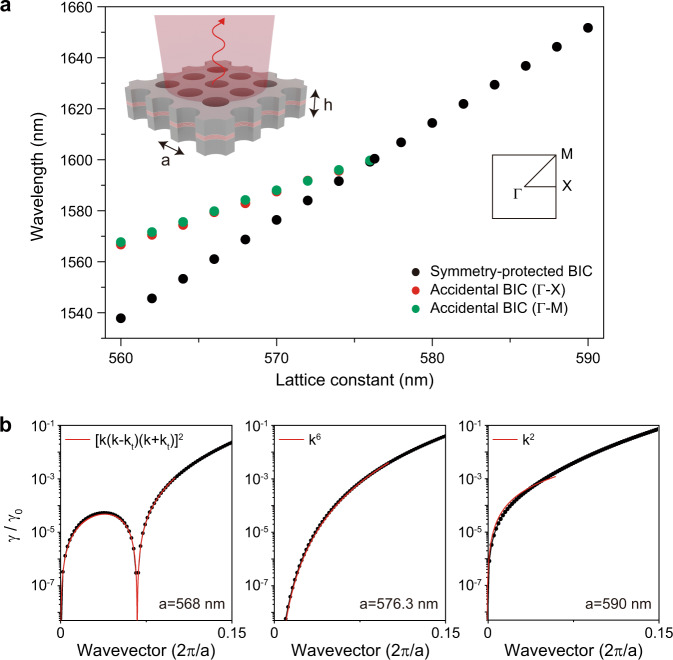
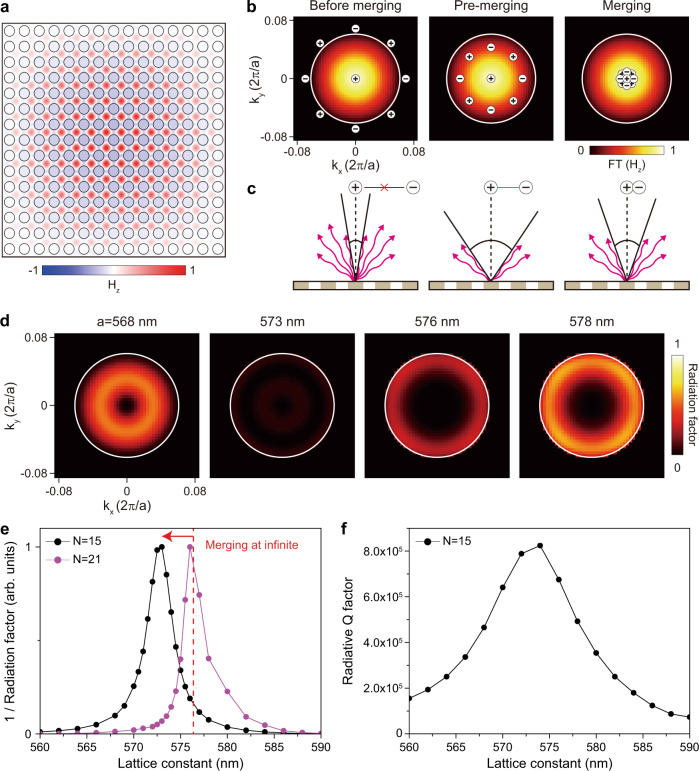
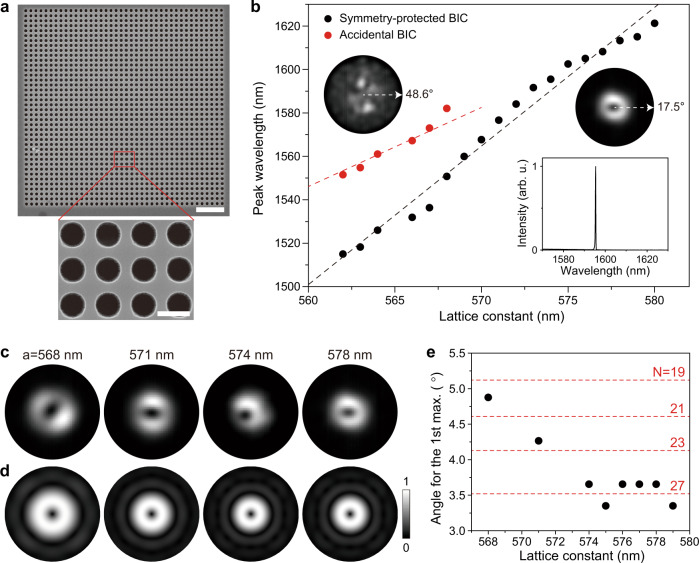
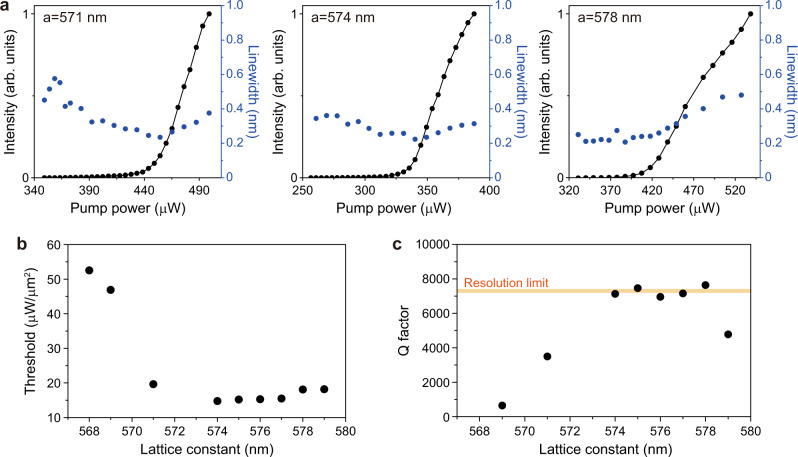
Wavelength-scale lasers provide promising applications through low power consumption requiring for optical cavities with increased quality factors. Cavity radiative losses can be suppressed strongly in the regime of optical bound states in the continuum; however, a finite size of the resonator limits the performance of bound states in the continuum as cavity modes for active nanophotonic devices. Here, we employ the concept of a supercavity mode created by merging symmetry-protected and accidental bound states in the continuum in the momentum space, and realize an efficient laser based on a finite-size cavity with a small footprint. We trace the evolution of lasing properties before and after the merging point by varying the lattice spacing, and we reveal this laser demonstrates the significantly reduced threshold, substantially increased quality factor, and shrunken far-field images. Our results provide a route for nanolasers with reduced out-of-plane losses in finite-size active nanodevices and improved lasing characteristics.


Conflict of interest statement

The authors declare no competing interests.

Figures

Fig. 1
Fig. 1. Merging of BICs in the infinite-size structure.
a Calculated wavelengths of the symmetry-protected BIC (black dots) and the two accidental BICs (red and green dots) as a function of the lattice constant. The merging of the BICs occurs at a = 576.3 nm. The inset shows the schematic of the laser structure: the lattice constant is a and the slab thickness is h. b Calculated radiation loss (γ) normalized by the value near the light cone (γ0), γ/γ0, along the ΓX-direction wavevector. Three lattice constants are examined (from left to right): a = 568 nm (before merging), 576.3 nm (at merging), and 590 nm (isolated). The calculated curves (black dots) are fitted by [k (k – kt) (k + kt)]2, k6, and k2 (red curves), at a = 568, 576.3, and 590 nm, respectively.
Fig. 2
Fig. 2. Merging of BICs in the finite-size structure.
a Calculated Hz field distribution at a = 573 nm in the finite-size domain with N = 15. N is the number of air holes along the vertical (or horizontal) direction. b Topological charge distributions in FT(Hz) at before-merging (left), pre-merging (middle), and merging (right). FT denotes the spatial Fourier transformation. The white circle of 7° indicates the first field minimum. c Schematic illustrations of the radiative loss in the three cases corresponding to b. d Calculated radiation factor, defined as |FT(Hz)/Q | , for a = 568, 573, 576, and 578 nm. The largest dark area is obtained at pre-merging of a = 573 nm. e The values of the inverse radiation factor plotted as a function of the lattice constant for N = 15 (black) and N = 21 (purple). The vertical red dashed line indicates the merging point in the infinite-size domain. f Radiative Q factor for N = 15 as a function of the lattice constant, calculated by the FDTD simulation.
Fig. 3
Fig. 3. Characteristics of BIC lasers.
a SEM images of the fabricated laser structure with a = 563 nm consisting of 40 × 40 unit cells. The scale bars are 3 μm (top) and 500 nm (bottom). b Measured lasing wavelengths of the symmetry-protected BIC lasers (black dots) and accidental BIC lasers (red dots) as a function of the lattice constant. The insets show the measured far-field images of the accidental BIC lasing mode (left; a = 568 nm) and the symmetry-protected BIC lasing mode (right; a = 578 nm). The bottom inset shows the above-threshold spectrum at a = 574 nm. Merging of the BICs occurs at a ~574 nm. c Measured far-field images of the symmetry-protected BIC lasers at a = 568 nm, 571 nm, 574 nm, and 578 nm (from left to right). The outer circle indicates 17.5°. d Simulated far-field images (|E|2) of the symmetry-protected BIC modes at a = 568 nm, 571 nm, 574 nm, and 578 nm (from left to right). The number of air holes (N) varies in the simulation (from left to right): N = 19, 23, 27, and 27. The outer circle indicates 17.5°. e Estimated angle for the 1st intensity maximum in the measured far-field images of the symmetry-protected BIC lasing modes (black dots). The red dashed lines indicate the calculated angles with varying N.
Fig. 4
Fig. 4. Threshold and Q factors of BIC lasers.
a Measured L–L curves (black; left y-axis) and linewidth (blue; right y-axis) of the symmetry-protected BIC lasers at a = 571 nm, 574 nm, and 578 nm. The increase of the linewidth above the threshold is due to the thermal effect. b Measured threshold values divided by the pump area (~5.4 μm in size) as a function of the lattice constant. c Measured Q factors, λ/Δλ, as a function of the lattice constant. Δλ is the linewidth estimated at the transparent pumping condition (~340 μW). The linewidth data were taken from Supplementary Fig. 10. The orange line indicates the Q factor obtained using the resolution-limited linewidth of the spectrometer (~0.22 nm).
Fig. 5
Fig. 5. Lasing properties in the super-BIC regime.
a Measured threshold values divided by the pump area as a function of the lattice constant, when the pump spot sizes are ~6.7 μm (top), ~8.0 μm (middle), and ~9.2 μm (bottom). b Measured polarization-resolved lasing images as a function of the polarizer axis. c Comparison of the measured L–L curve (open dots) with that obtained from the rate equations (red curve) in the log–log scale. The main parameters used in the rate equations are shown in “Methods” section. The estimated spontaneous emission factor is ~0.01. d Measured interference images in the near field, for (i) 303 μW, (ii) 331 μW, and (iii) 373 μW in the graph of c. (i), (ii), and (iii) correspond to the spontaneous emission, amplified spontaneous emission, and lasing regions, respectively. Scale bars, 10 μm. All data in bd were measured in the laser structure with a = 574 nm.

References

    1. Vahala KJ. Optical microcavities. Nature. 2003;424:839–846. doi: 10.1038/nature01939. - DOI - PubMed
    1. Hill MT, Gather MC. Advances in small lasers. Nat. Photon. 2014;8:908–918. doi: 10.1038/nphoton.2014.239. - DOI
    1. Ma R-M, Oulton RF. Applications of nanolasers. Nat. Nanotechnol. 2019;14:12–22. doi: 10.1038/s41565-018-0320-y. - DOI - PubMed
    1. Jeong K-Y, et al. Recent progress in nanolaser technology. Adv. Mater. 2020;32:2001996. doi: 10.1002/adma.202001996. - DOI - PubMed
    1. Bandres, M. A. et al. Topological insulator laser: experiments. Science359, eaar4005 (2018). - PubMed