. 2021 Jul 5;12(1):4125.
doi: 10.1038/s41467-021-24328-w.

Four chromosome scale genomes and a pan-genome annotation to accelerate pecan tree breeding

Affiliations

Four chromosome scale genomes and a pan-genome annotation to accelerate pecan tree breeding

John T Lovell et al. Nat Commun. .

Abstract

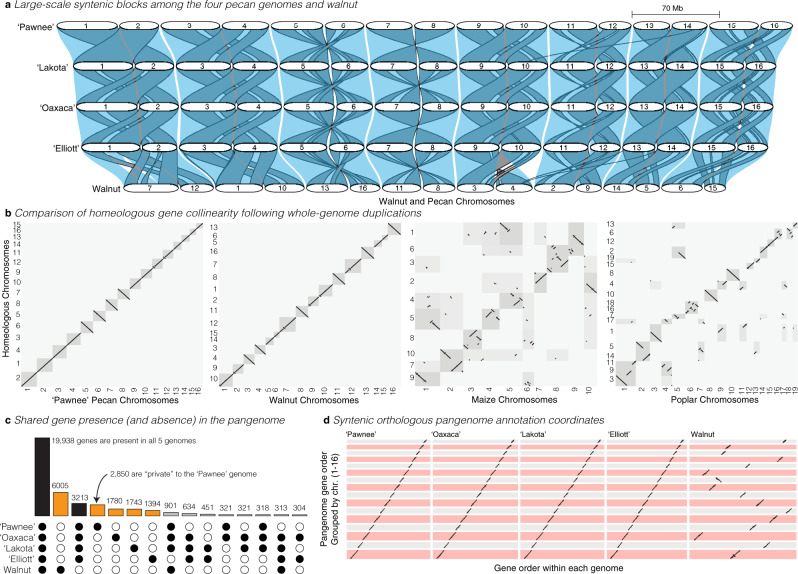
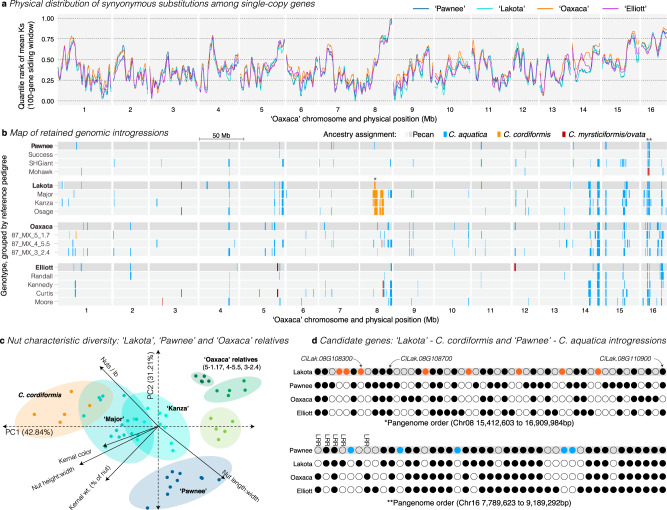
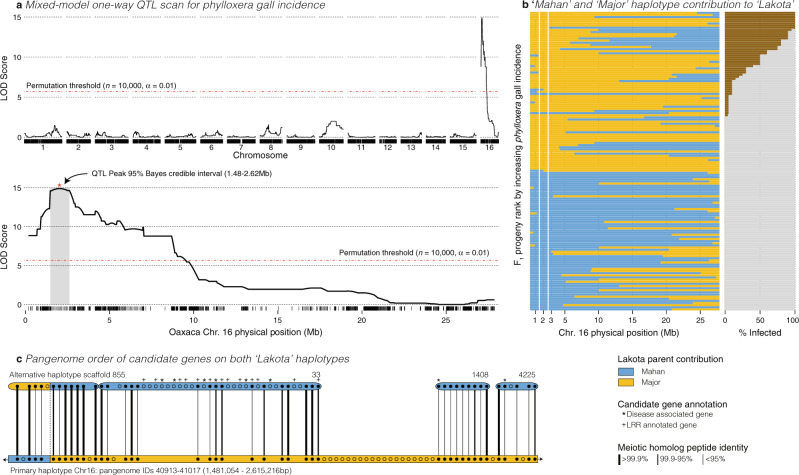
Genome-enabled biotechnologies have the potential to accelerate breeding efforts in long-lived perennial crop species. Despite the transformative potential of molecular tools in pecan and other outcrossing tree species, highly heterozygous genomes, significant presence-absence gene content variation, and histories of interspecific hybridization have constrained breeding efforts. To overcome these challenges, here, we present diploid genome assemblies and annotations of four outbred pecan genotypes, including a PacBio HiFi chromosome-scale assembly of both haplotypes of the 'Pawnee' cultivar. Comparative analysis and pan-genome integration reveal substantial and likely adaptive interspecific genomic introgressions, including an over-retained haplotype introgressed from bitternut hickory into pecan breeding pedigrees. Further, by leveraging our pan-genome presence-absence and functional annotation database among genomes and within the two outbred haplotypes of the 'Lakota' genome, we identify candidate genes for pest and pathogen resistance. Combined, these analyses and resources highlight significant progress towards functional and quantitative genomics in highly diverse and outbred crops.


Conflict of interest statement

The authors declare no competing interests.

Figures

Fig. 1
Fig. 1. Comparative analysis of four de novo pecan genomes.
a A map of syntenic orthologous (transparent blue) and homeologous blocks (gray with black borders) among the four reference genomes and the walnut outgroup. Chromosomes are represented by white segments and are scaled to the same physical size (Mb: megabases) for all genomes. Orthologous chromosomes are stacked vertically and labeled accordingly. b Comparisons of the degree of synteny between homeologous chromosomes across the ‘Pawnee’, walnut, maize, and poplar genomes. The dotplots display the gene-rank-order positions of syntenic blastp hits along the main genome (x axis) and homoeologous chromosomes (y axis). Chromosomal bounds are shaded by the total number of blast hits found between each pair of homeologous chromosomes. c Across the pan-genome, the vast majority of all genes are found in orthogroups that contain all four pecan genomes (bars shaded black); however, genes private to each genome (shaded orange) and, to a lesser degree, shared among >1 genome (gray) are also common. Filled circles represent presences in orthogroups; open circles are absences. d The high level of synteny between the pecan genomes and walnut allowed for simple pan-genome construction and gene ordering. Here, each point represents the location of a gene by its rank-order location within each de novo genome assembly (x axis) and the inferred syntenic position in the pan-genome (y axis). Source data are provided as a Source Data file.
Fig. 2
Fig. 2. A map of interspecific genomic introgressions in four pecan genomes.
a Sliding window analysis of neutral site substitution rate (Ks) within all single-copy orthogroups that were represented by all four genomes. Ks values were transformed to quantiles and a 100-gene sliding window was applied within each chromosome and genome. The resulting sliding window values are presented on a 0–1 scale where lower values represent the most similar regions across the physical genome (Mb: megabases). See Supplementary Fig. 2 for raw pairwise Ks values. Close-up pan-genome representations of two regions marked * and ** are highlighted in d. b Genome ancestry maps of the four reference genomes and representative members of each pedigree. Posterior probabilities of ancestry for three primary hybridizing species were decoded into blocks (colors red, orange, blue) of ≥500 variants. The background pecan ancestry is dark and light gray for the reference genomes and relatives respectively. c The large introgression in the ‘Major’ and ‘Kanza’ relatives of ‘Lakota’ appear to imbue phenotypic variation typical of C. cordiformis to these genotypes. 13 traits associated with nut yield and quality were assayed for a single C. cordiformis genotype (02-COR-LA-BF1), ‘Pawnee’, two members of the ‘Lakota’ pedigree (‘Major’ and ‘Kanza’) and three genotypes from Mexico that may be related to ‘Oaxaca’. The 13 traits were reduced to five non-collinear (|r | < 0.75) representatives and decomposed into the two major principal component axes (PC1, PC2), which collectively explained >74% of the variation. For each genotype, we present the positions in PCA space and the 95% confidence ellipse. d Pan-genome gene representatives are shown for each unique orthogroup within two physical (base pairs, bp) introgression intervals. Circles represent presence (filled) or absence (open) for each genome (row) by orthogroup (column) in the introgression. The first row in each plot represents the genome into which an introgression was observed. Private orthogroups to that genome are colored following panel b. Three candidate genes in ‘Lakota’ and the dense region of leucine-rich repeat (LRR) genes are annotated along the top row of each map. Source data underlying Fig. 3a–c are provided as a Source Data file. Raw data associated with d can be found within the pangenome database in Supplementary Data 1.
Fig. 3
Fig. 3. Analysis of a major QTL for phylloxera resistance.
a Quantitative Trait Locus (QTL) scans, controlling for genomic background via the leave-one-chromosome-out method for % phylloxera gall incidence. This experiment was conducted once at a single time point. Since the phenotype is non-normal, we determine the significance of QTL peaks via 10,000 permutations. The full genome and a close-up visualization of chromosome 16 are presented along the physical position (Mb: megabases) of the ‘Oaxaca’ genome assembly. The 95% confidence interval surrounding the QTL peak is shaded. b As evidenced by very high LOD scores for a 140-genotype population, there is an extremely strong haplotype structure at the peak QTL (between the vertical white bars), where all but two individuals that inherited the ‘Mahan’ haplotype from ‘Lakota’ have no evidence of phylloxera galls (gray horizontal bars in the plot to the right), while all individuals with >50% phylloxera gall incidence retained the ‘Major’ haplotype at the QTL peak region (brown horizontal bars indicate % incidence). c To define candidate genes, we queried the pan-genome within the physical bounds (base pairs, bp) of the QTL interval. All unique genes in this interval were projected onto the alternative haplotype; those contigs where >50% of the projected genes were derived from the candidate interval were extracted and aligned to the primary haplotype. Orthologous genes between the two haplotypes are connected by a solid line, the thickness of which is scaled by % identity between the two protein sequences. Presence–absence variant (PAV) genes without a projected ortholog are represented by open circles. Homologs of the genes in the interval were queried in model systems and qualified by whether annotations indicated a disease-related function or a leucine-rich repeat (LRR) motif. Finally, the haplotypes were coded by whether they were derived from the ‘Mahan’ or ‘Major’ parents of ‘Lakota’. Source data underlying c are provided as a Source Data file. Raw data associated with a, b can be found in Supplementary Data 5.

References

    1. Eyre-Walker A, Gaut RL, Hilton H, Feldman DL, Gaut BS. Investigation of the bottleneck leading to the domestication of maize. Proc. Natl Acad. Sci. USA. 1998;95:4441–4446. doi: 10.1073/pnas.95.8.4441. - DOI - PMC - PubMed
    1. Tanksley SD, McCouch SR. Seed banks and molecular maps: unlocking genetic potential from the wild. Science. 1997;277:1063–1066. doi: 10.1126/science.277.5329.1063. - DOI - PubMed
    1. Lemmon ZH, et al. Rapid improvement of domestication traits in an orphan crop by genome editing. Nat. Plants. 2018;4:766–770. doi: 10.1038/s41477-018-0259-x. - DOI - PubMed
    1. Naylor RL, et al. Biotechnology in the developing world: a case for increased investments in orphan crops. Food Policy. 2004;29:15–44. doi: 10.1016/j.foodpol.2004.01.002. - DOI
    1. Hall GD. Pecan food potential in prehistoric North America. Econ. Bot. 2000;54:103–112. doi: 10.1007/BF02866604. - DOI

Publication types