. 2021 Jul 5;11(1):13839.
doi: 10.1038/s41598-021-93366-7.

Critical fluctuations in epidemic models explain COVID-19 post-lockdown dynamics

Affiliations

Critical fluctuations in epidemic models explain COVID-19 post-lockdown dynamics

Maíra Aguiar et al. Sci Rep. .

Abstract

As the COVID-19 pandemic progressed, research on mathematical modeling became imperative and very influential to understand the epidemiological dynamics of disease spreading. The momentary reproduction ratio r(t) of an epidemic is used as a public health guiding tool to evaluate the course of the epidemic, with the evolution of r(t) being the reasoning behind tightening and relaxing control measures over time. Here we investigate critical fluctuations around the epidemiological threshold, resembling new waves, even when the community disease transmission rate [Formula: see text] is not significantly changing. Without loss of generality, we use simple models that can be treated analytically and results are applied to more complex models describing COVID-19 epidemics. Our analysis shows that, rather than the supercritical regime (infectivity larger than a critical value, [Formula: see text]) leading to new exponential growth of infection, the subcritical regime (infectivity smaller than a critical value, [Formula: see text]) with small import is able to explain the dynamic behaviour of COVID-19 spreading after a lockdown lifting, with [Formula: see text] hovering around its threshold value.


Conflict of interest statement

The authors declare no competing interests.

Figures
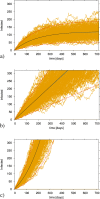
Figure 1
Figure 1
Stochastic realizations, in yellow, and the analytic mean field solution, blue line, for infected in the SIR model. The mean of these stochastic realizations is shown in black and it is in agreement with the mean field solution. With N=2·106, γ=0.05d-1 and import ϱ=e-12, infection rate β varies from sub - to super-critical regimes. In (a) β=0.9·γ, in (b) β=βc=γ and in c) β=1.1·γ.
Figure 2
Figure 2
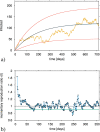
(a) Single stochastic realization of the subcritical SIR model with import and constant infection rate β<βc. Here β=0.9·γ, and the other parameters are as in Fig. 1b The momentary reproduction ratio r(t) calculated from the stochastic realization in Fig. 2a, hovering around the epidemiological threshold of rc=1, even though the theoretical value for a simple SIR model without import is the fixed quantity r=β/γ=0.9<1 (green line).
Figure 3
Figure 3
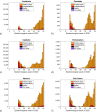
Ensemble of stochastic realizations of the refined SHARUCD-model with import. Starting in March 4, 2020, in (a) cumulative hospitalized cases CH(t), in (b) cumulative ICU admissions CU(t), in (c) cumulative deceases cases D(t) and in (d) cumulative positive cases Icum(t). The mean of 500 stochastic realizations is plotted in blue.
Figure 4
Figure 4
COVID-19 incidences in the Basque Country, from March 4 to October 27, 2020. In (a) hospital admissions, in (b) Intensive Care Units (ICU) admissions, in (c) deceased cases and in (d) detected positive cases via PCR tests). Data are plotted as black lines. The mean of 200 stochastic realizations for the SHARUCD model are plotted as a blue line, from March 4 to November 21, 2020, showing a stationarity behavior of the incidences. The 95% confidence intervals are obtained empirically from the stochastic realizations and are plotted as purple shadow.
Figure 5
Figure 5
Weekly positive cases, hospitalizations, ICU cases, and deaths in various Spanish autonomous communities until the end of epidemiological week 44 (October 31) of 2020.
Figure 6
Figure 6
Weekly positive cases, hospitalizations, ICU cases, and deaths in (a) Spain, (b) Belgium, (c) the Netherlands, and (d) France until the end of epidemiological week 44 (October 31) of 2020. Only the European Countries where the complete information was available are shown. However, when looking at hospitalizations and deceased cases only, similar behaviour was also found for Germany, Portugal, Sweden, Denmark and Greece.

References

    1. Aguiar, M., Millán Ortundo, E., Bidaurrazaga Van-Dierdonck, J., Mar, J., & Stollenwerk, N. Modelling COVID-19 in the Basque Country from introduction to control measure response, Nat. Sci. Rep.10, 17306 (16 pages). (2020). 10.1038/s41598-020-74386-1. - PMC - PubMed
    1. The Epidemiological SHARUCD Model Dashboard. https://wp.bcamath.org/news/en/epidemiological-sharucd-model/#introduction
    1. Aguiar, M., Bidaurrazaga Van-Dierdonck, J., & Stollenwerk, N. Reproduction ratio and growth rates: Measures for an unfolding pandemic, PLoS ONE15, e0236620 (14 pages). (2020). 10.1371/journal.pone.0236620. - PMC - PubMed
    1. Grassberger P, de la Torre A. Reggeon field theory (Schlögel’s first model) on a lattice?: Monte Carlo calculations of critical behaviour. Ann. Phys. 1979;122:373–396. doi: 10.1016/0003-4916(79)90207-0. - DOI
    1. Lübeck, S. Universal scaling behavior of non-equilibrium phase transitions, Int. J. Mod. Phys. B18, 3977–4173 (also available at arXiv:cond-mat/0501259v1, updated 11. Jan. 2005). (2004).

Publication types

MeSH terms