. 2021 Dec;42(12):2016-2032.
doi: 10.1038/s41401-021-00703-7. Epub 2021 Jul 5.

Lp-PLA2 inhibition prevents Ang II-induced cardiac inflammation and fibrosis by blocking macrophage NLRP3 inflammasome activation

Affiliations

Lp-PLA2 inhibition prevents Ang II-induced cardiac inflammation and fibrosis by blocking macrophage NLRP3 inflammasome activation

Si-Lin Lv et al. Acta Pharmacol Sin. 2021 Dec.

Abstract

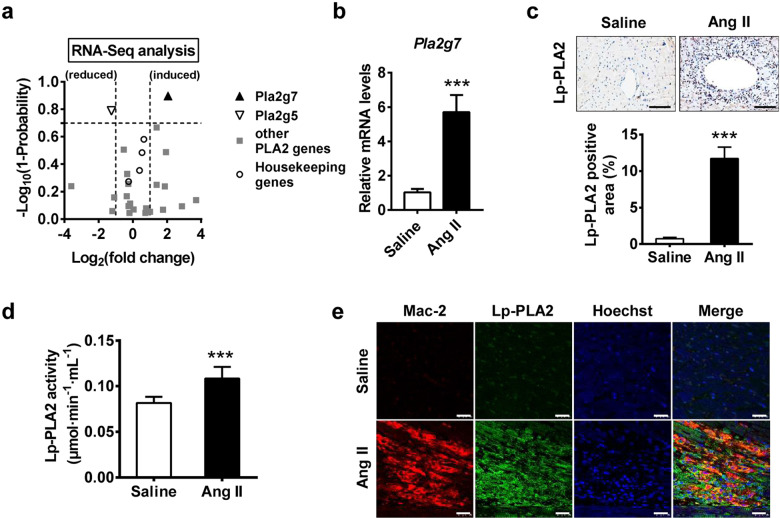
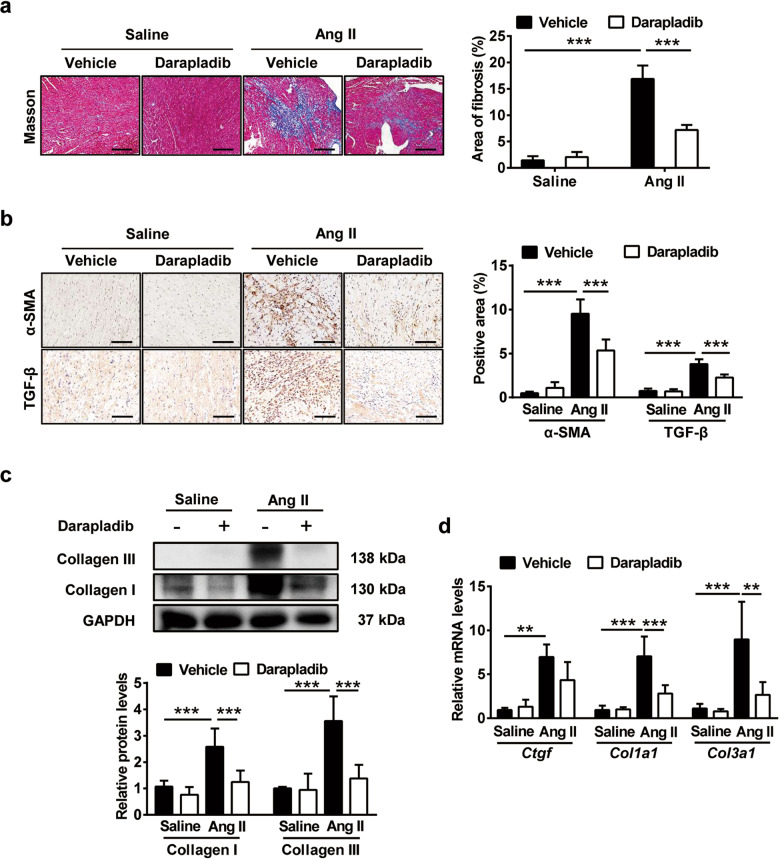
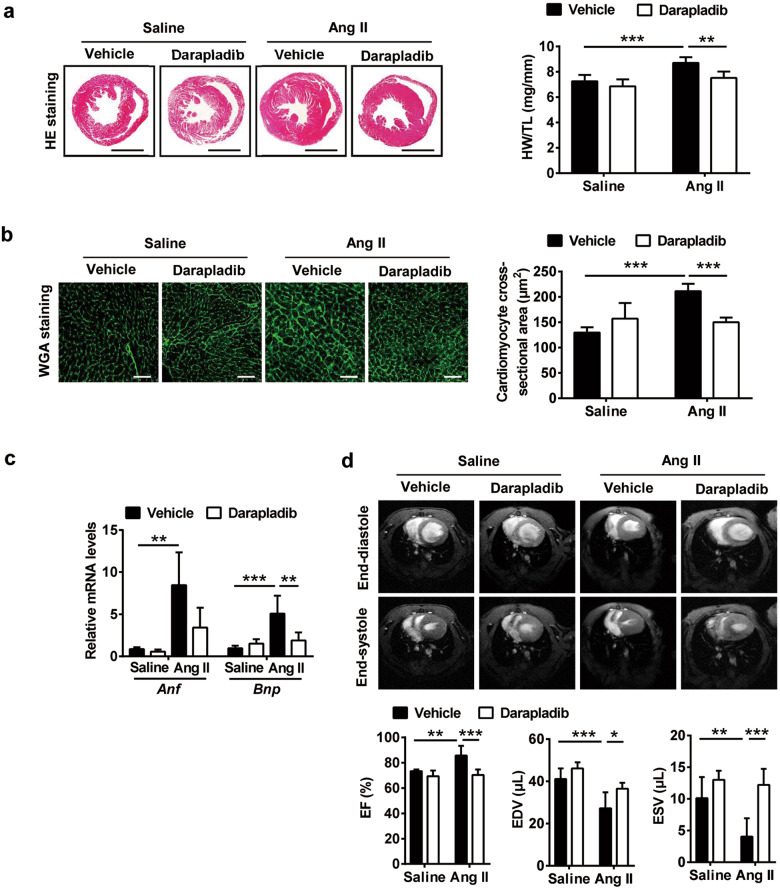
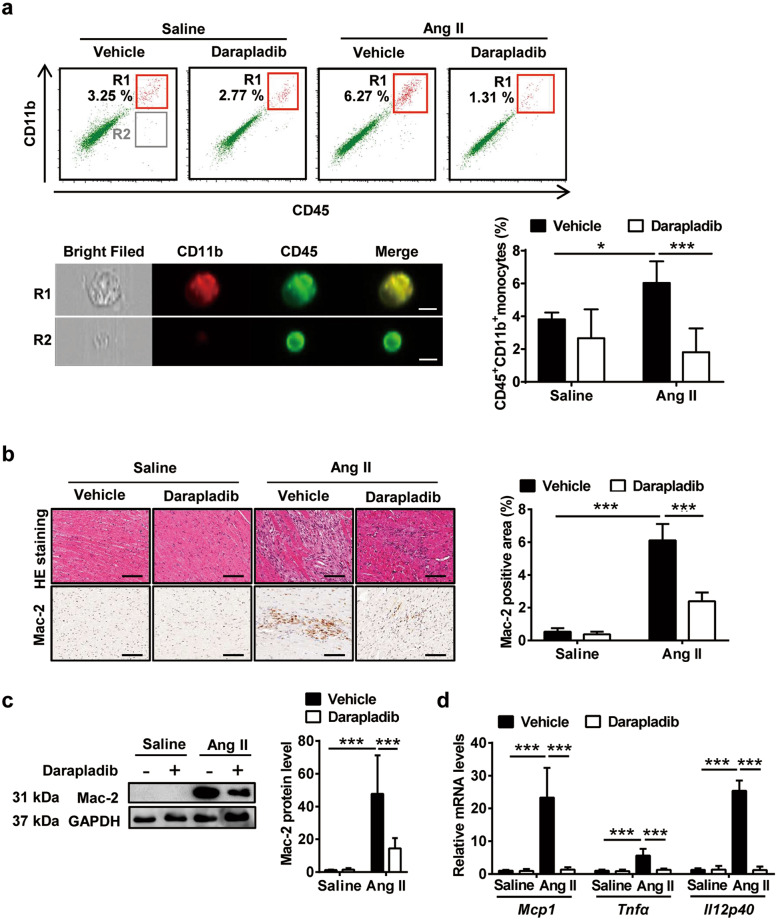
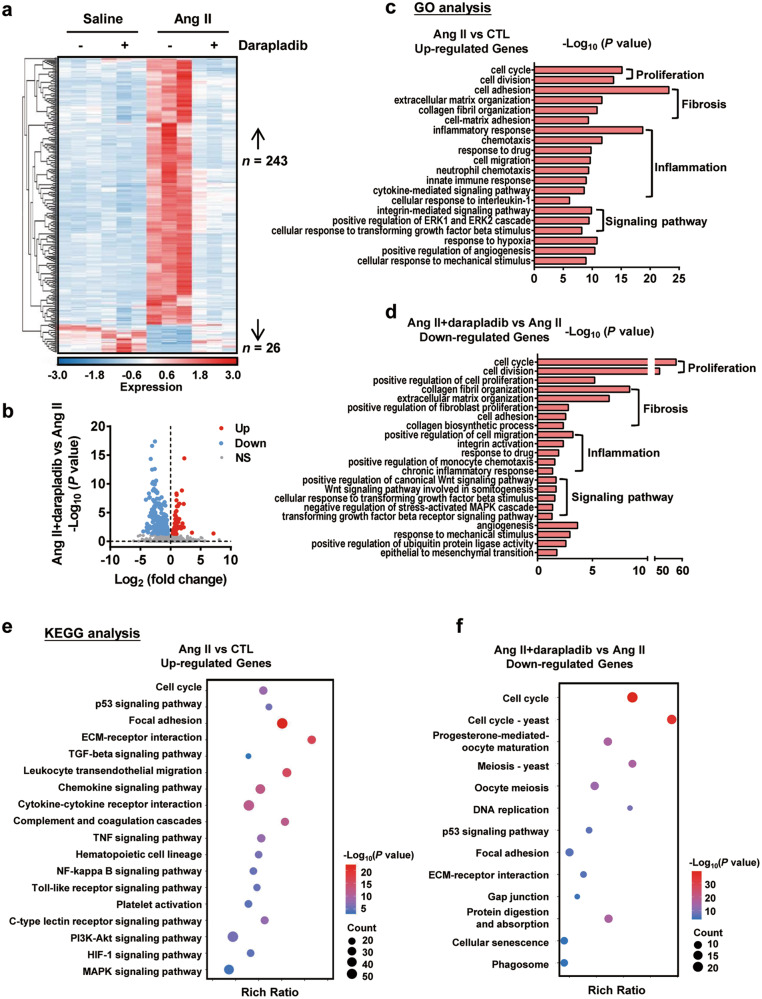
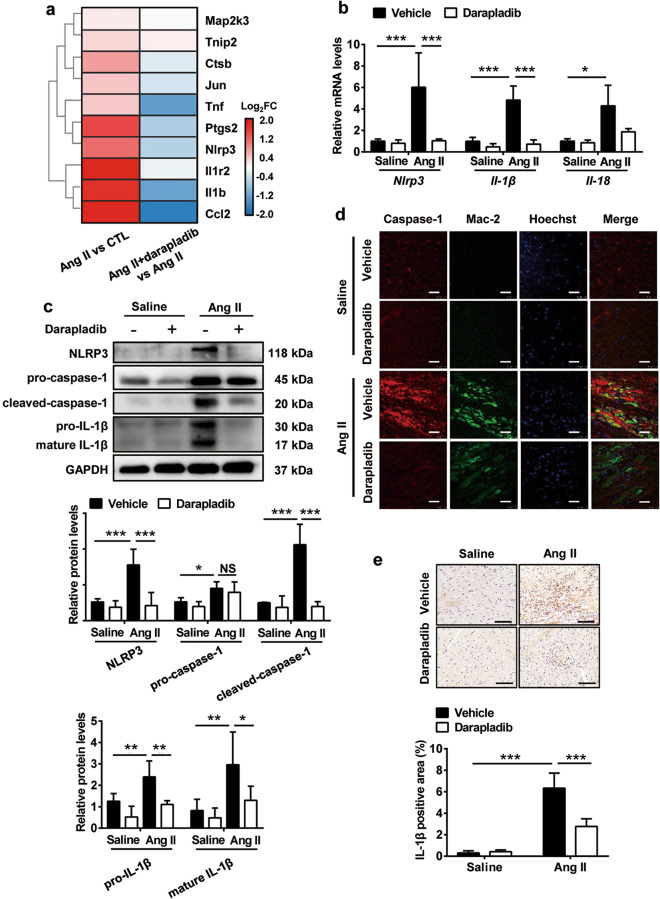
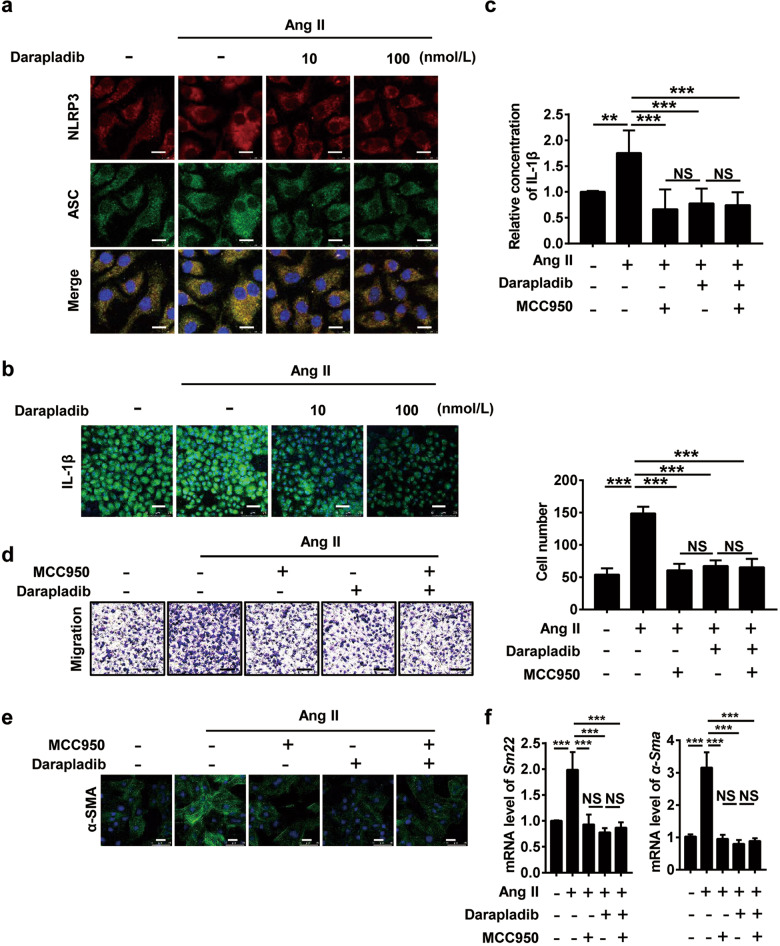
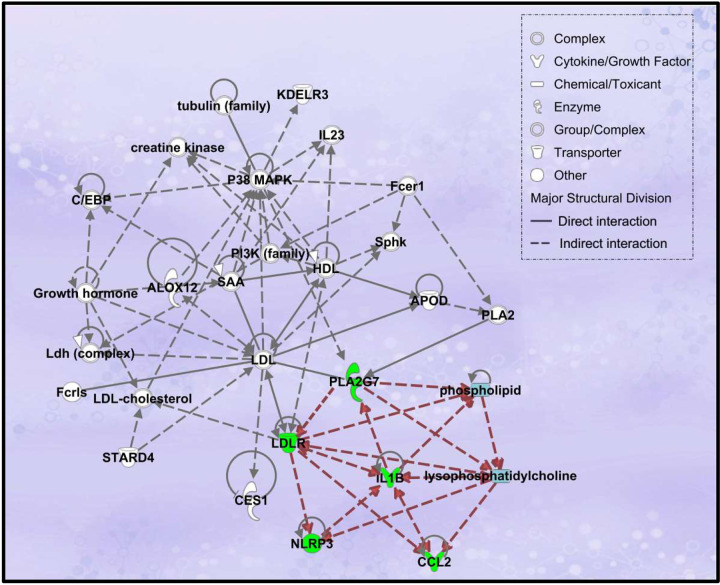
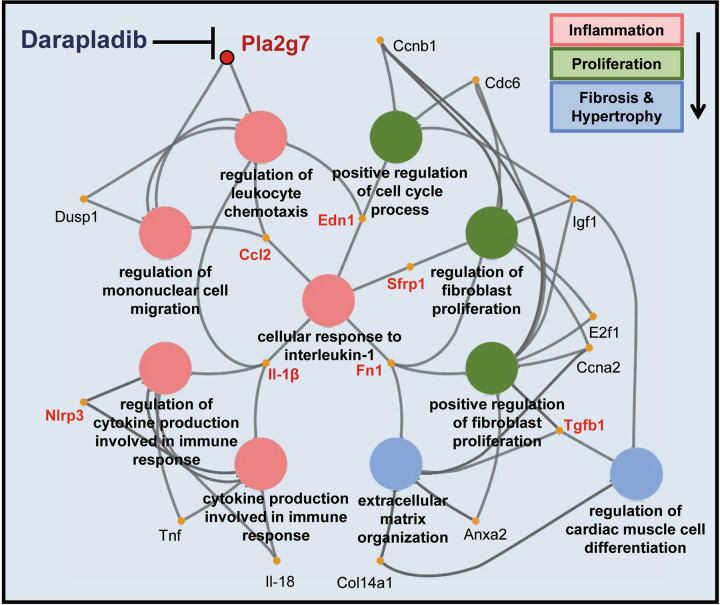
Macrophage-mediated inflammation plays an important role in hypertensive cardiac remodeling, whereas effective pharmacological treatments targeting cardiac inflammation remain unclear. Lipoprotein-associated phospholipase A2 (Lp-PLA2) contributes to vascular inflammation-related diseases by mediating macrophage migration and activation. Darapladib, the most advanced Lp-PLA2 inhibitor, has been evaluated in phase III trials in atherosclerosis patients. However, the role of darapladib in inhibiting hypertensive cardiac fibrosis remains unknown. Using a murine angiotensin II (Ang II) infusion-induced hypertension model, we found that Pla2g7 (the gene of Lp-PLA2) was the only upregulated PLA2 gene detected in hypertensive cardiac tissue, and it was primarily localized in heart-infiltrating macrophages. As expected, darapladib significantly prevented Ang II-induced cardiac fibrosis, ventricular hypertrophy, and cardiac dysfunction, with potent abatement of macrophage infiltration and inflammatory response. RNA sequencing revealed that darapladib strongly downregulated the expression of genes and signaling pathways related to inflammation, extracellular matrix, and proliferation. Moreover, darapladib substantially reduced the Ang II infusion-induced expression of nucleotide-binding oligomerization domain-like receptor with pyrin domain 3 (NLRP3) and interleukin (IL)-1β and markedly attenuated caspase-1 activation in cardiac tissues. Furthermore, darapladib ameliorated Ang II-stimulated macrophage migration and IL-1β secretion in macrophages by blocking NLRP3 inflammasome activation. Darapladib also effectively blocked macrophage-mediated transformation of fibroblasts into myofibroblasts by inhibiting the activation of the NLRP3 inflammasome in macrophages. Overall, our study identifies a novel anti-inflammatory and anti-cardiac fibrosis role of darapladib in Lp-PLA2 inhibition, elucidating the protective effects of suppressing NLRP3 inflammasome activation. Lp-PLA2 inhibition by darapladib represents a novel therapeutic strategy for hypertensive cardiac damage treatment.

Keywords: NLRP3 inflammasome; angiotensin II; cardiac fibrosis; cardiac inflammation; darapladib; hypertension; lipoprotein-associated phospholipase A2; macrophage.


Conflict of interest statement

The authors declare no competing interests.

Figures

Fig. 1
Fig. 1. Upregulation of Lp-PLA2 in Ang II-infused mice.
C57BL/6J mice were infused with Ang II (1500 ng·kg−1·min−1) or saline for 7 days before euthanasia. The hearts and plasma of these mice were collected for analysis. a RNA-seq analysis of mouse hearts. Volcano plot showing fold change and statistical probability value of PLA2 genes and four housekeeping genes (Gapdh, Eif5, Actb, and Nono) (n = 3; fold change ≥ 2 and probability ≥ 0.8 were considered statistically significant; black triangle, significantly increased PLA2 genes; white triangle, significantly decreased PLA2 genes; gray square, unchanged PLA2 genes; empty circle, control housekeeping genes). b RT-PCR analysis of the mRNA expression of Pla2g7 in mouse heart (n = 5). c Immunohistochemical staining of Lp-PLA2 in heart tissues and quantification (n = 5; scale bar = 200 μm). d Analysis of plasma Lp-PLA2 activity (n = 7). e Double immunofluorescence analysis of macrophage (Mac-2, red) and Lp-PLA2 (green) expression in hearts. Hoechst nuclear staining is shown in blue. Three independent experiments were performed. Scale bar = 25 μm. Data are presented as mean ± standard deviation, and n represents the number of animals. ***P < 0.001.
Fig. 2
Fig. 2
Inhibition of Lp-PLA2 by darapladib ameliorated Ang II infusion-induced collagen deposition and cardiac fibrosis. C57BL/6J mice received darapladib (50 mg·kg−1·d−1) or vehicle by gavage and were infused with saline or Ang II (1500 ng·kg−1·min−1) for 7 days. a Masson’s trichrome staining of myocardial fibrosis and quantification of fibrotic area (n = 5; scale bar = 100 μm). b Immunohistochemical staining of myofibroblasts with α-SMA and pro-fibrotic cytokine TGF-β. The quantifications are shown (n = 5; scale bar = 200 μm). c Western blot analysis of collagen I and collagen III protein levels in hearts, and the quantification of protein bands (n = 6). d RT-PCR analysis of Ctgf, Col1a1, and Col3a1 mRNA expression levels in heart tissues (n = 5). Ctgf connective tissue growth factor, Col1a1 collagen type I alpha 1, Col3a1 collagen type III alpha 1. Data are presented as the mean ± standard deviation, and n represents the number of animals. **P < 0.01, ***P < 0.001.
Fig. 3
Fig. 3. Inhibition of Lp-PLA2 by darapladib attenuated Ang II infusion-induced cardiac hypertrophy and dysfunction in mice.
C57BL/6J mice received darapladib (50 mg·kg−1·d−1) or vehicle by gavage and were infused with saline or Ang II (1500 ng·kg−1·min−1) for 7 days. a HE staining of heart sections and the ratio of heart weight to tibia length (HW/TL) (n = 6; scale bar = 2 mm). b FITC-WGA staining of heart sections and the quantification of myocyte cross-sectional area (n = 5; scale bar = 50 μm). c RT-PCR analysis of the mRNA levels of Anf and Bnp in the hearts (n = 6). d MRI analysis of mouse heart. Representative images of end-systole and end-diastole are shown. EF ejection fraction, EDV end-diastolic volume, ESV end-systolic volume (n = 6). Data are presented as the mean ± standard deviation, and n represents the number of animals. *P < 0.05, **P < 0.01, ***P < 0.001.
Fig. 4
Fig. 4. Inhibition of Lp-PLA2 by darapladib attenuated Ang II infusion-induced cardiac inflammation in mice.
C57BL/6J mice received darapladib (50 mg·kg−1·d−1) or vehicle by gavage and were infused with saline or Ang II (1500 ng·kg−1·min−1) for 7 days. a ImageStream analysis of CD45+CD11b+ monocytes in the hearts (n = 5; scale bar = 7 μm). b HE staining and immunohistochemical staining of macrophages (Mac-2) in the hearts (n = 5; scale bar = 200 μm). c Western blot analysis of Mac-2 protein level in the hearts and the quantification of protein bands (n = 6). d RT-PCR analysis of Mcp1, Tnfα, and Il12p40 mRNA expression levels in the heart tissues (n = 5). Mcp1 monocyte chemotactic protein 1, Tnfα tumor necrosis factor-alpha, Il12p40 interleukin 12b. Data are presented as the mean ± standard deviation, and n represents the number of animals. *P < 0.05, **P < 0.01, ***P < 0.001.
Fig. 5
Fig. 5. RNA-seq analysis of mouse cardiac tissues.
C57BL/6J mice received darapladib (50 mg·kg−1·d−1) or vehicle by gavage and were infused with saline or Ang II (1500 ng·kg−1·min−1) for 7 days. Hearts were collected for RNA-seq analysis. a Heatmap of differentially expressed genes that were both significantly changed in Ang II (compared to saline) and darapladib+Ang II (compared to Ang II) groups. Each column represents an individual replicate, with three replicates per group. Each row represents an individual gene. The top of the heatmap is the cluster of genes that are upregulated in Ang II-infused hearts compared with saline-infused hearts and those that are downregulated in darpladib + Ang II hearts, whereas the bottom is the cluster of genes that are downregulated in Ang II-infused hearts compared with saline-infused hearts and those that are upregulated in darapladib + Ang II hearts. The color bar represents the relative gene expression of log-transformed and normalized fragments per kilobase of transcript per million mapped reads (FPKM). Upregulated genes are shown in red, and downregulated genes are shown in blue. b Volcano plot shows the fold change and the significance of genes that were altered in darapladib+Ang II hearts vs. Ang II hearts. Upregulated genes are plotted in red, downregulated genes are plotted in blue, and genes not significant are plotted in gray. GO analysis of biological processes for the genes upregulated in the Ang II group compared with the saline group (c), and the genes downregulated in the darapladib+Ang II group compared with the Ang II group (d). Significantly changed ontology terms are mainly involved in inflammation, proliferation, fibrosis, and several fibrotic signaling pathways (c, d). KEGG pathway analysis of upregulated genes in the Ang II group compared with the saline group (e) and downregulated genes in the darapladib + Ang II group compared with the Ang II group (f). Significantly changed signaling pathways are mainly involved in inflammation, proliferation, and fibrosis (e, f). NS indicates not significant. P adj < 0.05 is considered to be different.
Fig. 6
Fig. 6. Inhibition of Lp-PLA2 by darapladib attenuated Ang II infusion-induced NLRP3 inflammasome activation.
C57BL/6J mice received darapladib (50 mg·kg−1d−1) or vehicle by gavage and were infused with saline or Ang II (1500 ng·kg−1·min−1) for 7 days. a Hearts were detected by RNA-seq analysis, and NLRP3 inflammasome-associated genes are shown in the heatmap (n = 3). The color bar represents the log-transformed and normalized relative fold change (FC) of genes. b RT-PCR analysis of Nlrp3, Il-1β, and Il-18 mRNA expression levels in the heart tissues (n = 5). c Western blot analysis of NLRP3 inflammasome-associated proteins (NLRP3, pro-caspase-1, cleaved-caspase-1, pro-IL-1β, and mature IL-1β) in hearts and the quantification of protein bands (n = 6). d Double immunofluorescence analysis of macrophage (Mac-2, green) and caspase-1 (red) expression in hearts. Hoechst nuclear staining is shown in blue. Three independent experiments were performed. Scale bar = 25 μm. e Immunohistochemical staining of IL-1β in the hearts (n = 5; scale bar = 200 μm). Data are presented as the mean ± standard deviation, and n represents the number of animals. P adj < 0.05 is considered to be different, *P < 0.05, **P < 0.01, ***P < 0.001.
Fig. 7
Fig. 7. Darapladib-treated macrophages inhibited myofibroblast differentiation in vitro via inhibition of the NLRP3/caspase-1/IL-1β secretion axis.
BMDMs were primed with LPS (100 ng/mL) for 3 h, then treated with darapladib (10 or 100 nmol/L) for 1 h before stimulation with 100-nmol/L Ang II for 3 h to detect NLRP3 and ASC (a). Otherwise, they were stimulated with Ang II for 48 h to detect IL-1β (b) by immunofluorescence staining. Three independent experiments were performed. Scale bar = 10 μm in (a) and 40 μm in (b). c BMDMs were primed with LPS (100 ng/mL) for 3 h, then either treated with darapladib (100 nmol/L), MCC950 (1 μmol/L) or both for 1 h before stimulation with 100-nmol/L Ang II for 48 h to detect IL-1β in supernatants by ELISA (n = 6). d Macrophages were co-cultured with fibroblasts via transwell inserts. Cells were either treated with darapladib (100 nmol/L), MCC950 (1 μmol/L), or both for 1 h before stimulation with 1-μmol/L Ang II for 48 h to detect the migration of macrophages with crystal violet staining (n = 5; scale bar = 50 μm). Macrophages were treated as in (c), and the supernatants were collected. Starved fibroblasts were cultured in different macrophage supernatants for 24 h. The protein expression of α-SMA was detected by immunofluorescence staining (e) (scale bar = 40 μm). The mRNA levels of Sm22 and α-Sma were detected by RT-PCR (f). Sm22 smooth muscle protein 22-alpha. Data are presented as the mean ± standard deviation, and n represents the number of animals. NS indicates not significant. **P < 0.01, ***P < 0.001.
Fig. 8
Fig. 8. Ingenuity pathway analysis (IPA) network to uncover the detailed molecular mechanisms of darapladib in NLRP3 inflammasome activation.
The interaction networks of DEGs regulated by darapladib and the associated molecules found from related literature were generated through the use of IPA. PLA2G7, NLRP3, IL-1β, CCL2, and LDLR are highlighted in green. Phospholipids and lysophosphatidylcholines are highlighted in blue. Key interactions associated with PLA2G7 and NLRP3 are highlighted in red.
Fig. 9
Fig. 9. Biological pathway networks mediated by darapladib in hypertensive cardiac remodeling.
ClueGO analysis of genes regulated by darapladib in Ang II-infused hearts. These networks are functionally grouped by enriched categories of target genes. Different functional groups of GO terms (biological process) are represented as nodes in different colors (pink nodes represent GO terms associated with inflammation; green nodes, proliferation; blue nodes, fibrosis, and hypertrophy). Shared genes are represented by yellow nodes, and Pla2g7 gene is represented by the red node. The edge between nodes reflects shared genes in different GO terms, or the connections between GO terms. Anxa2 annexin A2, Ccna2 cyclin A2, Ccnb1 cyclin B1, Cdc6 cell division cycle 6, Col14a1 collagen type XIV alpha 1, Dusp1 dual specificity phosphatase 1, Edn1 endothelin 1, E2f1 E2F transcription factor 1, Fn1 fibronectin 1, Igf1 insulin-like growth factor 1, Sfrp1 secreted frizzled-related protein 1.

References

    1. Gradman AH, Alfayoumi F. From left ventricular hypertrophy to congestive heart failure: management of hypertensive heart disease. Prog Cardiovasc Dis. 2006;48:326–41. - PubMed
    1. Park S, Nguyen NB, Pezhouman A, Ardehali R. Cardiac fibrosis: potential therapeutic targets. Transl Res. 2019;209:121–37.. - PMC - PubMed
    1. McMaster WG, Kirabo A, Madhur MS, Harrison DG. Inflammation, immunity, and hypertensive end-organ damage. Circ Res. 2015;116:1022–33. - PMC - PubMed
    1. Zhu YC, Zhu YZ, Lu N, Wang MJ, Wang YX, Yao T. Role of angiotensin AT1 and AT2 receptors in cardiac hypertrophy and cardiac remodelling. Clin Exp Pharmacol Physiol. 2003;30:911–8. - PubMed
    1. O’Rourke SA, Dunne A, Monaghan MG. The role of macrophages in the infarcted myocardium: orchestrators of ECM remodeling. Front Cardiovasc Med. 2019;6:101. - PMC - PubMed

MeSH terms