. 2021 Aug;6(8):1043-1054.
doi: 10.1038/s41564-021-00920-0. Epub 2021 Jul 5.

Probiotics impact the antibiotic resistance gene reservoir along the human GI tract in a person-specific and antibiotic-dependent manner

Affiliations

Probiotics impact the antibiotic resistance gene reservoir along the human GI tract in a person-specific and antibiotic-dependent manner

Emmanuel Montassier et al. Nat Microbiol. 2021 Aug.

Abstract

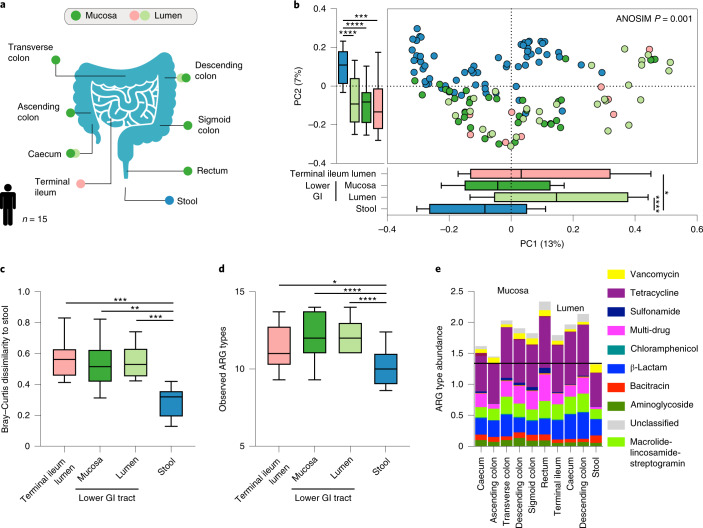
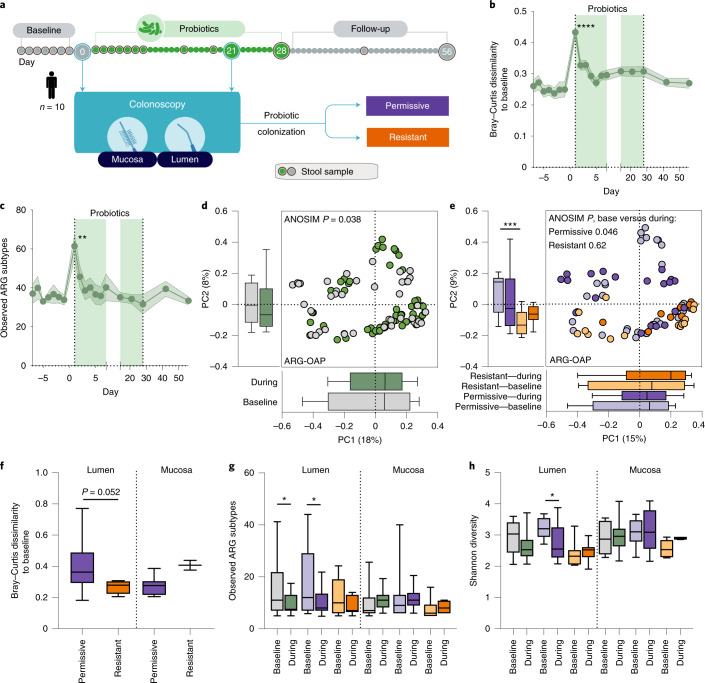
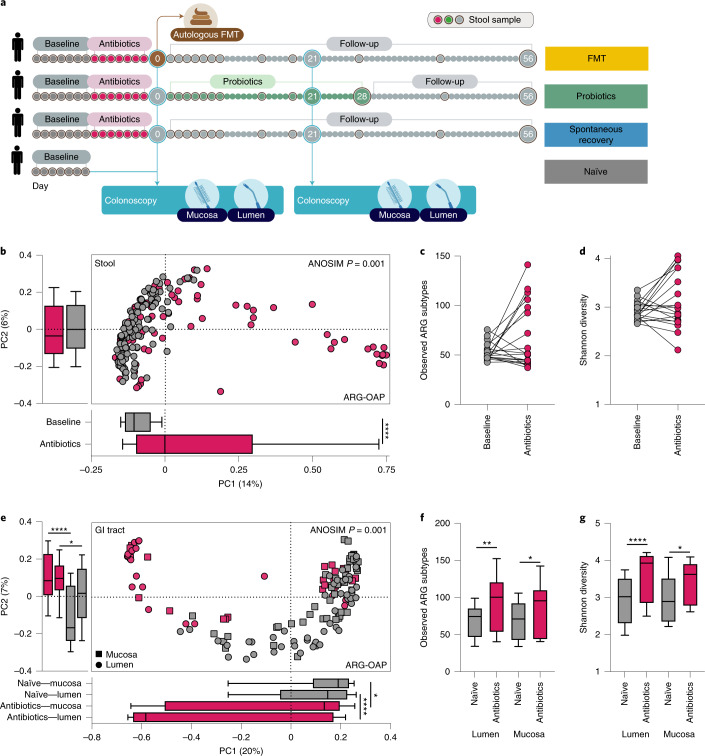
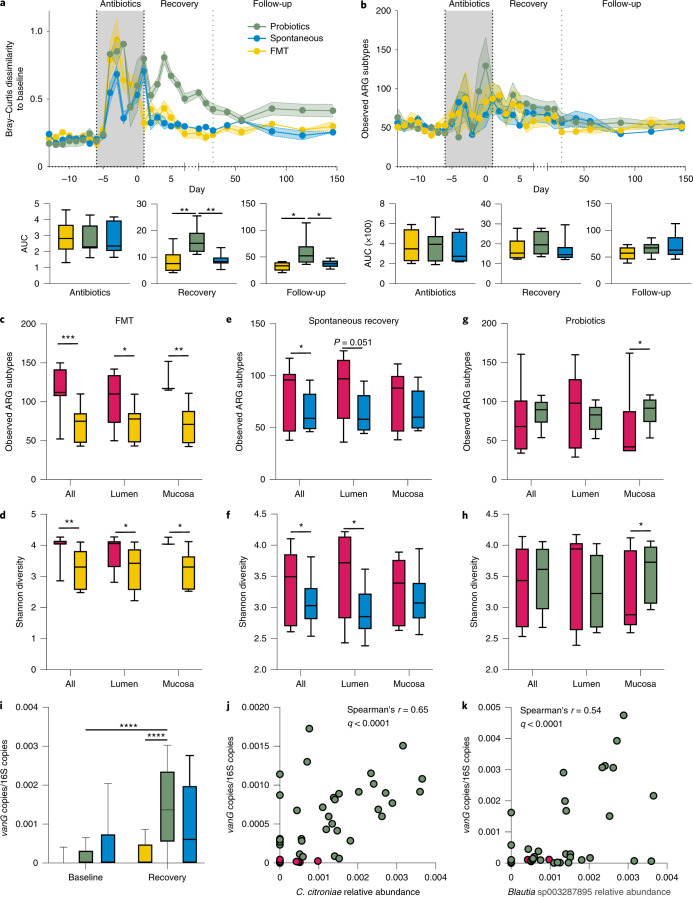
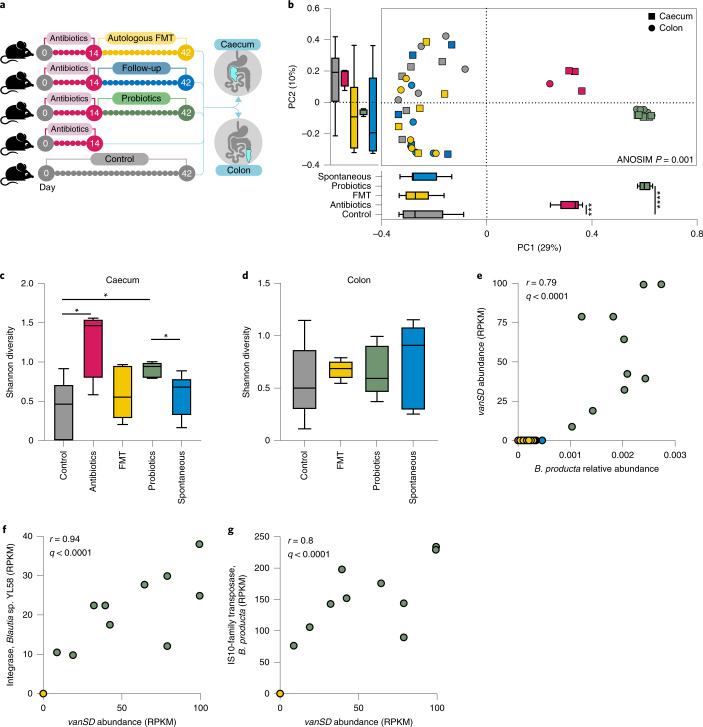
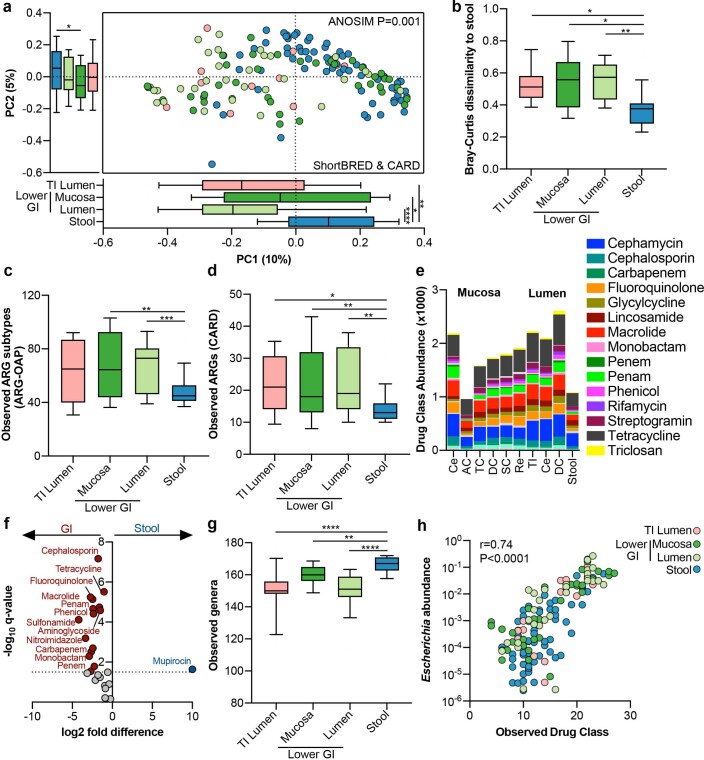
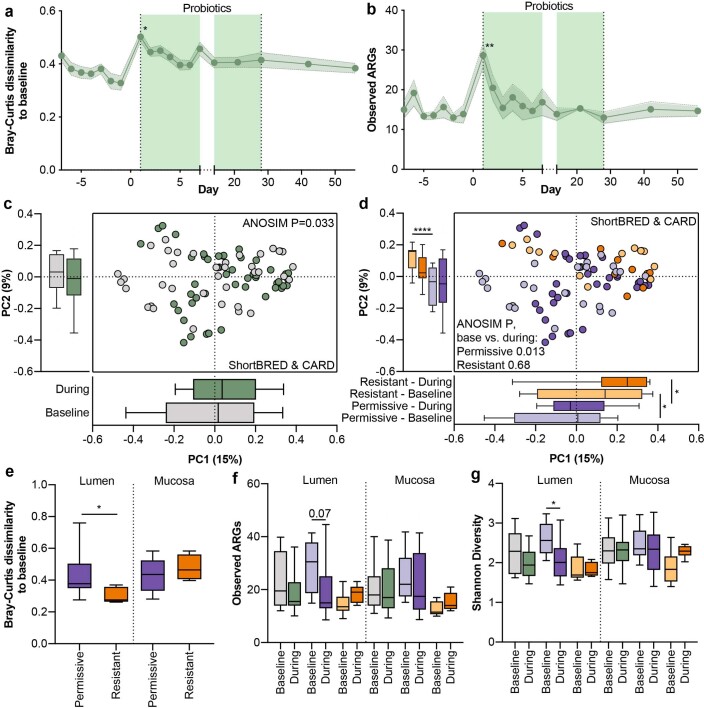
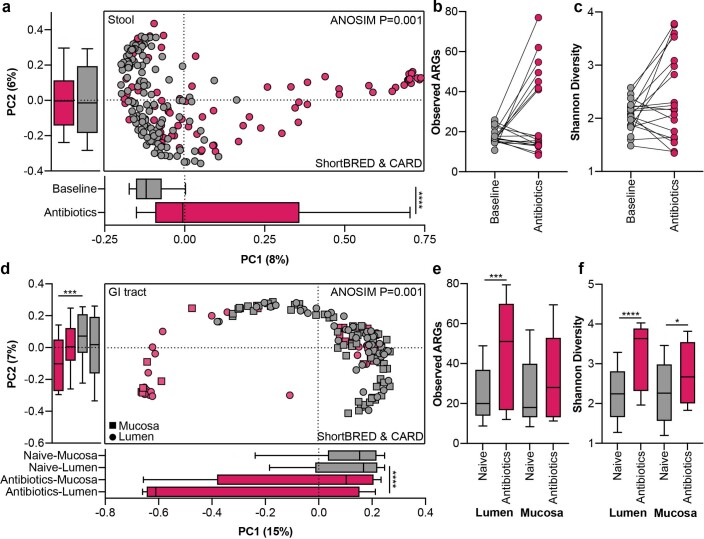
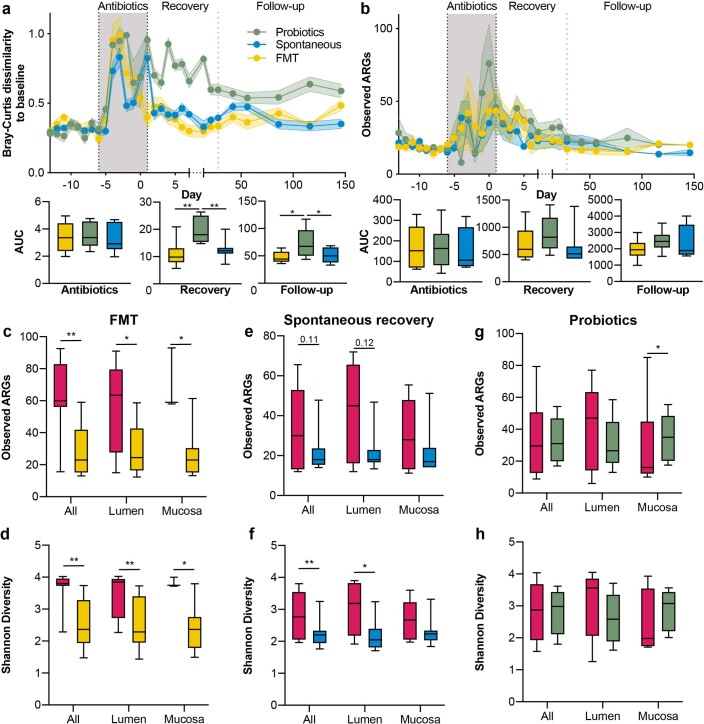
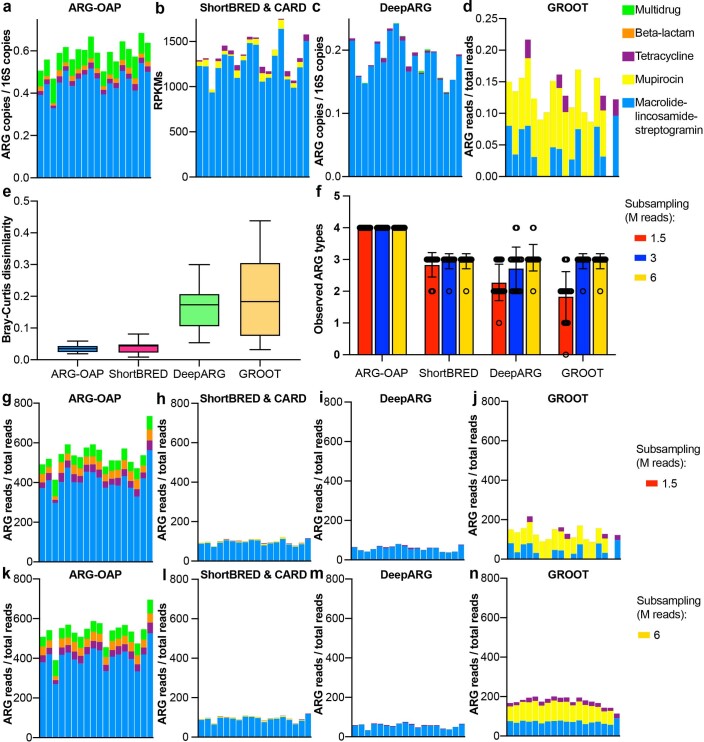
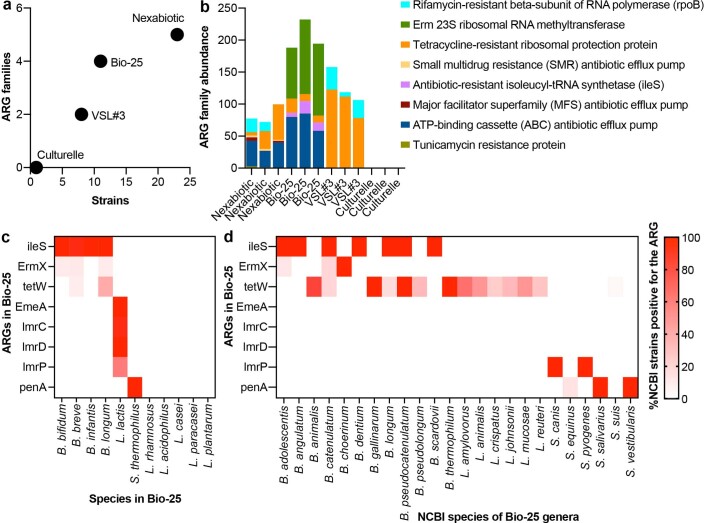
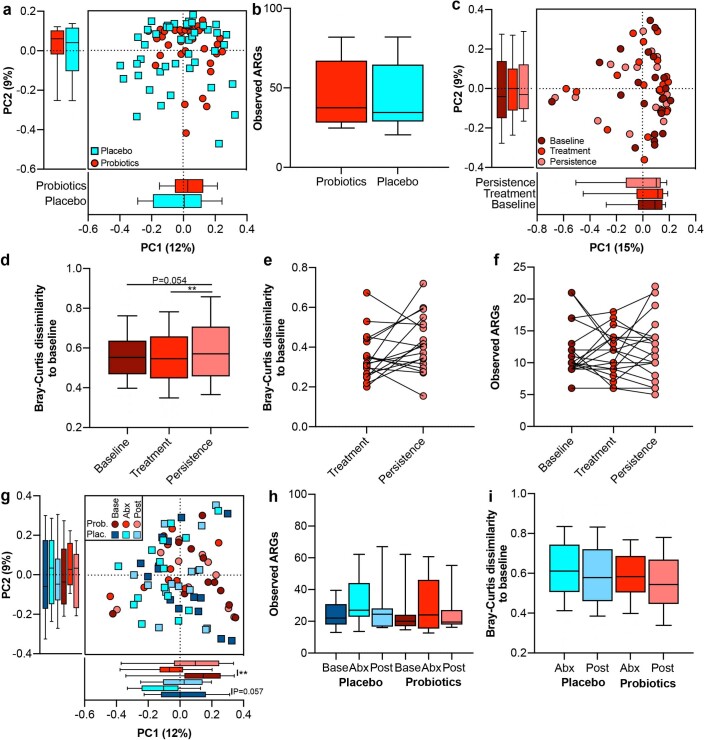
Antimicrobial resistance poses a substantial threat to human health. The gut microbiome is considered a reservoir for potential spread of resistance genes from commensals to pathogens, termed the gut resistome. The impact of probiotics, commonly consumed by many in health or in conjunction with the administration of antibiotics, on the gut resistome is elusive. Reanalysis of gut metagenomes from healthy antibiotics-naïve humans supplemented with an 11-probiotic-strain preparation, allowing direct assessment of the gut resistome in situ along the gastrointestinal (GI) tract, demonstrated that probiotics reduce the number of antibiotic resistance genes exclusively in the gut of colonization-permissive individuals. In mice and in a separate cohort of humans, a course of antibiotics resulted in expansion of the lower GI tract resistome, which was mitigated by autologous faecal microbiome transplantation or during spontaneous recovery. In contrast, probiotics further exacerbated resistome expansion in the GI mucosa by supporting the bloom of strains carrying vancomycin resistance genes but not resistance genes encoded by the probiotic strains. Importantly, the aforementioned effects were not reflected in stool samples, highlighting the importance of direct sampling to analyse the effect of probiotics and antibiotics on the gut resistome. Analysing antibiotic resistance gene content in additional published clinical trials with probiotics further highlighted the importance of person-specific metagenomics-based profiling of the gut resistome using direct sampling. Collectively, these findings suggest opposing person-specific and antibiotic-dependent effects of probiotics on the resistome, whose contribution to the spread of antimicrobial resistance genes along the human GI tract merit further studies.


Conflict of interest statement

E.E. is a consultant to DayTwo and BiomX. None of the topics related to this work involve these or other commercial entities. The remaining authors declare no competing interests.

Figures

Fig. 1
Fig. 1. Stool samples do not represent the GI resistome.
Fifteen men and women provided stool samples and underwent a session of colonoscopy after 7 d of providing stool samples, during which luminal aspirates were collected from the terminal ileum, caecum and descending colon; mucosal brushes were collected from the caecum, ascending colon, transverse colon, descending colon, sigmoid colon and rectum. Metagenomic sequences were subsampled to 2 M of reads, resulting in 65 stool (blue), 29 lower GI tract luminal aspirates (light green), 12 terminal ileum luminal aspirates (peach) and 32 mucosal brush samples (dark green) analysed using ARG-OAP v.2.0 to identify and quantify ARG ‘subtypes’. a, Sampled GI tract regions. b, Bray–Curtis-based beta diversity of stool and endoscopic samples based on ARG subtypes. PC1 stool versus terminal ileum lumen P = 0.041, stool versus lower GI tract lumen P < 0.0001; PC2 stool versus terminal ileum lumen P = 0.0001, stool versus lower GI tract mucosa P < 0.0001, stool versus lower GI tract lumen P < 0.0001. c, Bray–Curtis dissimilarity to stool in samples from the terminal ileum lumen (P = 0.0003), lower GI tract mucosa (P = 0.003) and lower GI tract lumen (P = 0.0002) based on ARG subtypes. d, The observed ARG ‘types’ (alpha diversity) are significantly lower in stool compared to the terminal ileum lumen (P = 0.0467), lower GI tract mucosa (P < 0.0001) and lower GI tract lumen (P < 0.0001). e, Abundance of antibiotic resistance ‘types’ per region. *P < 0.05, **P < 0.01, ***P < 0.001, ****P < 0.0001, Kruskal–Wallis and Dunn’s tests (all panels). The horizontal lines represent the median and the whiskers represent the 10–90 percentiles. Source data
Fig. 2
Fig. 2. Probiotic-associated reduction in gut resistome is person-specific.
Ten men and women provided stool samples before, after and during 28 d of supplementation with a commercial probiotic supplement; two colonoscopies were performed immediately before supplementation started and on day 21 of supplementation. Metagenomic sequences were analysed using ARG-OAP v.2.0 for the identification of ARGs, subsampled to 2 M of reads and normalized by 16S. a, Experimental design. Individuals were defined as colonization-permissive if they had a statistically significant increase in probiotic load in their lower GI tract mucosa samples according to species-specific quantitative PCR amplification. b, Bray–Curtis dissimilarity (ARG subtypes) of stool samples to all baseline samples of each individual. The light green shade indicates the supplementation period. Day 1 of supplementation versus baseline P < 0.0001. c, Observed ARG subtypes in stool over time (P = 0.0031). d, Bray–Curtis dissimilarity of ARGs (‘types’) in all lower GI tract endoscopic samples (luminal aspirates and mucosal brushes) collected before (grey) or during supplementation (day 21, green). e, Same as d but based on ARG subtypes and colour-coded according to probiotic colonization permissiveness (purple, n = 6) or resistance (orange, n = 4) and time point (before, light; during, dark). PC2 permissive versus resistant baseline P = 0.0004. f, Per-person Bray–Curtis dissimilarity to baseline calculated in all participants or in the two subsets based on ARG subtypes. Lumen P = 0.052. g,h, Alpha diversity measurements (g), observed ARGs (subtypes) or Shannon diversity index in endoscopic samples (h) of permissive and resistant individuals, compared either to the baseline of each subset or between subsets. In g, lumen, all samples baseline versus during P = 0.035, permissive baseline versus during P = 0.0223. In h, lumen, permissive baseline versus during P = 0.0226. *P < 0.05; **P < 0.01; ***P < 0.001; ****P < 0.0001. Two-way ANOVA and Dunnett’s (a,b) or Sidak’s test (g,h) or two-sided Mann–Whitney U-test (all the rest). The horizontal lines represent the median, the symbols represent the mean, the error bands represent the s.e.m. (b,c) and the whiskers represent the 10–90 percentiles (dh). Source data
Fig. 3
Fig. 3. Antibiotics expand the resistome in the lower GI tract lumen.
a, Experimental design of antibiotics treatment and follow-up arms. bd, Metagenomic sequences, subsampled to 2 M of reads, were analysed using ARG-OAP v.2.0 to identify ARGs and normalized by 16S. The results are based on ARG subtypes. Stool samples were collected from 21 individuals for 7 d before (grey) and 7 d during (magenta) a course of ciprofloxacin and metronidazole. b, Bray–Curtis dissimilarities (P < 0.0001). c,d, Paired comparison of alpha diversity (c) observed ARG subtypes or Shannon diversity index (d). Each point represents the average of all baseline or antibiotic days for each individual. eg, The 21 participants underwent endoscopy immediately after 7 d of antibiotics (magenta). We compared their resistome to individuals undergoing endoscopy without any treatment (n = 15, grey). e, Bray–Curtis dissimilarities. PC1 lumen P < 0.0001, mucosa P = 0.0196; PC2 lumen P < 0.0001, mucosa P = 0.044. f,g, Alpha diversity (f) observed ARG subtypes (lumen P = 0.0011, mucosa P = 0.034) or Shannon diversity index (g) (lumen P < 0.0001, mucosa P = 0.0143). *P < 0.05; **P < 0.01; ****P < 0.0001. Two-sided Mann–Whitney U-test. The horizontal lines represent the median, the symbols represent the mean and the whiskers represent the 10–90 percentiles. Source data
Fig. 4
Fig. 4. Probiotics expand the resistome in the GI tract mucosa after antibiotics.
a,b, Longitudinal follow-up of resistome (analysed using ARG-OAP v.2.0, subsampled to 2 M of reads, normalized by 16S) in stool samples of 21 individuals before and during antibiotics (magenta) and then through 3 post-antibiotics recovery groups: spontaneous recovery (blue, n = 7), autologous FMT performed on day 0 (yellow, n = 6) or probiotic supplementation between days 0 and 28 (green, n = 8). (The green horizontal line denotes the end of the supplementation period.) a, Bray–Curtis dissimilarities and incremental area under the curve (AUC) to each individual’s baseline (all baseline samples), based on ARG subtypes. Recovery probiotics versus spontaneous P = 0.0063, probiotics versus FMT P = 0.0063; follow-up probiotics versus spontaneous P = 0.0264, probiotics versus FMT P = 0.0238. b, Same as a but observed ARG subtypes. AUC (×100) values were divided by 100 for presentation purposes. ch, Comparison of ARG-based (subtypes) alpha diversity metrics for observed ARGs (c,e,g) or Shannon diversity index (d,f,h) in lower GI tract samples of participants in the FMT (c,d), spontaneous recovery (e,f) or probiotics (g,h) group. c, FMT all samples P = 0.0003, lumen P = 0.024, mucosa P = 0.0026. d, FMT all samples P = 0.0024, lumen P = 0.031, mucosa P = 0.04. e, Spontaneous all samples P = 0.044. f, Spontaneous all samples P = 0.029, lumen P = 0.0446. g, Probiotics mucosa P = 0.015. h, Probiotics mucosa P = 0.038. i, Abundance of the vanG gene in the endoscopic samples of each group after antibiotics and after 21 d of recovery. Probiotics recovery versus antibiotics P < 0.0001, probiotics versus FMT P < 0.0001. j,k, Bacterial species (C. citroniae, j; Blautia sp003287895, k) significantly (P < 0.0001) correlated (Spearman) with vanG abundance in endoscopic samples. *P < 0.05, **P < 0.01, ***P < 0.001, ****P < 0.0001. One-way ANOVA and Sidak’s test (a), two-way ANOVA and Sidak’s (i) or Dunnett’s test (i) or two-sided Mann–Whitney U-test (all the rest). The horizontal lines represent the median, the symbols represent the mean (a,b main panels), the error bands represent the s.e.m. (a,b main panels) and the whiskers represent the 10–90 percentiles. Source data
Fig. 5
Fig. 5. Probiotics expand the GI tract resistome in antibiotic-treated mice.
a, Experimental design. Wild-type adult (10-week-old) male C57BL/6J mice were treated with ciprofloxacin and metronidazole in their drinking water for 2 weeks followed by either daily supplementation by oral gavage with a probiotic supplement (Bio-25; green), autologous FMT performed after the last day of antibiotics (yellow) or spontaneous recovery (blue). The three groups were killed after 28 d of recovery and a fourth group was killed immediately after antibiotics (magenta). A fifth control group was untreated throughout the 42-d experimental period (grey). From the original experiment, which included 10 mice per group, we randomly selected 5 mice (spanning both cages per group) and performed shotgun metagenomic sequencing and resistome profiling of caecal and distal colon luminal content using ShortBRED and CARD after subsampling to 1.5 M of reads. Results are based on ARG families. b, Bray–Curtis dissimilarities. PC1 antibiotics versus control P = 0.0317, probiotics versus control P = 0.0317, probiotics versus spontaneous P = 0.0317. c,d, Shannon alpha diversity in the caecum lumen (c) or distal colon lumen (d). The antibiotics group was not included in the distal colon panel because four samples were under the subsampling threshold. c, Probiotics versus spontaneous recovery P = 0.0317; probiotics versus control P = 0.0317; control versus antibiotics P = 0.0317. e, Abundance of the vanSD gene cluster in the different groups and its Spearman correlation with B. producta abundance. f,g, MGEs significantly (P < 0.0001) correlated (Spearman) with vanSD abundance. f, Integrase, Blautia sp. YL58. g, IS-10 family transposase, B. producta. *P < 0.05; ***P < 0.001; ****P < 0.0001, two-sided Mann–Whitney U-test. The horizontal lines represent the median and the whiskers represent the 10–90 percentiles. RPKM, reads per kilobase of reference sequence per million sample reads. Source data
Extended Data Fig. 1
Extended Data Fig. 1. Stool samples do not represent the gastrointestinal resistome in antibiotics-naïve and treated individuals.
Fifteen men and women provided stool samples, and underwent a session of colonoscopy, during which luminal aspirates were collected from the terminal ileum, cecum, and descending colon; and mucosal brushes were collected from the cecum, ascending colon, transverse colon, descending colon, sigmoid colon, and rectum. As a validation to the analysis in Fig. 1, metagenomic sequences were subsampled to 1.5 M reads, resulting in 66 stool (blue), 29 lower GI luminal aspirates (light green), 14 terminal ileum luminal aspirates (peach), and 39 lower GI mucosal brush (dark green) samples analyzed using ShortBRED & CARD for identifying and quantifying ARGs. a, Bray-Curtis dissimilarity of stool and endoscopic samples, based on ARG families. PC1 stool vs. TI lumen P = 0.002,, stool vs. lower GI mucosa P = 0.025, stool vs. lower GI lumen P < 0.0001; PC2 stool vs. lower GI mucosa P = 0.0175. b, Bray-Curtis dissimilarity to stool in samples from the TI lumen (P = 0.0139), lower GI mucosa (P = 0.0187), and lower GI lumen (P = 0.0027), based on ARG families. c, Observed ARGs ‘subtypes’ (ARG-OAP v2.0, alpha diversity) is lower in stool compared to the lower GI mucosa (P = 0.0012) and lower GI lumen (P = 0.0008). d, Observed ARGs using CARD & ShortBRED is lower in stool compared to TI lumen (P = 0.0213), lower GI mucosa (P = 0.0027), lower GI lumen (P = 0.0016). e, Abundance of drug classes per region. f, Drug classes significantly overrepresented in the GI (red) or stool (blue). Colored circles represent P < 0.05 (FDR-corrected two-sided Mann-Whitney). g, Observed genera (alpha diversity), rarefied to 2 M reads, is higher in stool compared to TI lumen (P < 0.0001), lower GI mucosa (P = 0.0015), and lower GI lumen (P < 0.0001). h, Spearman correlation (P < 0.0001) of Escherichia abundance with observed drug class. *, P < 0.05; **, P < 0.01; ***, P < 0.001; ****, P < 0.0001, Kruskal-Wallis & Dunn’s. Horizontal lines represent the median, whiskers 10-90 percentiles. GI, gastrointestinal tract; TI, terminal ileum. Source data
Extended Data Fig. 2
Extended Data Fig. 2. Probiotics-associated reduction in gut resistome is person-specific.
Ten men and women provided stool samples before, after, and during 28 days of supplementation with a commercial probiotic supplement; two colonoscopies were performed, immediately before supplementation started, and on day 21 of supplementation. Metagenomic sequences were analyzed using ShortBRED & CARD for identification of ARGs, subsampled to 1.5 M reads. Results are based on ARGs. a, Bray-Curtis dissimilarity of stool samples to all baseline samples of each individual. The light green shade indicates the supplementation period. Day 1 of supplementation vs. baseline P = 0.0155. b, Observed ARGs in stool over time (P = 0.0014). c, Bray-Curtis dissimilarity of ARGs in all lower GI endoscopic samples (luminal aspirates and mucosal brushes) collected before (grey) or during supplementation (day 21, green). d, Same as C but color-coded according to probiotics colonization permissiveness (purple, N = 6) or resistance (orange, N = 4) and timepoint (before, light; during, dark). PC1 baseline P = 0.0472, during P = 0.01; PC2 baseline P < 0.0001. e, Per-person Bray-Curtis dissimilarity to baseline calculated in all participants or in the two subsets (P = 0.038). f-g, Alpha diversity measurements (f) observed ARGs or g, Shannon diversity in endoscopic samples of permissive and resistant individuals, compared either to the baseline of each subset or between subsets. In G, lumen, permissive P = 0.0188. *, P < 0.05; **, P < 0.01; ****, P < 0.0001, Two-Way ANOVA & Dunnett (a-b) or Sidak (f-g), or two-sided Mann-Whitney (all the rest). Horizontal lines represent the median, symbols represent mean, error bands SEM (A-B), whiskers 10-90 percentiles. Source data
Extended Data Fig. 3
Extended Data Fig. 3. Antibiotics expand the resistome in the lower GI lumen.
a, Experimental design of antibiotics treatment and follow-up arms. Validation analysis with ShortBRED-CARD and subsampled to 1.5 M. a-c, Stool samples were collected from 21 individuals for seven days before (grey) and seven days during (magenta) a course of ciprofloxacin and metronidazole. a, Bray-Curtis dissimilarities, based on ARG families (PC1 P < 0.0001). b-c, Paired comparison of alpha diversity (b) observed ARGs or c, Shannon diversity. In B-C, each point represents the average of all baseline or antibiotics days for each individual. d-f, The 21 participants underwent endoscopy immediately after 7 days of antibiotics (magenta). We compared their resistome to individuals undergoing endoscopy without any treatment (N = 15, grey). d, Bray-Curtis dissimilarities of ARG families (PC1 lumen P < 0.0001; PC2 lumen P = 0.0007). f-g, Alpha diversity (e) observed ARGs (P = 0.0005) or f, Shannon diversity (lumen P < 0.0001; mucosa P = 0.0191). *, P < 0.05; ***, P < 0.001; ****, P < 0.0001, two-sided Mann-Whitney. Horizontal lines represent the median, symbols mean, whiskers 10-90 percentiles. Source data
Extended Data Fig. 4
Extended Data Fig. 4. Probiotics expand the resistome in the GI mucosa after antibiotics.
Longitudinal follow-up of resistome (analyzed using ShortBRED & CARD, subsampled to 2 M reads) in stool samples of 21 individuals before and during antibiotics (magenta), and then through 3 post-antibiotics recovery groups: spontaneous recovery (blue, N = 7), autologous fecal microbiome transplantation (FMT) performed on day 0 (yellow, N = 6), or probiotics supplementation between days 0-28 (green, N = 8) (green horizontal line denotes end of supplementation period). Results based on ARGs. a, Bray-Curtis dissimilarities and incremental area under the curve to each individual’s baseline. Recovery probiotics vs. spontaneous P = 0.0088, probiotics vs. FMT P = 0.0055; follow-up probiotics vs. spontaneous P = 0.0426, probiotics vs. FMT P = 0.0385. b, Same as A but observed ARGs. c-h, Comparison of alpha diversity metrics observed ARGs (c, e, g) or Shannon Diversity (d, f, h) in lower GI samples of participants (analyzed using ShortBRED & CARD, subsampled to 1.5 M) in the FMT (c-d), spontaneous recovery (e-f), or probiotics (g-h) group. c, FMT all samples P = 0.001, Lumen P = 0.0329, Mucosa P = 0.0193. d, FMT all samples P = 0.001, Lumen P = 0.0041, Mucosa P = 0.0281. f, Spontaneous all samples P = 0.0092, lumen P = 0.0246. g, Probiotics mucosa P = 0.0388. *, P < 0.05, **, P < 0.01, One-Way ANOVA & Sidak (a), or two-sided Mann-Whitney (all the rest). Horizontal lines represent the median, symbols mean (a-b main panels), error bands SEM (a-b main panels), whiskers 10-90 percentiles. Source data
Extended Data Fig. 5
Extended Data Fig. 5. Comparison of methods for detecting ARGs in metagenomic samples.
Whole-genome shotgun metagenomics sequencing was performed on eighteen pills of the Bio25 probiotic supplement from different batches. We quantified the abundance of ARG types (detected by genome assembly, see Methods) using 4 ARG pipelines and different subsampling sizes (1.5 M, 3 M and 6 M reads): a, ARG_OAP v2.0, using Hidden Markov Models and the SARG 2.0 database. b, shortBRED, combined with the CARD database, and based on unique peptide sequences for each ARG family. c, DeepARG-DB. d, variation graph method, GROOT, in combination with the CARD database. e, Bray-Curtis dissimilarity to baseline (1.5 M) between the 18 pills when analyzed with the different pipelines and subsampled to 6 M. f, Observed ARG types in each method and subsampling depth. g-j, Same as A-D but ARG abundances are reported as ARG read count per total reads; subsampled to 1.5 M reads. k-n, Same as G-J but subsampled to 3 M reads. Horizontal lines represent the median, whiskers 10-90 percentiles, error bars SEM. RPKM, reads per kilobase of reference sequence per million sample reads. Source data
Extended Data Fig. 6
Extended Data Fig. 6. ARG diversity in different probiotics pills.
Single-end shotgun metagenomics sequencing was performed on 4 commercially available probiotic products (Bio25, Culturelle, Nexabiotic and VSL#3; 3 pills per product). Resistome profile was quantified using shortBRED, combined with the CARD database: a, Abundance of ARG families correlated with the number of strains in the supplement. b, Observed ARG families. Presence of Bio25-ARGs (detected by genome assembly, see Methods) in NCBI strain genomes of the Bio-25 species and other species from the same genera: c, Percentage of NCBI strains from the Bio-25 species containing an ARG. d, Percentage of NCBI strains from other species of the Bio-25 genera containing an ARG. Source data
Extended Data Fig. 7
Extended Data Fig. 7. Effect of probiotics and antibiotics on resistome in publicly available datasets.
Stool resistome profile of 3 published articles analyzed using shortBRED and CARD database (results based on ARGs): a-b, Study of sailors on long sea voyage treated with placebo (blue) or probiotics (samples at the end of the voyage, red); c-f, Cohort of 22 participants treated with placebo or probiotics (samples at baseline in dark red, last day of probiotics consumption in red, and 20-week follow-up in light red); g-i, Cohort of patients with diabetes treated with placebo (blue) or probiotics (red) after 1-week antibiotics treatment (samples at baseline are dark colored, after antibiotics and after 3-month intervention are light colored). (a,c,d,e,g,i, Beta diversity based on Bray Curtis dissimilarities. b,f,h, Observed ARGs. d, Persistence vs. treatment P = 0.0068. g, Probiotics baseline vs. antibiotics P = 0.007. **, P < 0.01, two-sided Mann-Whitney. Horizontal lines represent the median, symbols mean, whiskers 10-90 percentiles, error bars SEM. Source data

Similar articles

Cited by

References

    1. No Time to Wait: Securing the Future from Drug-Resistant Infections. Report to the Secretary-General of the United Nations (Interagency Coordination Group on Antimicrobial Resistance, 2019).
    1. Sommer MOA, Dantas G, Church GM. Functional characterization of the antibiotic resistance reservoir in the human microflora. Science. 2009;325:1128–1131. doi: 10.1126/science.1176950. - DOI - PMC - PubMed
    1. Gasparrini AJ, et al. Persistent metagenomic signatures of early-life hospitalization and antibiotic treatment in the infant gut microbiota and resistome. Nat. Microbiol. 2019;4:2285–2297. doi: 10.1038/s41564-019-0550-2. - DOI - PMC - PubMed
    1. Campbell TP, et al. The microbiome and resistome of chimpanzees, gorillas, and humans across host lifestyle and geography. ISME J. 2020;14:1584–1599. doi: 10.1038/s41396-020-0634-2. - DOI - PMC - PubMed
    1. Launay A, Ballard SA, Johnson PDR, Grayson ML, Lambert T. Transfer of vancomycin resistance transposon Tn1549 from Clostridium symbiosum to Enterococcus spp. in the gut of gnotobiotic mice. Antimicrob. Agents Chemother. 2006;50:1054–1062. doi: 10.1128/AAC.50.3.1054-1062.2006. - DOI - PMC - PubMed

Publication types

MeSH terms