

SpaceM reveals metabolic states of single cells
- PMID: 34226721
- PMCID: PMC7611214
- DOI: 10.1038/s41592-021-01198-0
SpaceM reveals metabolic states of single cells
Abstract
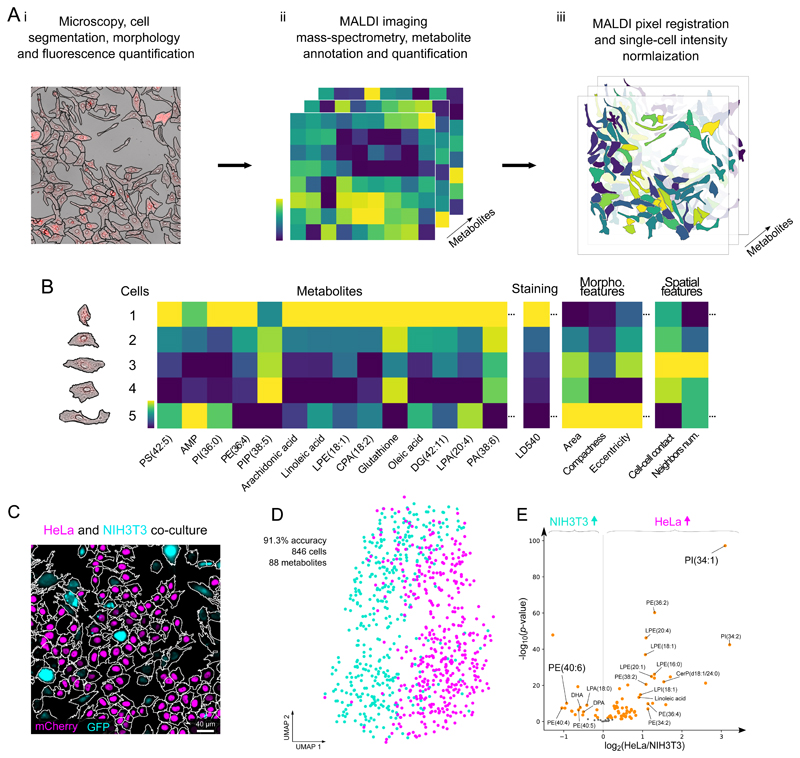
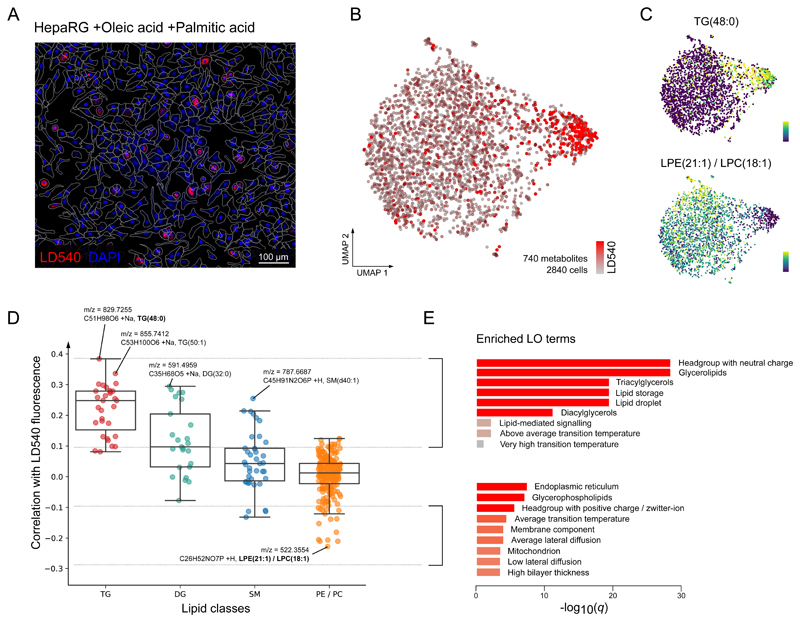
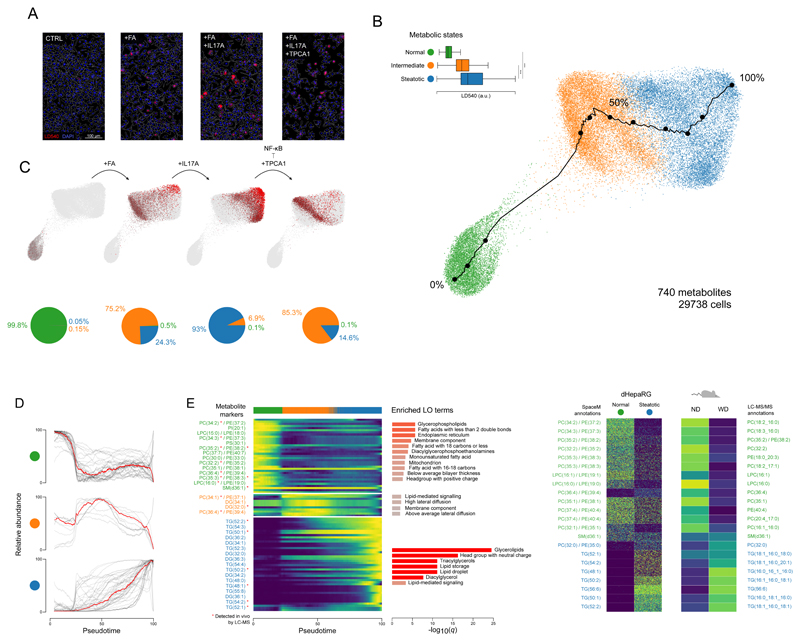
A growing appreciation of the importance of cellular metabolism and revelations concerning the extent of cell-cell heterogeneity demand metabolic characterization of individual cells. We present SpaceM, an open-source method for in situ single-cell metabolomics that detects >100 metabolites from >1,000 individual cells per hour, together with a fluorescence-based readout and retention of morpho-spatial features. We validated SpaceM by predicting the cell types of cocultured human epithelial cells and mouse fibroblasts. We used SpaceM to show that stimulating human hepatocytes with fatty acids leads to the emergence of two coexisting subpopulations outlined by distinct cellular metabolic states. Inducing inflammation with the cytokine interleukin-17A perturbs the balance of these states in a process dependent on NF-κB signaling. The metabolic state markers were reproduced in a murine model of nonalcoholic steatohepatitis. We anticipate SpaceM to be broadly applicable for investigations of diverse cellular models and to democratize single-cell metabolomics.
Conflict of interest statement
L.R. and T.A. are the inventors on a patent application describing a spatial single-cell metabolomics method (application in the E.U. EP3610267A1, U.S. US20200057049A1, Canada CA3059818A1, Australia AU2018252185A1, World Intellectual Property Organization (Patent Cooperation Treaty) WO2018189365A1).
Figures
Similar articles
-
Development of a Single-Cell Spatial Metabolomics Method for the Characterization of Cell-Cell Metabolic Interactions.Anal Chem. 2025 Apr 15;97(14):7986-7994. doi: 10.1021/acs.analchem.5c00384. Epub 2025 Apr 4. Anal Chem. 2025. PMID: 40184576
-
SphK1 mediates hepatic inflammation in a mouse model of NASH induced by high saturated fat feeding and initiates proinflammatory signaling in hepatocytes.J Lipid Res. 2015 Dec;56(12):2359-71. doi: 10.1194/jlr.M063511. Epub 2015 Oct 19. J Lipid Res. 2015. PMID: 26482537 Free PMC article.
-
De novo discovery of metabolic heterogeneity with immunophenotype-guided imaging mass spectrometry.Mol Metab. 2020 Jun;36:100953. doi: 10.1016/j.molmet.2020.01.017. Epub 2020 Feb 14. Mol Metab. 2020. PMID: 32278304 Free PMC article.
-
Metabolic Imaging at the Single-Cell Scale: Recent Advances in Mass Spectrometry Imaging.Annu Rev Anal Chem (Palo Alto Calif). 2019 Jun 12;12(1):201-224. doi: 10.1146/annurev-anchem-061318-115516. Epub 2019 Mar 8. Annu Rev Anal Chem (Palo Alto Calif). 2019. PMID: 30848927 Review.
-
Analytical techniques for single-cell metabolomics: state of the art and trends.Anal Bioanal Chem. 2010 Nov;398(6):2493-504. doi: 10.1007/s00216-010-3850-1. Epub 2010 Jun 11. Anal Bioanal Chem. 2010. PMID: 20544183 Review.
Cited by
-
Spatiotemporal metabolomic approaches to the cancer-immunity panorama: a methodological perspective.Mol Cancer. 2024 Sep 18;23(1):202. doi: 10.1186/s12943-024-02113-9. Mol Cancer. 2024. PMID: 39294747 Free PMC article. Review.
-
Emerging Computational Methods in Mass Spectrometry Imaging.Adv Sci (Weinh). 2022 Dec;9(34):e2203339. doi: 10.1002/advs.202203339. Epub 2022 Oct 17. Adv Sci (Weinh). 2022. PMID: 36253139 Free PMC article. Review.
-
Mass spectrometry imaging methods for visualizing tumor heterogeneity.Curr Opin Biotechnol. 2024 Apr;86:103068. doi: 10.1016/j.copbio.2024.103068. Epub 2024 Feb 7. Curr Opin Biotechnol. 2024. PMID: 38310648 Free PMC article. Review.
-
Advances in Mass Spectrometry-Based Single Cell Analysis.Biology (Basel). 2023 Mar 2;12(3):395. doi: 10.3390/biology12030395. Biology (Basel). 2023. PMID: 36979087 Free PMC article. Review.
-
Spatial genomics: mapping human steatotic liver disease.Nat Rev Gastroenterol Hepatol. 2024 Sep;21(9):646-660. doi: 10.1038/s41575-024-00915-2. Epub 2024 Apr 23. Nat Rev Gastroenterol Hepatol. 2024. PMID: 38654090 Review.
References
Publication types
MeSH terms
Substances
Grants and funding
LinkOut - more resources
Full Text Sources
Molecular Biology Databases
