. 2021 Nov-Dec;42(6):1568-1590.
doi: 10.1002/oca.2748. Epub 2021 Jun 2.

Analysis of COVID-19 and comorbidity co-infection model with optimal control

Affiliations

Analysis of COVID-19 and comorbidity co-infection model with optimal control

Andrew Omame et al. Optim Control Appl Methods. 2021 Nov-Dec.

Abstract

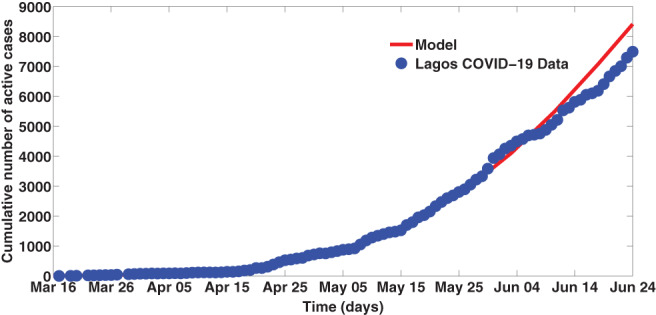
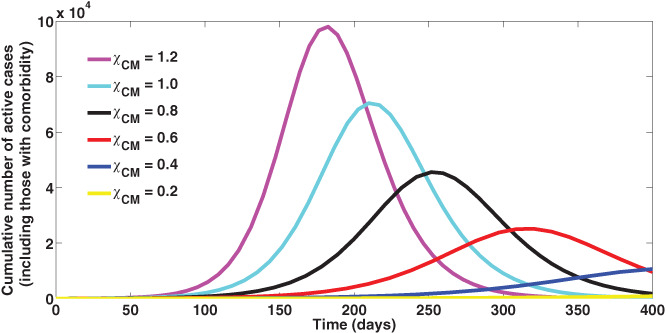
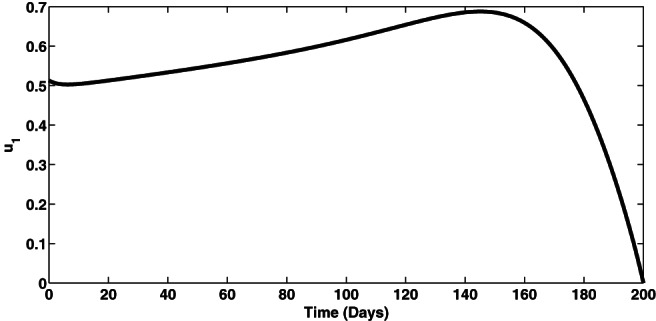
In this work, we develop and analyze a mathematical model for the dynamics of COVID-19 with re-infection in order to assess the impact of prior comorbidity (specifically, diabetes mellitus) on COVID-19 complications. The model is simulated using data relevant to the dynamics of the diseases in Lagos, Nigeria, making predictions for the attainment of peak periods in the presence or absence of comorbidity. The model is shown to undergo the phenomenon of backward bifurcation caused by the parameter accounting for increased susceptibility to COVID-19 infection by comorbid susceptibles as well as the rate of reinfection by those who have recovered from a previous COVID-19 infection. Simulations of the cumulative number of active cases (including those with comorbidity), at different reinfection rates, show infection peaks reducing with decreasing reinfection of those who have recovered from a previous COVID-19 infection. In addition, optimal control and cost-effectiveness analysis of the model reveal that the strategy that prevents COVID-19 infection by comorbid susceptibles is the most cost-effective of all the control strategies for the prevention of COVID-19.

Keywords: COVID‐19; comorbidity; data‐fitting; optimal control; reinfection.


Conflict of interest statement

The authors declare that they have no conflict of interests.

Figures

FIGURE 1
FIGURE 1
Schematic diagram of the model (1) where λCV=βCV(ICV+ICVCM)NH
FIGURE 2
FIGURE 2
Bifurcation diagram for the model (1). Parameter values used are: βCV=0.148,ψ1=25,ψ2=40,χCM=1.2. All other parameters as in Table 1
FIGURE 3
FIGURE 3
Fitting the cumulative number of active cases
FIGURE 4
FIGURE 4
Projections for the cumulative number of active cases
FIGURE 5
FIGURE 5
Simulations of the Cumulative number of active cases (including those with comorbidity): effect of χCM
FIGURE 6
FIGURE 6
Simulations of the Cumulative number of active cases (without comorbidity): effect of χCM
FIGURE 7
FIGURE 7
Simulations of the Cumulative number of active cases (including those with comorbidity): effect of ψ1 and ψ2
FIGURE 8
FIGURE 8
Simulations of the Cumulative number of active cases (without comorbidity): effect of ψ1 and ψ2
FIGURE 9
FIGURE 9
Contour plots of 0C. Here, βCV=0.2001, ψ1=ψ2=0.4. All other parameters as in Table 1. (A) A contour plot of 0C as a function of detection rate for singly infected individuals (η1) and detection rate for co‐infected individuals (η2). (B) A contour plot of 0C as a function of detection rate for singly infected individuals (η1 and the modification parameter for high susceptibility of those with comorbidity χCM)
FIGURE 10
FIGURE 10
Plots of the total number of COVID‐19‐infected individuals when strategy A is implemented (u 1 ≠ 0). Here, βCV=0.2001, ψ1=ψ2=0.4. All other parameters as in Table 1
FIGURE 11
FIGURE 11
Control profile for the effect of the control u 1 on the dynamics of the model (1). Here, βCV=0.2001, ψ1=ψ2=0.4. All other parameters as in Table 1
FIGURE 12
FIGURE 12
Plots of the total number of COVID‐19‐infected individuals when strategy B is implemented (u 2 ≠ 0). Here, βCV=0.2001, ψ1=ψ2=0.4. All other parameters as in Table 1
FIGURE 13
FIGURE 13
Control profile for the effect of the control u 2 on the dynamics of the model (1). Here, βCV=0.2001, ψ1=ψ2=0.4. All other parameters as in Table 1
FIGURE 14
FIGURE 14
Plots of the total number of COVID‐19‐infected individuals when strategy C is implemented (u 3 ≠ 0). Here, βCV=0.2001, ψ1=ψ2=0.4. All other parameters as in Table 1
FIGURE 15
FIGURE 15
Control profile for the effect of the control u 3 on the dynamics of the model (1). Here, βCV=0.2001, ψ1=ψ2=0.4. All other parameters as in Table 1

References

    1. Lai C‐C, Wang C‐Y, Hsueh P‐R. Co‐infections among patients with COVID‐19: the need for combination therapy with non‐anti‐SARS‐CoV‐2 agents. J Microbiol Immunol Infect. 2020. 10.1016/j.jmii.2020.05.013. - DOI - PMC - PubMed
    1. Cucinotta D, Vanelli M. WHO declares COVID‐19 a pandemic. Acta Biomed. 2020;91(1):157‐160. 10.23750/abm.v91i1.9397. - DOI - PMC - PubMed
    1. Dong E, Du H, Gardner L. Coronavirus COVID‐19 global cases by Johns Hopkins CSSE. Lancet Infect Dis. 2020. https://gisanddata.maps.arcgis.com/apps/opsdashboard/index.html/bda75947....
    1. Woelfel R, Corman VM, Guggemos W, et al. Clinical presentation and virological assessment of hospitalized cases of coronavirus disease 2019 in a travel‐associated transmission cluster. medRXiv March 8, 2020.
    1. Bai Y, Yao L, Wei T, et al. Presumed asymptomatic carrier transmission of COVID‐19. JAMA. 2020. - PMC - PubMed

LinkOut - more resources