

Transboundary sources dominated PM2.5 in Thimphu, Bhutan
- PMID: 34226828
- PMCID: PMC8243619
- DOI: 10.1007/s13762-021-03505-w
Transboundary sources dominated PM2.5 in Thimphu, Bhutan
Abstract
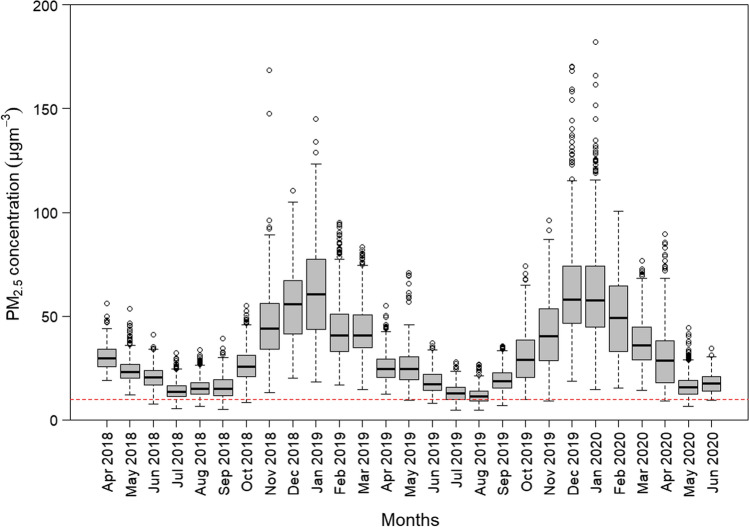
This study estimates the potential source regions contributing to PM2.5 in the capital city of Thimphu, Bhutan, during the years 2018-2020 using the ground-based data, followed by the HYSPLIT back trajectory analysis. The average PM2.5 concentration in the entire study period was 32.47 µg/m3 which is three times of the World Health Organization recommended limit of 10 µg/m3. Less than half of the days in pre-monsoon (43.47%) and post-monsoon (46.41%), and no days in winter were within the 24-h average WHO guideline of 25 μg/m3. During the COVID-19 lockdown imposed from August 11 to September 21 in Bhutan, only a marginal reduction of 4% in the PM2.5 concentrations was observed, indicating that nonlocal emissions dominate the PM2.5 concentrations in Thimphu, Bhutan. Most back trajectories in the analysis period were allocated to south or south-west sector. India was the major contributor (~ 44%), followed by Bangladesh (~ 19%), Bhutan itself (~ 19%) and China (~ 16%). This study confirms that there are significant contributions from transboundary sources to PM2.5 concentrations in Thimphu, Bhutan, and the elevated PM2.5 concentrations need to be tackled with appropriate action plans and interventions.
Keywords: Bhutan; HYSPLIT; PM2.5; Source regions; Transboundary sources.
© Islamic Azad University (IAU) 2021.
Conflict of interest statement
Conflict of interestThe authors declare that they have no conflict of interest.
Figures


References
-
- BMCI (2016) Bhutan Climate + Change Bhutan Media and Communications Institute
-
- Carslaw DC, Ropkins K. openair—an R package for air quality data analysis. Environ Model Softw. 2012;27–28:52–61. doi: 10.1016/j.envsoft.2011.09.008. - DOI
-
- Cheng I, Zhang L, Blanchard P, Dalziel J, Tordon R. 2013. Concentration-weighted trajectory approach to identifying potential sources of speciated atmospheric mercury at an urban coastal site in Nova Scotia, Canada. Atmos Chem Phys. - DOI
LinkOut - more resources
Full Text Sources