

Comparative performance of SARS-CoV-2 lateral flow antigen tests and association with detection of infectious virus in clinical specimens: a single-centre laboratory evaluation study
- PMID: 34226893
- PMCID: PMC8245061
- DOI: 10.1016/S2666-5247(21)00143-9
Comparative performance of SARS-CoV-2 lateral flow antigen tests and association with detection of infectious virus in clinical specimens: a single-centre laboratory evaluation study
Erratum in
-
Correction to Lancet Microbe 2021; published online June 29. https://doi.org/10.1016/S2666-5247(21)00143-9.Lancet Microbe. 2021 Sep;2(9):e426. doi: 10.1016/S2666-5247(21)00210-X. Epub 2021 Aug 3. Lancet Microbe. 2021. PMID: 34368793 Free PMC article.
Abstract
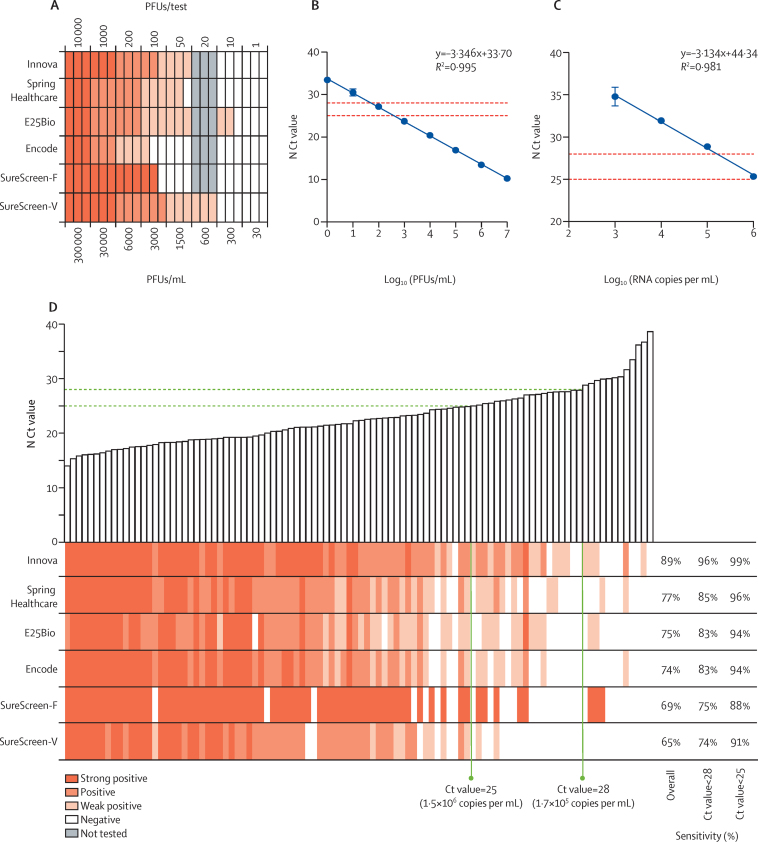
Background: Lateral flow devices (LFDs) for rapid antigen testing are set to become a cornerstone of SARS-CoV-2 mass community testing, although their reduced sensitivity compared with PCR has raised questions of how well they identify infectious cases. Understanding their capabilities and limitations is, therefore, essential for successful implementation. We evaluated six commercial LFDs and assessed their correlation with infectious virus culture and PCR cycle threshold (Ct) values.
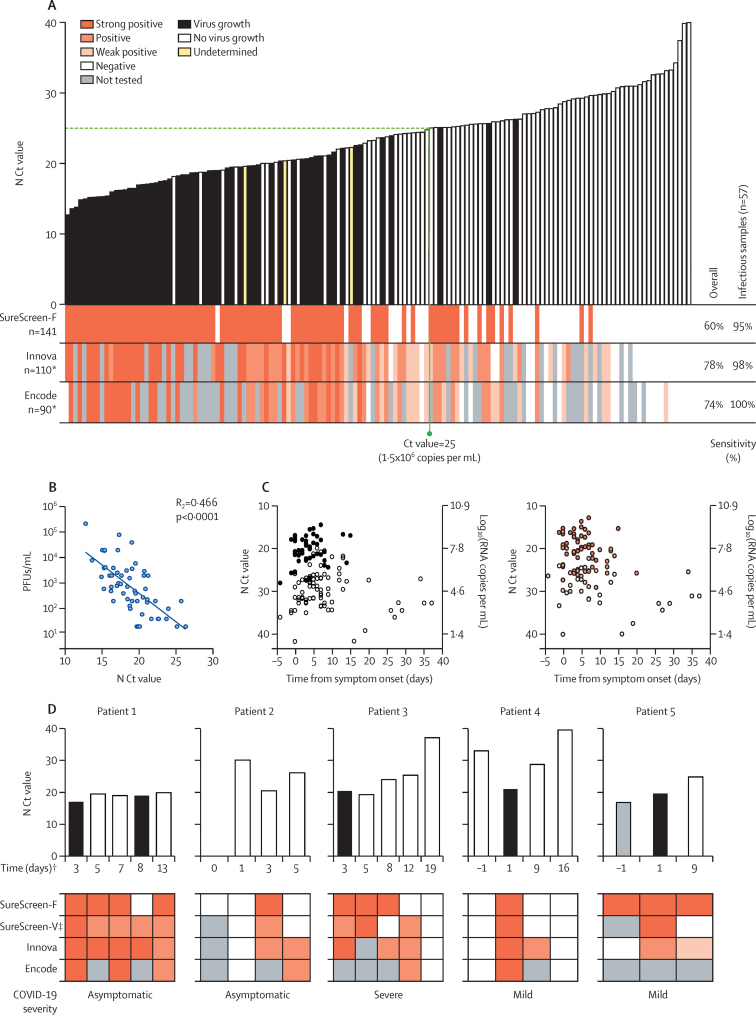
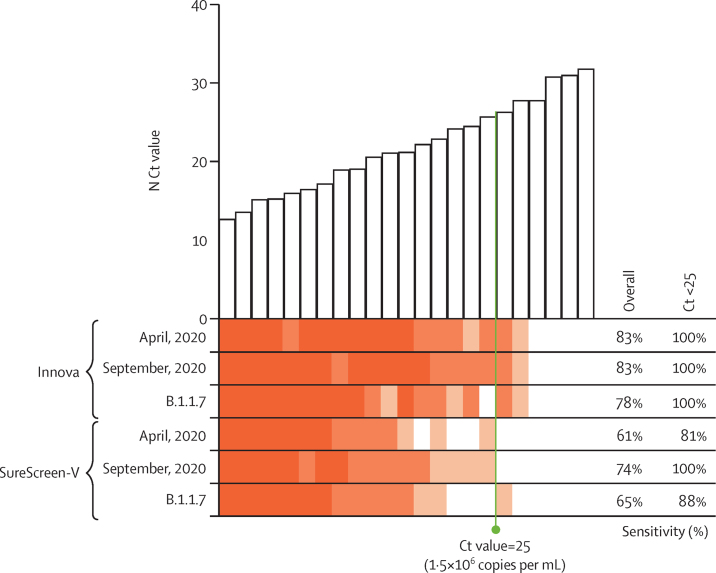
Methods: In a single-centre, laboratory evaluation study, we did a head-to-head comparison of six LFDs commercially available in the UK: Innova Rapid SARS-CoV-2 Antigen Test, Spring Healthcare SARS-CoV-2 Antigen Rapid Test Cassette, E25Bio Rapid Diagnostic Test, Encode SARS-CoV-2 Antigen Rapid Test Device, SureScreen COVID-19 Rapid Antigen Test Cassette, and SureScreen COVID-19 Rapid Fluorescence Antigen Test. We estimated the specificities and sensitivities of the LFDs using stored naso-oropharyngeal swabs collected at St Thomas' Hospital (London, UK) for routine diagnostic SARS-CoV-2 testing by real-time RT-PCR (RT-rtPCR). Swabs were from inpatients and outpatients from all departments of St Thomas' Hospital, and from health-care staff (all departments) and their household contacts. SARS-CoV-2-negative swabs from the same population (confirmed by RT-rtPCR) were used for comparative specificity determinations. All samples were collected between March 23 and Oct 27, 2020. We determined the limit of detection (LOD) for each test using viral plaque-forming units (PFUs) and viral RNA copy numbers of laboratory-grown SARS-CoV-2. Additionally, LFDs were selected to assess the correlation of antigen test result with RT-rtPCR Ct values and positive viral culture in Vero E6 cells. This analysis included longitudinal swabs from five infected inpatients with varying disease severities. Furthermore, the sensitivities of available LFDs were assessed in swabs (n=23; collected from Dec 4, 2020, to Jan 12, 2021) confirmed to be positive (RT-rtPCR and whole-genome sequencing) for the B.1.1.7 variant, which was the dominant genotype in the UK at the time of study completion.
Findings: All LFDs showed high specificity (≥98·0%), except for the E25Bio test (86·0% [95% CI 77·9-99·9]), and most tests reliably detected 50 PFU/test (equivalent SARS-CoV-2 N gene Ct value of 23·7, or RNA copy number of 3 × 10⁶/mL). Sensitivities of the LFDs on clinical samples ranged from 65·0% (55·2-73·6) to 89·0% (81·4-93·8). These sensitivities increased to greater than 90% for samples with Ct values of lower than 25 for all tests except the SureScreen fluorescence (SureScreen-F) test. Positive virus culture was identified in 57 (40·4%) of 141 samples; 54 (94·7%) of the positive cultures were from swabs with Ct values lower than 25. Among the three LFDs selected for detailed comparisons (the tests with highest sensitivity [Innova], highest specificity [Encode], and alternative technology [SureScreen-F]), sensitivity of the LFDs increased to at least 94·7% when only including samples with detected viral growth. Longitudinal studies of RT-rtPCR-positive samples (tested with Innova, Encode, and both SureScreen-F and the SureScreen visual [SureScreen-V] test) showed that most of the tests identified all infectious samples as positive. Test performance (assessed for Innova and SureScreen-V) was not affected when reassessed on swabs positive for the UK variant B.1.1.7.
Interpretation: In this comprehensive comparison of antigen LFDs and virus infectivity, we found a clear relationship between Ct values, quantitative culture of infectious virus, and antigen LFD positivity in clinical samples. Our data support regular testing of target groups with LFDs to supplement the current PCR testing capacity, which would help to rapidly identify infected individuals in situations in which they would otherwise go undetected.
Funding: King's Together Rapid COVID-19, Medical Research Council, Wellcome Trust, Huo Family Foundation, UK Department of Health, National Institute for Health Research Comprehensive Biomedical Research Centre.
© 2021 The Author(s). Published by Elsevier Ltd. This is an Open Access article under the CC BY-NC-ND 4.0 license.
Conflict of interest statement
We declare no competing interests.
Figures
References
-
- Crozier A, Rajan S, Buchan I, McKee M. Put to the test: use of rapid testing technologies for covid-19. BMJ. 2021;372:n208. - PubMed
-
- Deeks J, Raffle A, Gill M. Covid-19: government must urgently rethink lateral flow test roll out. Jan 12, 2021. https://blogs.bmj.com/bmj/2021/01/12/covid-19-government-must-urgently-r...
-
- Wise J. Covid-19: Lateral flow tests miss over half of cases, Liverpool pilot data show. BMJ. 2020;371 - PubMed
-
- Guglielmi G. Rapid coronavirus tests: a guide for the perplexed. Nature. 2021;590:202–205. - PubMed
Publication types
MeSH terms
Substances
Supplementary concepts
Grants and funding
LinkOut - more resources
Full Text Sources
Medical
Research Materials
Miscellaneous
