. 2021 Sep;64(9):2012-2025.
doi: 10.1007/s00125-021-05491-7. Epub 2021 Jul 6.

Polygenic risk scores predict diabetes complications and their response to intensive blood pressure and glucose control

Affiliations

Polygenic risk scores predict diabetes complications and their response to intensive blood pressure and glucose control

Johanne Tremblay et al. Diabetologia. 2021 Sep.

Erratum in

Abstract

Aims/hypothesis: Type 2 diabetes increases the risk of cardiovascular and renal complications, but early risk prediction could lead to timely intervention and better outcomes. Genetic information can be used to enable early detection of risk.

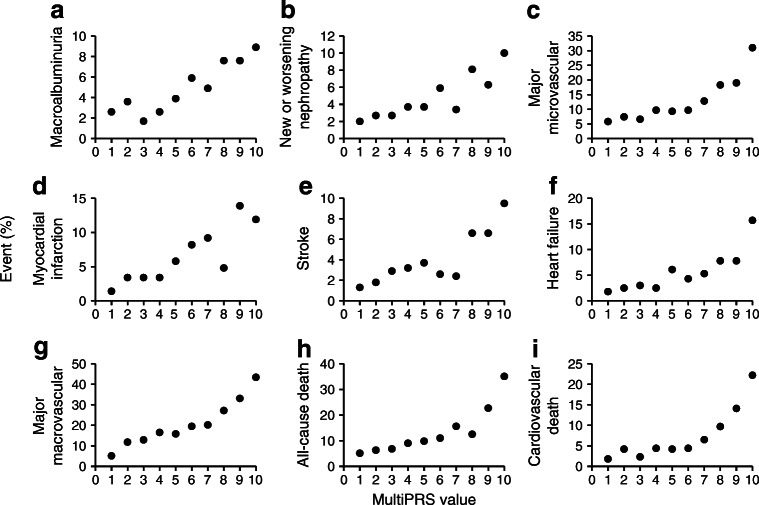
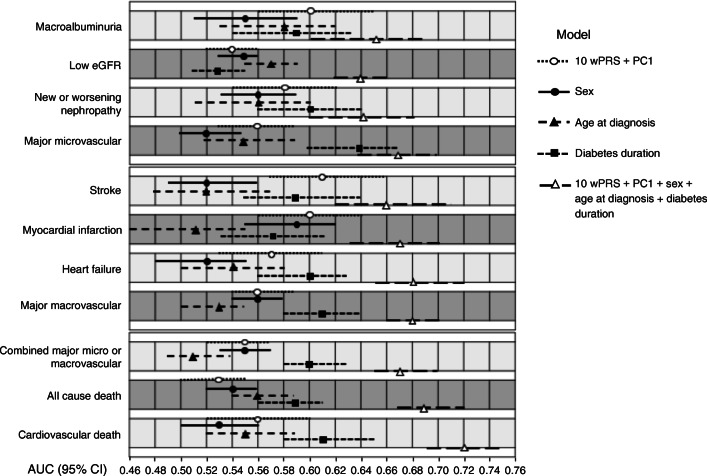
Methods: We developed a multi-polygenic risk score (multiPRS) that combines ten weighted PRSs (10 wPRS) composed of 598 SNPs associated with main risk factors and outcomes of type 2 diabetes, derived from summary statistics data of genome-wide association studies. The 10 wPRS, first principal component of ethnicity, sex, age at onset and diabetes duration were included into one logistic regression model to predict micro- and macrovascular outcomes in 4098 participants in the ADVANCE study and 17,604 individuals with type 2 diabetes in the UK Biobank study.

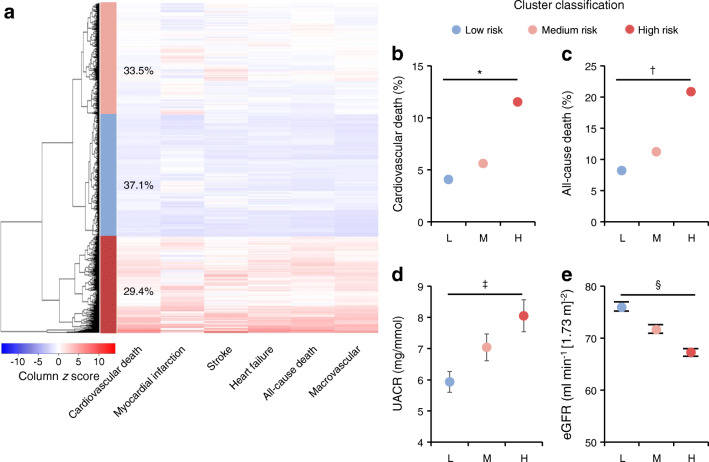
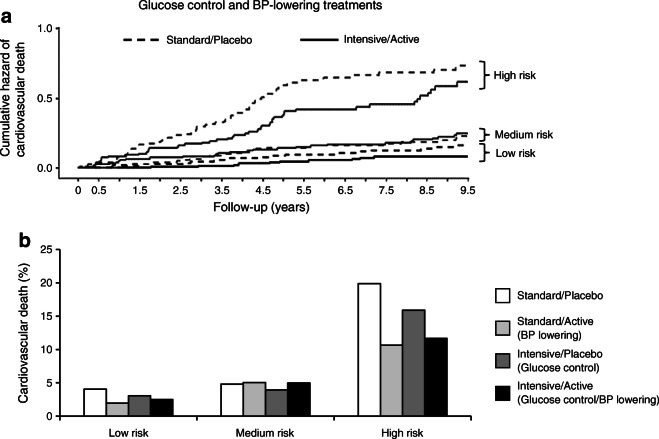
Results: The model showed a similar predictive performance for cardiovascular and renal complications in different cohorts. It identified the top 30% of ADVANCE participants with a mean of 3.1-fold increased risk of major micro- and macrovascular events (p = 6.3 × 10⁻²¹ and p = 9.6 × 10⁻³¹, respectively) and a 4.4-fold (p = 6.8 × 10⁻³³) higher risk of cardiovascular death. While in ADVANCE overall, combined intensive blood pressure and glucose control decreased cardiovascular death by 24%, the model identified a high-risk group in whom it decreased the mortality rate by 47%, and a low-risk group in whom it had no discernible effect. High-risk individuals had the greatest absolute risk reduction with a number needed to treat of 12 to prevent one cardiovascular death over 5 years.

Conclusions/interpretation: This novel multiPRS model stratified individuals with type 2 diabetes according to risk of complications and helped to target earlier those who would receive greater benefit from intensive therapy.

Keywords: ADVANCE trial; Cardiovascular complications; Genetics; Polygenic risk score; Prediction; Renal complications; UK Biobank.


Figures

Fig. 1
Fig. 1
(ai) Percentage of events along multiPRS deciles. ADVANCE participants were stratified into equal deciles along multiPRS scoring, from lowest to highest score. Each point represents the percentage of event occurrence in the decile
Fig. 2
Fig. 2
(ae) Clustering of combined macrovascular disease risk by multiPRS using unsupervised hierarchical clustering algorithm. This clustering method identified three main clusters of individuals with low (blue; L), medium (pink; M) or high (red; H) combined macrovascular risk representing 37.1%, 33.5% and 29.4%, respectively, of ADVANCE participants. (a) The multiPRS values for each participant and each outcome are represented by z score (blue colour: negative score, red colour: positive score) in the heat map. (b, c) The incidence (%) of cardiovascular (*p = 1.5 × 10−13) (b) and all-cause death (p = 1.8 × 10−21) (c) were compared between the high and the low clusters. (d, e) Differences in UACR (p = 1 × 10−4) (d) and eGFR (§p = 2 × 10−44) (e) values were determined between the high and the low clusters. eGFR is based on CKD-EPI formula
Fig. 3
Fig. 3
Contribution of genomic and non-genomic factors to the risk prediction model. AUCs (95% CI) are shown for incident complications (free of outcome at study entry). White circles indicate AUCs with genomic component 10 wPRS + PC1 only; black circles indicate AUCs with sex alone; black triangles represent AUCs with age at diagnosis alone; black squares are AUCs with diabetes duration alone; white triangles indicate AUCs of the full model. Upper section: microvascular and renal outcomes; middle section: macrovascular and cardiac outcomes; lower section: combined micro- and macrovascular outcomes and death
Fig. 4
Fig. 4
Frequency of major microvascular and macrovascular events by genomic (10wPRS + PC1) and age at onset of diabetes strata. ADVANCE participants were stratified into equal thirds of low, medium and high genomic risk strata and of <55, 55–63 and >63 years of age at diagnosis of diabetes. The control participants used are normotensive individuals with no major microvascular (a) and macrovascular (b) events at any time during the 4.5 year follow-up of the ADVANCE study. ORs were calculated between high and low genomic component of the multiPRS (OR 1.53 [95% CI 1.08, 2.17] p = 0.017) and between age at onset >63 years and <55 years (OR 0.61 [0.43, 0.87] p = 0.0057) for microvascular events. For macrovascular events, the ORs between high and low genomic component of the multiPRS were (OR 2.78 [2.02, 3.81] p = 2.6 × 10−10) and (OR 1.22 [0.91, 1.64] p = 0.19) between age at onset >64 years and <57 years. (c, d) The trend testing was done within formal regression analysis using parametric method separately for different age categories and genomic strata. Major macrovascular and major microvascular events are defined in the Methods
Fig. 5
Fig. 5
Cumulative hazard plots of cardiovascular death stratified by multiPRS strata and glucose and BP-lowering treatments. (a) Adjusted cumulative hazard curves for 9.5 year cardiovascular death by combined active BP and intensive glucose-lowering treatment arms in the high, medium and low multiPRS thirds. The control participants used are normotensive individuals. The effect of BP and glucose-lowering treatment was assessed using HRs and was significant for individuals included in the high-risk group (HR 0.61 [95% CI 0.40, 0.93], p = 0.021 at year 4.5 follow-up of ADVANCE trial, and HR 0.67 [0.47, 0.95], p = 0.023 at year 9.5 follow-up of ADVANCE-ON follow-up). (b) Frequency (%) of cardiovascular death in low, medium and high multiPRS risk strata and risk reduction by treatment arms in ADVANCE. The four treatment arms are Standard/Placebo, Standard/Active for BP lowering, Intensive/Placebo for glucose control and Intensive/Active for glucose control and BP lowering, respectively. The NNT is 64, p = 0.28 in the low multiPRS third compared with NNT 12, p = 0.0062 in the high-risk group for the combined therapy in ADVANCE

References

    1. The Emerging Risk Factors Collaboration Diabetes mellitus, fasting blood glucose concentration, and risk of vascular disease: a collaborative meta-analysis of 102 prospective studies. Lancet. 2010;375(9733):2215–2222. doi: 10.1016/S0140-6736(10)60484-9. - DOI - PMC - PubMed
    1. Jacobs E, Hoyer A, Brinks R, Kuss O, Rathmann W. Burden of mortality attributable to diagnosed diabetes: a nationwide analysis based on claims data from 65 million people in Germany. Diabetes Care. 2017;40(12):1703–1709. doi: 10.2337/dc17-0954. - DOI - PubMed
    1. American Diabetes Association 9. Cardiovascular disease and risk management: standards of medical care in diabetes—2018. Diabetes Care. 2018;41(Supplement 1):S86–S104. doi: 10.2337/dc18-S009. - DOI - PubMed
    1. Abraham G, Inouye M. Genomic risk prediction of complex human disease and its clinical application. Curr Opin Genet Dev. 2015;33:10–16. doi: 10.1016/j.gde.2015.06.005. - DOI - PubMed
    1. Läll K, Mägi R, Morris A, Metspalu A, Fischer K. Personalized risk prediction for type 2 diabetes: the potential of genetic risk scores. Genet Med. 2017;19(3):322–329. doi: 10.1038/gim.2016.103. - DOI - PMC - PubMed

Publication types

MeSH terms