

Phenotyping Cardiogenic Shock
- PMID: 34227396
- PMCID: PMC8483502
- DOI: 10.1161/JAHA.120.020085
Phenotyping Cardiogenic Shock
Abstract
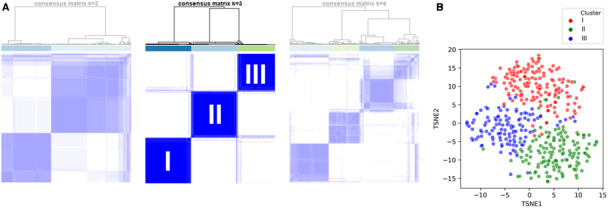
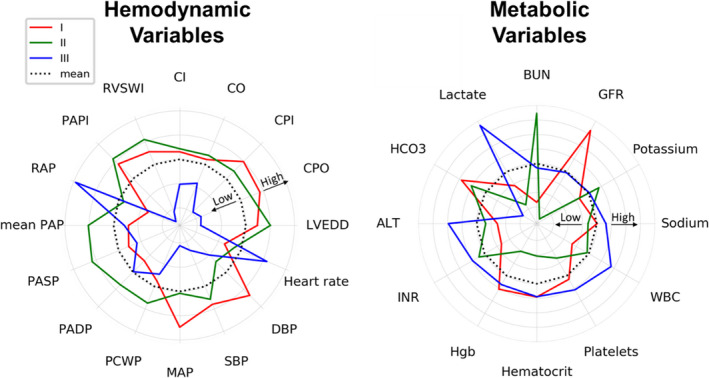
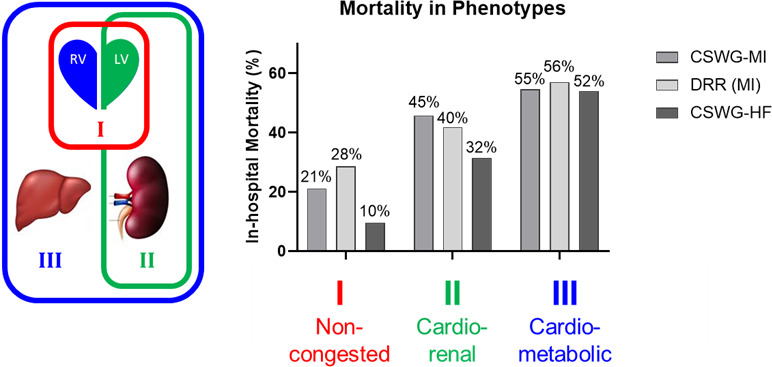
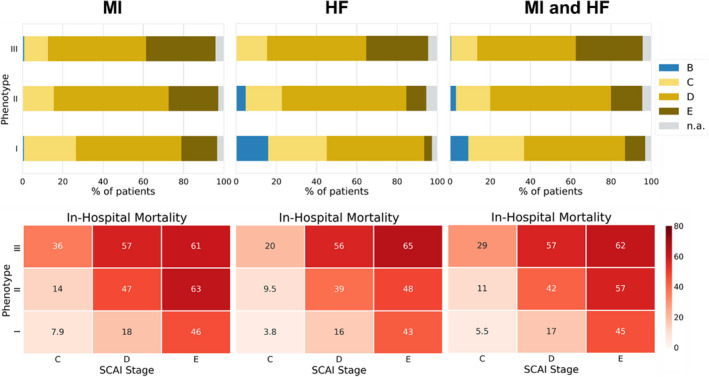
Background Cardiogenic shock (CS) is a heterogeneous syndrome with varied presentations and outcomes. We used a machine learning approach to test the hypothesis that patients with CS have distinct phenotypes at presentation, which are associated with unique clinical profiles and in-hospital mortality. Methods and Results We analyzed data from 1959 patients with CS from 2 international cohorts: CSWG (Cardiogenic Shock Working Group Registry) (myocardial infarction [CSWG-MI; n=410] and acute-on-chronic heart failure [CSWG-HF; n=480]) and the DRR (Danish Retroshock MI Registry) (n=1069). Clusters of patients with CS were identified in CSWG-MI using the consensus k means algorithm and subsequently validated in CSWG-HF and DRR. Patients in each phenotype were further categorized by their Society of Cardiovascular Angiography and Interventions staging. The machine learning algorithms revealed 3 distinct clusters in CS: "non-congested (I)", "cardiorenal (II)," and "cardiometabolic (III)" shock. Among the 3 cohorts (CSWG-MI versus DDR versus CSWG-HF), in-hospital mortality was 21% versus 28% versus 10%, 45% versus 40% versus 32%, and 55% versus 56% versus 52% for clusters I, II, and III, respectively. The "cardiometabolic shock" cluster had the highest risk of developing stage D or E shock as well as in-hospital mortality among the phenotypes, regardless of cause. Despite baseline differences, each cluster showed reproducible demographic, metabolic, and hemodynamic profiles across the 3 cohorts. Conclusions Using machine learning, we identified and validated 3 distinct CS phenotypes, with specific and reproducible associations with mortality. These phenotypes may allow for targeted patient enrollment in clinical trials and foster development of tailored treatment strategies in subsets of patients with CS.
Keywords: cardiogenic shock; clusters; heart failure; hemodynamics; machine learning; myocardial infarction; phenotypes.
Conflict of interest statement
Dr Garan is an unpaid consultant for Abiomed Inc. Dr Hernandez‐Montfort is a consultant for Abiomed Inc (research and education). Dr Burkhoff reports an unrestricted, educational grant from Abiomed Inc to Cardiovascular Research Foundation. Dr Vorovich is a consultant and in the speakers’ bureau of Abiomed Inc. Dr Abraham is a consultant for Abbott Laboratories and Abiomed Inc. Dr Møller receives speaker honoraria and a research grant from Abiomed Inc. Dr Kapur receives consulting/speaker honoraria and institutional grant support from: Abbott Laboratories, Abiomed Inc, Boston Scientific, Edwards, Medtronic, Getinge, LivaNova, MDStart, Precardia, and Zoll. Dr Sinha is a consultant for Abiomed Inc (Critical Care Advisory Board). Dr O’Neill receives consulting/speaker honoraria from Abiomed Inc, Boston Scientific Inc, and Abbott Laboratories. None of the listed disclosures could be perceived as a competing interest for the content of this article. The remaining authors have no disclosures to report.
Figures
References
-
- Helgestad OKL, Josiassen J, Hassager C, Jensen LO, Holmvang L, Sørensen A, Frydland M, Lassen AT, Udesen NLJ, Schmidt H, et al. Temporal trends in incidence and patient characteristics in cardiogenic shock following acute myocardial infarction from 2010 to 2017: a Danish cohort study. Eur J Heart Fail. 2019;21:1370–1378. DOI: 10.1002/ejhf.1566. - DOI - PubMed
-
- Kolte D, Khera S, Aronow WS, Mujib M, Palaniswamy C, Sule S, Jain D, Gotsis W, Ahmed A, Frishman WH, et al. Trends in incidence, management, and outcomes of cardiogenic shock complicating ST‐elevation myocardial infarction in the United States. J Am Heart Assoc. 2014;3:e000590. DOI: 10.1161/JAHA.113.000590. - DOI - PMC - PubMed
-
- van Diepen S , Katz JN, Albert NM, Henry TD, Jacobs AK, Kapur NK, Kilic A, Menon V, Ohman EM, Sweitzer NK, et al. Contemporary management of cardiogenic shock: a scientific statement from the American Heart Association. Circulation. 2017;136:e232–e268. DOI: 10.1161/CIR.0000000000000525. - DOI - PubMed
-
- Thiele H, Jobs A, Ouweneel DM, Henriques JPS, Seyfarth M, Desch S, Eitel I, Poss J, Fuernau G, de Waha S . Percutaneous short‐term active mechanical support devices in cardiogenic shock: a systematic review and collaborative meta‐analysis of randomized trials. Eur Heart J. 2017;38:3523–3531. DOI: 10.1093/eurheartj/ehx363. - DOI - PubMed
Publication types
MeSH terms
Grants and funding
LinkOut - more resources
Full Text Sources
Research Materials
Miscellaneous
