Light and depth dependency of nitrogen fixation by the non-photosynthetic, symbiotic cyanobacterium UCYN-A
- PMID: 34227720
- PMCID: PMC9291983
- DOI: 10.1111/1462-2920.15645
Light and depth dependency of nitrogen fixation by the non-photosynthetic, symbiotic cyanobacterium UCYN-A
Abstract
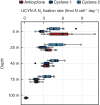
The symbiotic cyanobacterium UCYN-A is one of the most globally abundant marine dinitrogen (N2 )-fixers, but cultures have not been available and its biology and ecology are poorly understood. We used cultivation-independent approaches to investigate how UCYN-A single-cell N2 fixation rates (NFRs) and nifH gene expression vary as a function of depth and photoperiod. Twelve-hour day/night incubations showed that UCYN-A only fixed N2 during the day. Experiments conducted using in situ arrays showed a light-dependence of NFRs by the UCYN-A symbiosis, with the highest rates in surface waters (5-45 m) and lower rates at depth (≥ 75 m). Analysis of NFRs versus in situ light intensity yielded a light saturation parameter (Ik ) for UCYN-A of 44 μmol quanta m-2 s-1 . This is low compared with other marine diazotrophs, suggesting an ecological advantage for the UCYN-A symbiosis under low-light conditions. In contrast to cell-specific NFRs, nifH gene-specific expression levels did not vary with depth, indicating that light regulates N2 fixation by UCYN-A through processes other than transcription, likely including host-symbiont interactions. These results offer new insights into the physiology of the UCYN-A symbiosis in the subtropical North Pacific Ocean and provide clues to the environmental drivers of its global distributions.
© 2021 The Authors. Environmental Microbiology published by Society for Applied Microbiology and John Wiley & Sons Ltd.
Figures


References
-
- Barone, B. , Coenen, A.R. , Beckett, S.J. , McGillicuddy, D.J. , Weitz, J.S. , and Karl, D.M. (2019) The ecological and biogeochemical state of the North Pacific Subtropical Gyre is linked to sea surface height. J Mar Res 77: 215–245.
-
- Behrenfeld, M.J. , and Falkowski, P.G. (1997) A consumer's guide to phytoplankton primary productivity models. Limnol Oceanogr 42: 1479–1491.
-
- Berman‐Frank, I. , Lundgren, P. , Chen, Y.‐B. , Küpper, H. , Kolber, Z. , Bergman, B. , and Falkowski, P. (2001) Segregation of nitrogen fixation and oxygenic photosynthesis in the marine cyanobacterium Trichodesmium . Science 294: 1534–1537. - PubMed
-
- Boström, K.H. , Simu, K. , Hagström, Å. , and Riemann, L. (2004) Optimization of DNA extraction for quantitative marine bacterioplankton community analysis. Limnol Oceanogr Meth 2: 365–373.
-
- Böttjer, D. , Dore, J.E. , Karl, D.M. , Letelier, R.M. , Mahaffey, C. , Wilson, S.T. , et al. (2017) Temporal variability of nitrogen fixation and particulate nitrogen export at Station ALOHA. Limnol Oceanogr 62: 200–216.

