. 2021 Oct;58(10):4959-4979.
doi: 10.1007/s12035-021-02462-2. Epub 2021 Jul 6.

Bacteroides uniformis CECT 7771 Modulates the Brain Reward Response to Reduce Binge Eating and Anxiety-Like Behavior in Rat

Affiliations

Bacteroides uniformis CECT 7771 Modulates the Brain Reward Response to Reduce Binge Eating and Anxiety-Like Behavior in Rat

Ana Agustí et al. Mol Neurobiol. 2021 Oct.

Abstract

Food addiction (FA) is characterized by behavioral and neurochemical changes linked to loss of food intake control. Gut microbiota may influence appetite and food intake via endocrine and neural routes. The gut microbiota is known to impact homeostatic energy mechanisms, but its role in regulating the reward system is less certain. We show that the administration of Bacteroides uniformis CECT 7771 (B. uniformis) in a rat FA model impacts on the brain reward response, ameliorating binge eating and decreasing anxiety-like behavior. These effects are mediated, at least in part, by changes in the levels of dopamine, serotonin, and noradrenaline in the nucleus accumbens and in the expression of dopamine D1 and D2 receptors in the prefrontal cortex and intestine. B. uniformis reverses the fasting-induced microbiota changes and increases the abundance of species linked to healthy metabolotypes. Our data indicate that microbiota-based interventions might help to control compulsive overeating by modulating the reward response.

Keywords: Bacteroides uniformis CECT 7771; Binge eating; Dopamine; Food addiction; Gut–brain axis; Microbiota; Preclinical model; Reward system.


Conflict of interest statement

The authors declare no competing interest.

Figures

Fig. 1
Fig. 1
Scheme of the experimental design and assessments during the intervention in a rat FA eating model. Wistar rats were divided into three experimental groups (n = 15/each): (1) a control group (C) receiving normal diet and water during 24 h plus vehicle (10% skimmed milk), (2) an intermittent fasting (IF) group that fasts during 12 h and receives normal diet and sucrose (10%) in the drinking water during the remaining 12 h plus vehicle, and (3) an IF group treated with B. uniformis (IF + B) that fasts during 12 h and receives normal diet and sucrose (10%) in the drinking water during the remaining 12 h plus a daily dose of 1 × 108 CFU B. uniformis in vehicle. The administration of the strain was at 8.00 h before fasting started. Behavioral tests were performed at different times along the study protocol. Microdialysis was performed for 11 h to collect samples at phases of the study (fasting, craving, and binge)
Fig. 2
Fig. 2
B. uniformis reduces total calories, chow, and sucrose solution intake during the binge with no effect on body weight gain. The sum of total caloric intake during the binge period (kcal) (A), mean of the chow intake (g) (B), mean of the 10% sucrose intake (g) (bottles were weighed before and after the binge period) (C), and body weight evolution (g) (D) in control and IF rats treated or not with B. uniformis, (n = 15/each). Abbreviations: C, control group; C-D2 and C-D18, control group on day 2 and 18, respectively; IF, rats that fasted 12 h daily and received vehicle; IF-D2 and IF-D18, IF group on day 2 and 18, respectively, IF + B, rats that fasted 12 h and received a daily dose of 1 × 108 CFU B. uniformis; IF + B-D2 and IF + B-D18, IF + B rats on day 2 and 18, respectively. Rats were weighed every week during the 3-week period. One-way ANOVA followed by post hoc Tukey’s test was performed in all the figures. Statistically significant differences compared with the C-D2 group are indicated by an asterisk (*), different from C-D18 are indicated by (#), different from IF-D2 are indicated by (&), different from IF + B-D2 are indicated by ($), and different from IF-D18 are indicated by (@). *p < 0.05, ***p < 0.001, ###p < 0.001, &p < 0.05, &&&p < 0.001, $$$p < 0.001, @@@p < 0.001
Fig. 3
Fig. 3
B. uniformis restores normal anxiety-like behavior. Light–dark box test (A, B, C). Latency in moving to the light area (s) (A), number of entries into the light area (B), and time spent in the light area (s) (C). Effect of B. uniformis on the anxiety versus hunger test (D, E). Latency to initial chow contact (s) (D), latency to initial chow contact, and eating (s) (E) (n = 15/each). Abbreviations: C, control group; IF, rats that fasted 12 h daily and received vehicle; IF + B, rats that fasted 12 h and received daily dose of 1 × 108 CFU B. uniformis. One-way ANOVA followed by post hoc Tukey’s test was performed in C, D, and E and Brown–Forsythe and Welch ANOVA test post hoc Dunnett’s in A and B. Statistically significant differences compared with the control group are indicated by an asterisk (*), different from IF group are indicated by #. *p < 0.05, #p < 0.05
Fig. 4
Fig. 4
B. uniformis restores normal circadian rhythm of vertical activity. Circadian rhythms of locomotor activity were registered for 48 consecutive hours. Light phase comprises zeitgeber time 4.00–16.00 h and dark phase zeitgeber time 16.00–4.00 h (n = 15/each). Vertical activity every hour throughout a 24-h period is shown in A. B shows the total vertical activity during the light (day) and dark (night) phases, and C shows the ratio of night/day of vertical activity. Ambulatory activity every hour throughout a 24-h period is shown in D. E shows the total ambulatory activity during the light (day) and dark (night) phases, and F shows the ratio of night/day of ambulatory activity. Abbreviations: C, control group; IF, rats that fasted 12 h daily and received vehicle; IF + B, rats that fasted 12 h and received a daily dose of 1 × 108 CFU B. uniformis. Two-way-ANOVA followed by post hoc Bonferroni was performed in A and D and one-way ANOVA followed by post hoc Tukey’s test was performed in B, C, E, and F. Statistically significant differences compared with the control group are indicated by an asterisk (*), different from IF group are indicated by #. *p < 0.05, #p < 0.05
Fig. 5
Fig. 5
B. uniformis does not modulate orexigenic and anorexigenic neuropeptides. Effect of B. uniformis on the mRNA relative expression of neuropeptide Y (NPY) (A), agouti-related peptide (AgRP) (B), cocaine and amphetamine-regulated transcript (CART) (C), and proopiomelanocortin (POMC) (D) in the hypothalamus (n = 15/each). Abbreviations: C, control group; IF, rats that fasted 12 h daily and received vehicle; IF + B, rats that fasted 12 h and received a daily dose of 1 × 108 CFU B. uniformis. One-way ANOVA followed by post hoc Tukey’s test was performed in all the figures. Statistically significant differences compared to the control group are indicated by asterisks (*). *p < 0.05, **p < 0.01
Fig. 6
Fig. 6
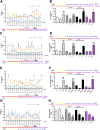
B. uniformis modulates neural transmitters in the nucleus accumbens as analyzed by microdialysis. Microdialysis guide was implanted in the nucleus accumbens. Extracellular concentrations of dopamine (A, B), serotonin (C, D), noradrenaline (E, F), and adrenaline (G, H) were measured by microdialysis in freely moving rats. Values are expressed in absolute value (nM) (A, C, E, G) and as the mean (nM) (B, D, F, H). Abbreviations: C, control group (n = 9); IF, rats that fasted 12 h daily and received vehicle (n = 10); IF + B, rats that fasted 12 h and received a daily dose of 1 × 108 CFU B. uniformis (n = 9). Statistically significant differences (A, C, E, G) compared with the control group are indicated by an asterisk (*), different from IF group are indicated by #. *p < 0.05, **p < 0.01, #p < 0.05, ##p < 0.01, ###p < 0.001. Two-way-ANOVA followed by post hoc Bonferroni was performed in A, C, E, and G, and one-way ANOVA followed by post hoc Tukey’s test was performed in B, D, F, and H. Statistically significant differences (B, D, F, H) compared with the control group are indicated by an asterisk (*), different from IF group are indicated by #, different from the C(c) group are indicated by (a), different from IF(c) group are indicated by (b), different from the control(b) group are indicated by (&), different from IF(b) group are indicated by ($), different from the control(c-p) group are indicated by ( +), and different from IF(c-p) group are indicated by (%). *p < 0.05, **p < 0.01, ***p < 0.001, ##p < 0.01, ###p < 0.001, aaa p < 0.001, bbb p < 0.001, &&p < 0.01, $$$p < 0.001, + p < 0.05, +  +  + p < 0.001, %% p < 0.01, %%% p < 0.001
Fig. 7
Fig. 7
B. uniformis modulates D1R and D2R expression in the prefrontal cortex and the small intestine. The prefrontal cortex (PFCx) (AD) and the small intestine (EH). Immunohistochemistry was performed using antibodies against D1R (A) or D2R (B). Representative (× 20) magnification images are shown for PFCx and (× 56) for the small intestine. The number of D1-positive cells (C, G) and D2-positive cells (D, H) was quantified (n = 3/each). Values are the mean ± SEM of three rats per group. Abbreviations: C, control group; IF, rats that fasted 12 h daily and received vehicle; IF + B, rats that fasted 12 h and received a daily dose of 1 × 108 CFU B. uniformis. Kruskal–Wallis test post hoc Dunn’s was test was performed in all the figures. Statistically significant differences compared with the control group are indicated by an asterisk (*) and different from IF group are indicated by (#). **p < 0.01, ***p < 0.001, #p < 0.05, ### p < 0.001. Scale bar = 100 μm for PFCx and 50 μm for the small intestine
Fig. 8
Fig. 8
B. uniformis restores the gut microbiota. Alpha and beta diversity (AC). Abundance and prevalence of OTUs (D). Abbreviations: C, control group; IF, rats that fasted 12 h daily and received vehicle; IF + B, rats that fasted 12 h and received a daily dose of 1 × 108 CFU B. uniformis (n = 15/each). A, B Distribution of the total number of observed OTUs and phylogenetic diversity for all samples collected in the study. Data are presented as boxplots. P-values resulting from respective comparisons using non-parametric methods are shown. C Multivariate exploratory analysis (principal coordinate analysis, PCoA) based on the Bray–Curtis dissimilarity index between paired samples. Ellipses indicate boundaries for the confidence interval of respective distributions at 95%. Abundance and prevalence information for a total of 15 OTUs differentially present in the three experimental animal groups (D). Linear discriminant analysis (LDA) scoring and p-values supporting the statistical assessment are shown. The top four panels (D) show OTUs with higher abundances in the control group compared with the two FA groups. The remaining eleven panels show OTUs with higher abundances in the two FA groups compared with the control group. The statistically significant differences found in IF + B compared with IF group are highlighted with a red asterisk

Similar articles

Cited by

References

    1. D'Addario C, Micioni Di Bonaventura MV, Pucci M, Romano A, Gaetani S, Ciccocioppo R, Cifani C, Maccarrone M. Endocannabinoid signaling and food addiction. Neurosci Biobehav Rev. 2014;47:203–224. doi: 10.1016/j.neubiorev.2014.08.008. - DOI - PubMed
    1. Tremmel, M., Gerdtham, U. G., Nilsson, P. M. & Saha, S. (2017). Economic burden of obesity: a systematic literature review. Int J Environ Res Public Health, 14. - PMC - PubMed
    1. de Zwaan M. Binge eating disorder and obesity. Int J Obes Relat Metab Disord. 2001;25(1):S51–5. doi: 10.1038/sj.ijo.0801699. - DOI - PubMed
    1. Schag K, Schönleber J, Teufel M, Zipfel S, Giel KE. Food-related impulsivity in obesity and binge eating disorder—a systematic review. Obes Rev. 2013;14(6):477–95. doi: 10.1111/obr.12017. - DOI - PubMed
    1. Davis C, Curtis C, Levitan RD, Carter JC, Kaplan AS, Kennedy JL. Evidence that ‘food addiction’ is a valid phenotype of obesity. Appetite. 2011;57(3):711–7. doi: 10.1016/j.appet.2011.08.017. - DOI - PubMed

Supplementary concepts