. 2021 Aug 9;6(15):e150861.
doi: 10.1172/jci.insight.150861.

Key molecular alterations in endothelial cells in human glioblastoma uncovered through single-cell RNA sequencing

Affiliations

Key molecular alterations in endothelial cells in human glioblastoma uncovered through single-cell RNA sequencing

Yuan Xie et al. JCI Insight. .

Abstract

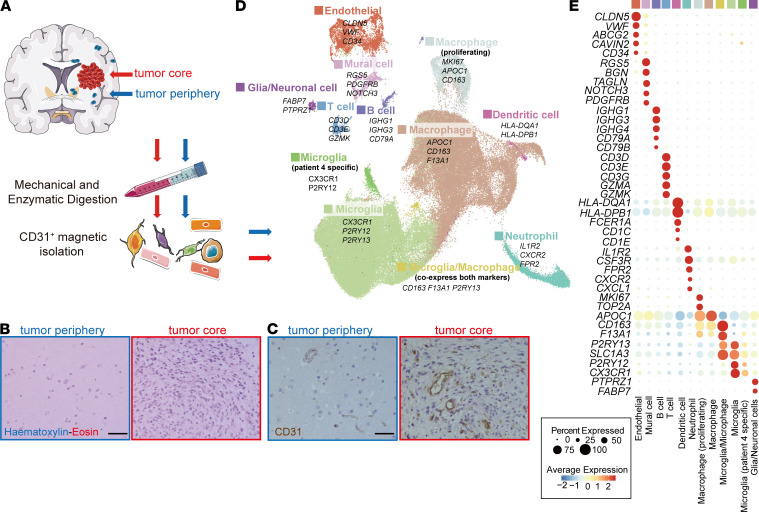
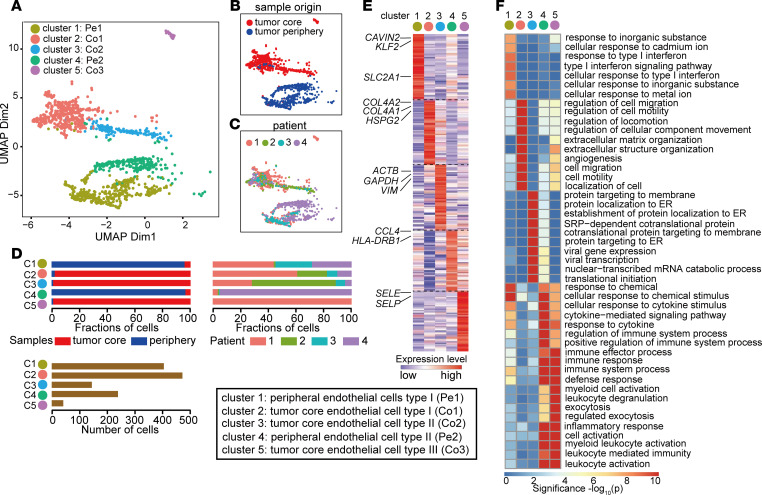
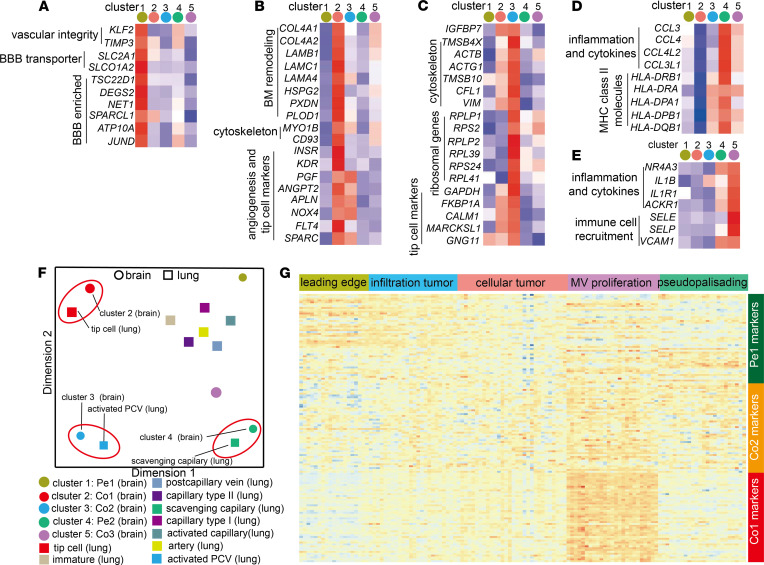
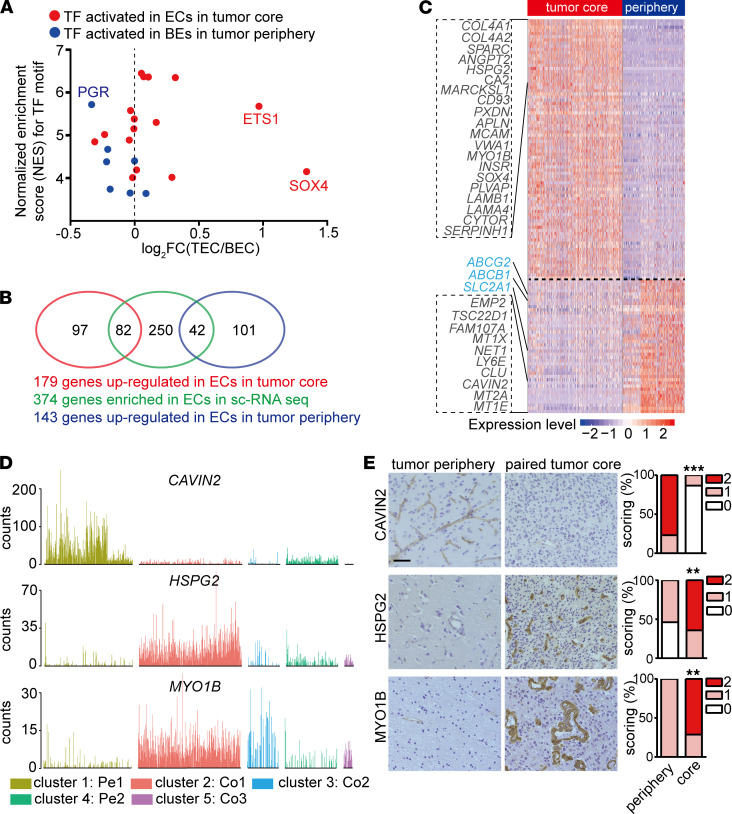
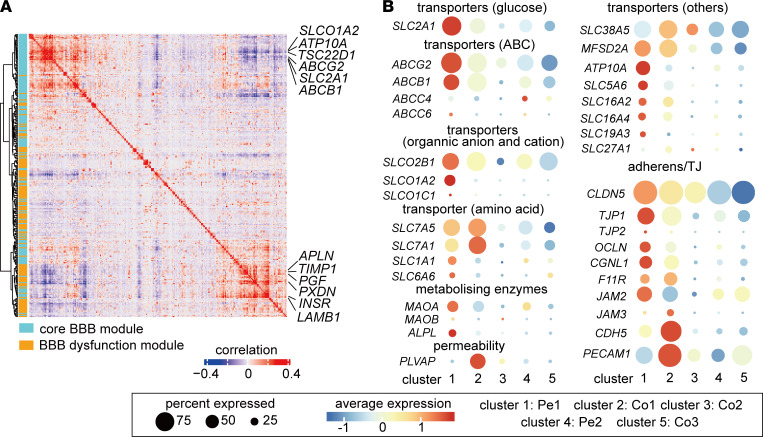
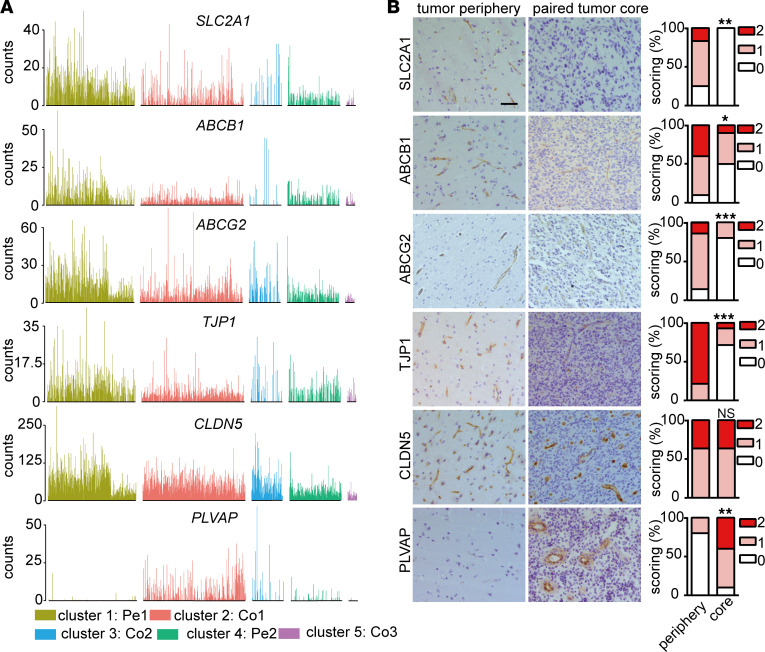
Passage of systemically delivered pharmacological agents into the brain is largely blocked by the blood-brain-barrier (BBB), an organotypic specialization of brain endothelial cells (ECs). Tumor vessels in glioblastoma (GBM), the most common malignant brain tumor in humans, are abnormally permeable, but this phenotype is heterogeneous and may differ between the tumor's center and invasive front. Here, through single-cell RNA sequencing (scRNA-seq) of freshly isolated ECs from human glioblastoma and paired tumor peripheral tissues, we have constructed a molecular atlas of human brain ECs providing unprecedented molecular insight into the heterogeneity of the human BBB and its molecular alteration in glioblastoma. We identified 5 distinct EC phenotypes representing different states of EC activation and BBB impairment, and associated with different anatomical locations within and around the tumor. This unique data resource provides key information for designing rational therapeutic regimens and optimizing drug delivery.

Keywords: Brain cancer; Endothelial cells; Vascular Biology.


Conflict of interest statement

Conflict of interest: The authors have declared that no conflict of interest exists.

Figures

Figure 1
Figure 1. Overview of the CD31-MACS–enriched single cells from GBM and peripheral brain samples.
(A) Schematic overview of the study design. (B and C) HE staining (B) and IHC staining of CD31 (C) in GBM tumor core and tumor peripheral tissue. (D) UMAP of transcriptome from CD31-MACS–enriched cells, colored for the 12 clusters. (E) Dot plot heatmap of the marker genes in individual clusters. Scale bar: 50 μm.
Figure 2
Figure 2. Construction of the EC atlas from GBM and peripheral brain tissue.
(AC) UMAP of endothelial cells, colored by clusters (A) or sample type of origin (B) or individual patient (C). (D) Relative contribution of endothelial cells from sample origin type (left) and individual patient (right). The number of cells in each subclusters (bottom). (E) Gene expression levels of top 50 marker genes in different endothelial subclusters. For complete list, see Supplemental Table 4. (F) Heatmap showing top 10 enriched GO terms in different endothelial subclusters based on top 50 marker genes.
Figure 3
Figure 3. Characterization of different EC phenotypes.
(AE) Expression levels of selected marker genes of cluster 1 (Pe1) ECs (A), cluster 2 (Co1) ECs (B), cluster 3 (Co2) ECs (C), cluster 4 (Pe2) ECs (D), and cluster 5 (Co3) ECs (E). (F) Multidimensional scaling (MDS) on the Jaccard similarity coefficients of the top 50 marker gene sets among endothelial subclusters in brain (and GBM) and lung (and lung cancer). (G) The normalized expression of top 50 markers for Pe1 ECs, Co1 ECs, and Co2 ECs in Ivy GAP RNA-seq of distinct GBM-anatomic structures.
Figure 4
Figure 4. ECs in tumor core are distinct from ECs in peripheral brain tissue.
(A) Plot of transcription factor activity score estimated by SCENIC to fold change of their expression between ECs in periphery and tumor core. Red/blue dot corresponds to transcription factor activated in ECs in the tumor core or tumor periphery, respectively. (B) Venn diagram illustrating the overlaps of 374 EC-enriched genes with differentially expressed genes between ECs in tumor core and tumor periphery. (C) Heatmap showing differentially expressed EC-enriched genes between ECs in the tumor core and peripheral brain tissue. (D) Bar plots of CAVIN2, HSPG2, and MYO1B among different EC subclusters. (E) IHC staining and quantification of CAVIN2, HSPG2, and MYO1B in human GBM tumor core and paired peripheral brain tissue (CAVIN2, n = 13; HSPG2, n = 13; MYO1B, n = 14). Staining was scored semiquantitatively on scale from 0 to 2 based on proportional of vessels stained (Wilcoxon test, **P < 0.01, ***P < 0.001). Scale bar: 50 μm.
Figure 5
Figure 5. ECs in GBM are associated with compromised BBB phenotype.
(A) Correlation plot showing correlation coefficient of genes in BBB and BBB dysfunctional module. (B) Dot plot showing differential expression patterns of different transporters, metabolizing enzymes, adherens/tight junctions, and permeability genes implicated in BBB functions among different clusters.
Figure 6
Figure 6. The expression of BBB-related genes in EC subclusters.
(A) Bar plots of SLC2A1, ABCB1, ABCG2, TJP1, CLDN5, and PLVAP in different EC subclusters. (B) IHC staining and quantification of SLC2A1, ABCB1, ABCG2, TJP1, CLDN5, and PLVAP in peripheral brain tissue and paired GBM (SLC2A1, n = 12; ABCB1, n = 10; ABCG2, n = 14; TJP, n = 14; CLDN5, n = 11; PLVAP, n = 10). The stainings were scored semiquantitatively on scale from 0 to 2 based on proportional of vessels stained (Wilcoxon test, *P < 0.05, **P < 0.01, ***P < 0.001). Scale bar: 50 μm.

References

    1. Ostrom QT, et al. CBTRUS Statistical Report: primary brain and other central nervous system tumors diagnosed in the United States in 2010–2014. Neuro Oncol. 2017;19(Suppl_5):v1–v88. doi: 10.1093/neuonc/nox158. - DOI - PMC - PubMed
    1. Sarkaria JN, et al. Is the blood-brain barrier really disrupted in all glioblastomas? A critical assessment of existing clinical data. Neuro Oncol. 2018;20(2):184–191. doi: 10.1093/neuonc/nox175. - DOI - PMC - PubMed
    1. Daneman R, Prat A. The blood-brain barrier. Cold Spring Harb Perspect Biol. 2015;7(1):a020412. doi: 10.1101/cshperspect.a020412. - DOI - PMC - PubMed
    1. Vanlandewijck M, et al. A molecular atlas of cell types and zonation in the brain vasculature. Nature. 2018;554(7693):475–480. doi: 10.1038/nature25739. - DOI - PubMed
    1. Munji RN, et al. Profiling the mouse brain endothelial transcriptome in health and disease models reveals a core blood-brain barrier dysfunction module. Nat Neurosci. 2019;22(11):1892–1902. doi: 10.1038/s41593-019-0497-x. - DOI - PMC - PubMed

Publication types

MeSH terms

Substances