. 2021 Jul 6;17(7):e1009649.
doi: 10.1371/journal.pgen.1009649. eCollection 2021 Jul.

Aging-related upregulation of the homeobox gene caudal represses intestinal stem cell differentiation in Drosophila

Affiliations

Aging-related upregulation of the homeobox gene caudal represses intestinal stem cell differentiation in Drosophila

Kun Wu et al. PLoS Genet. .

Erratum in

Abstract

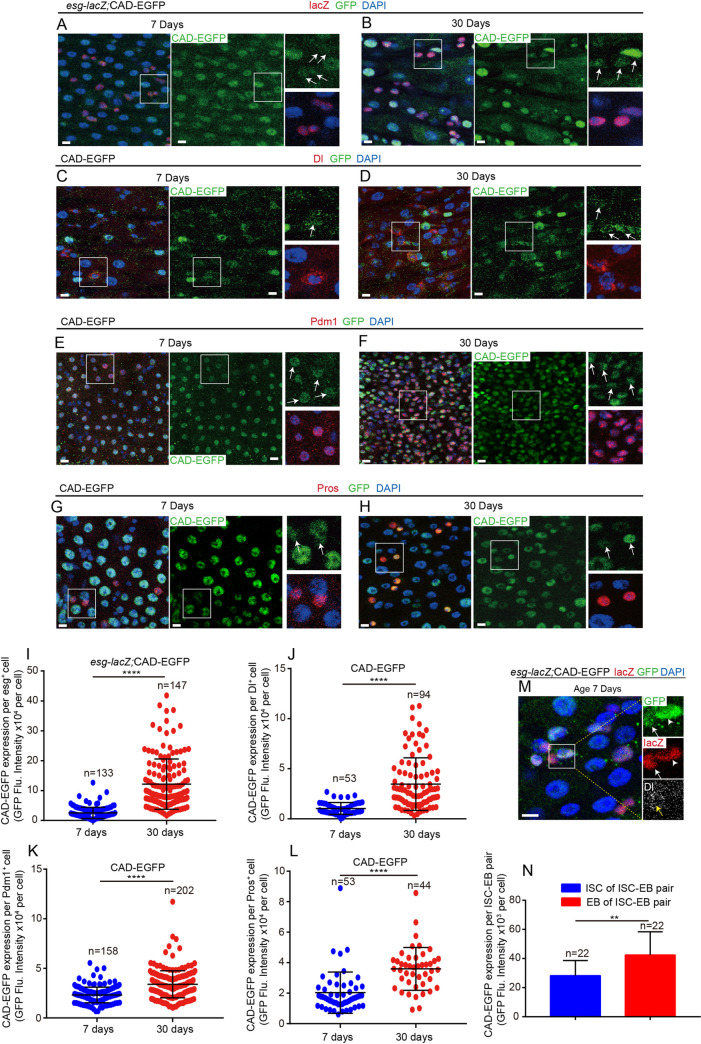
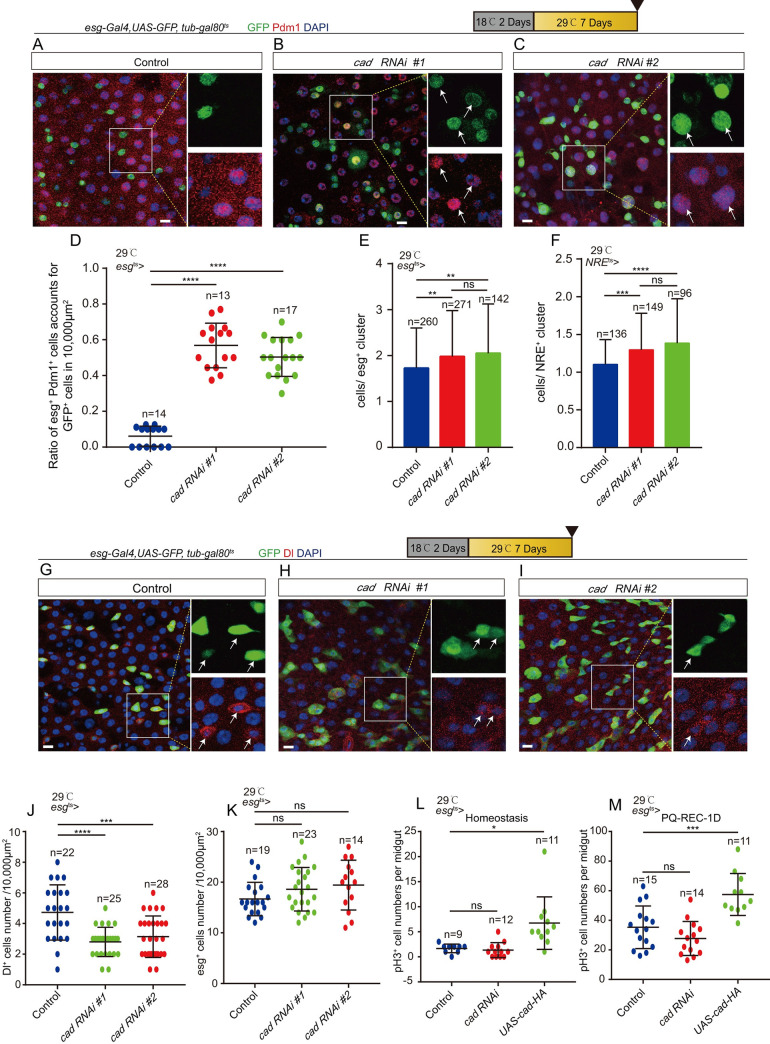
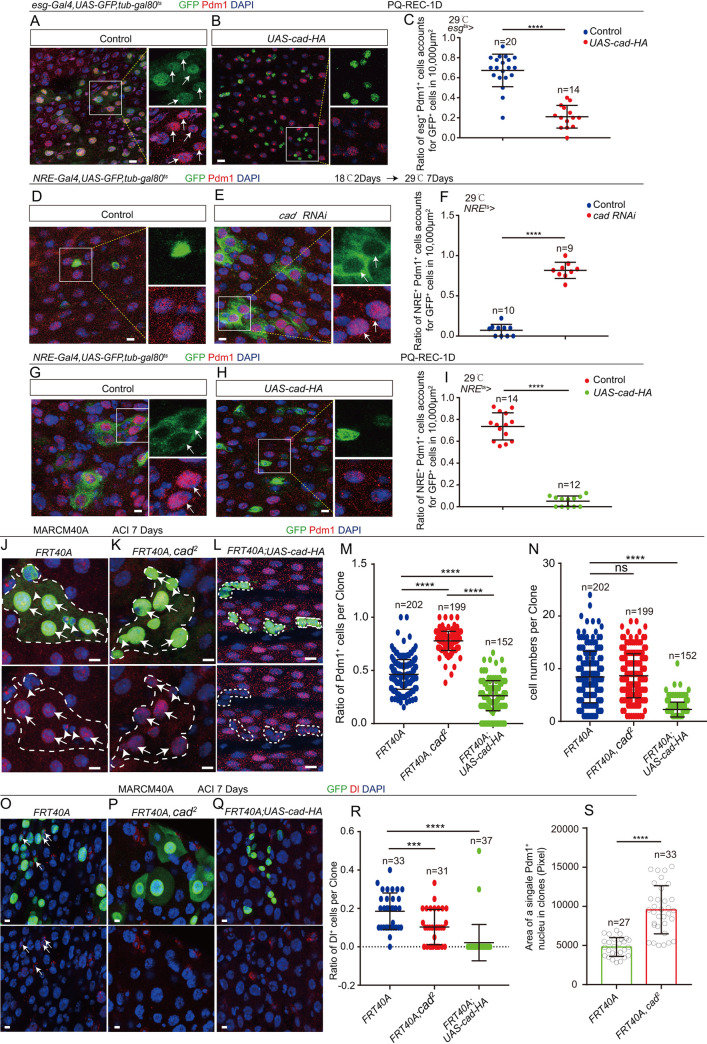
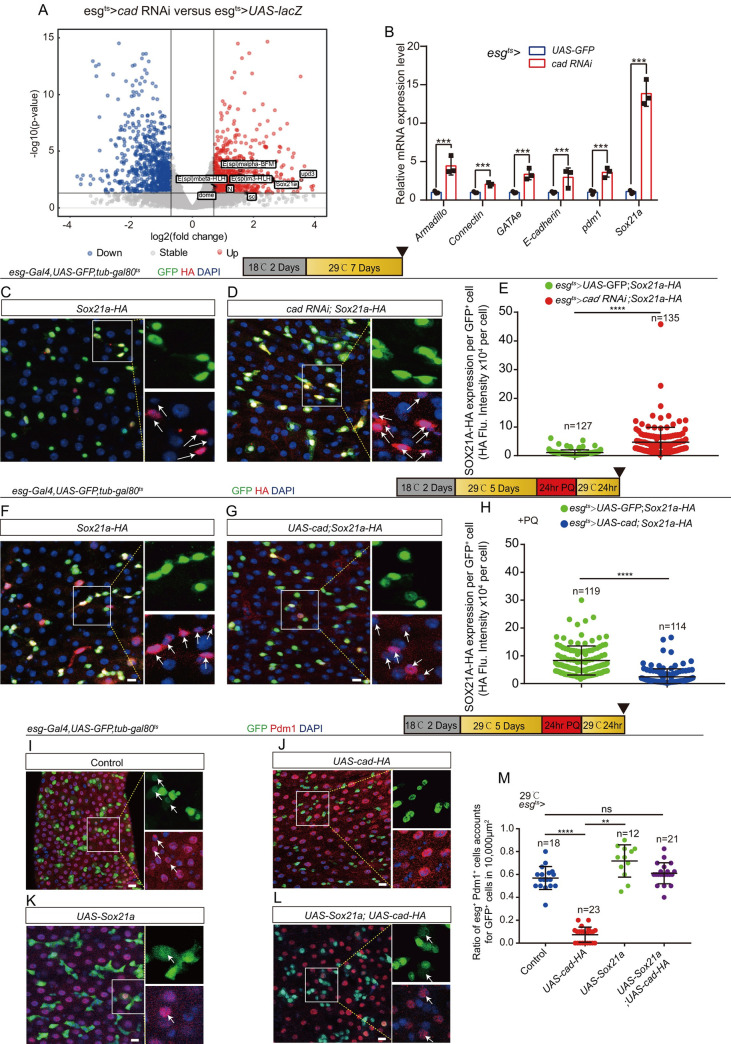
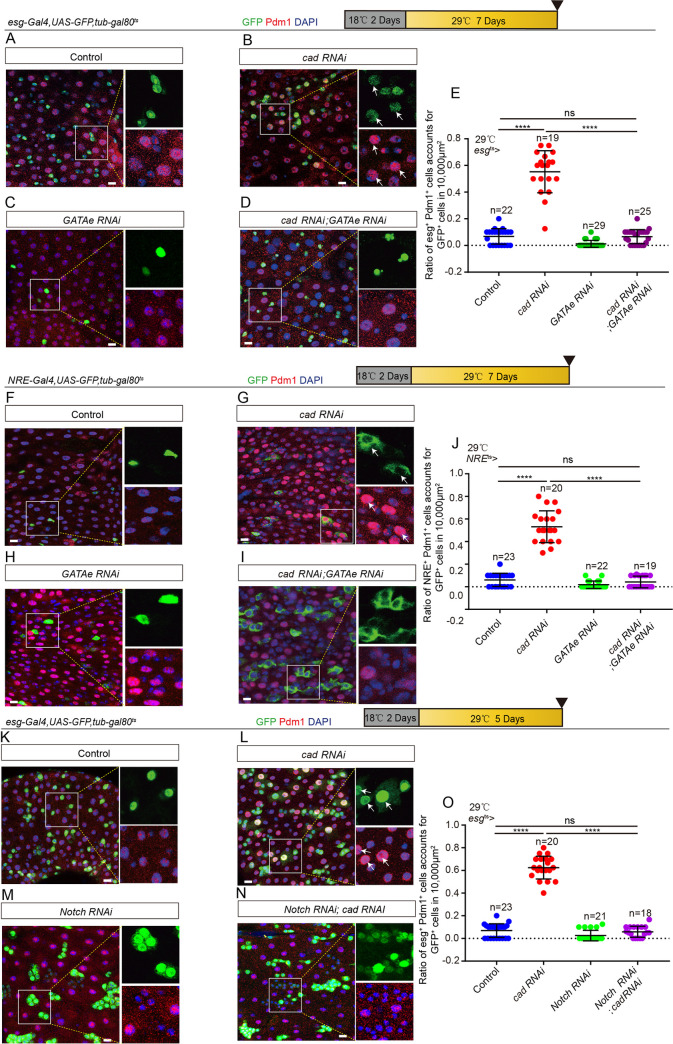
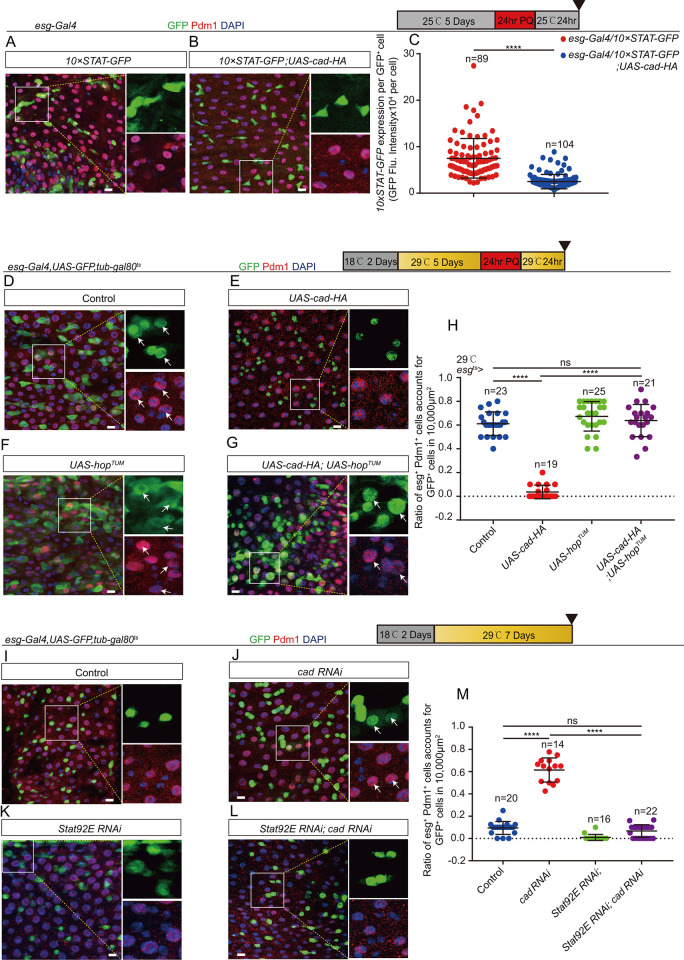
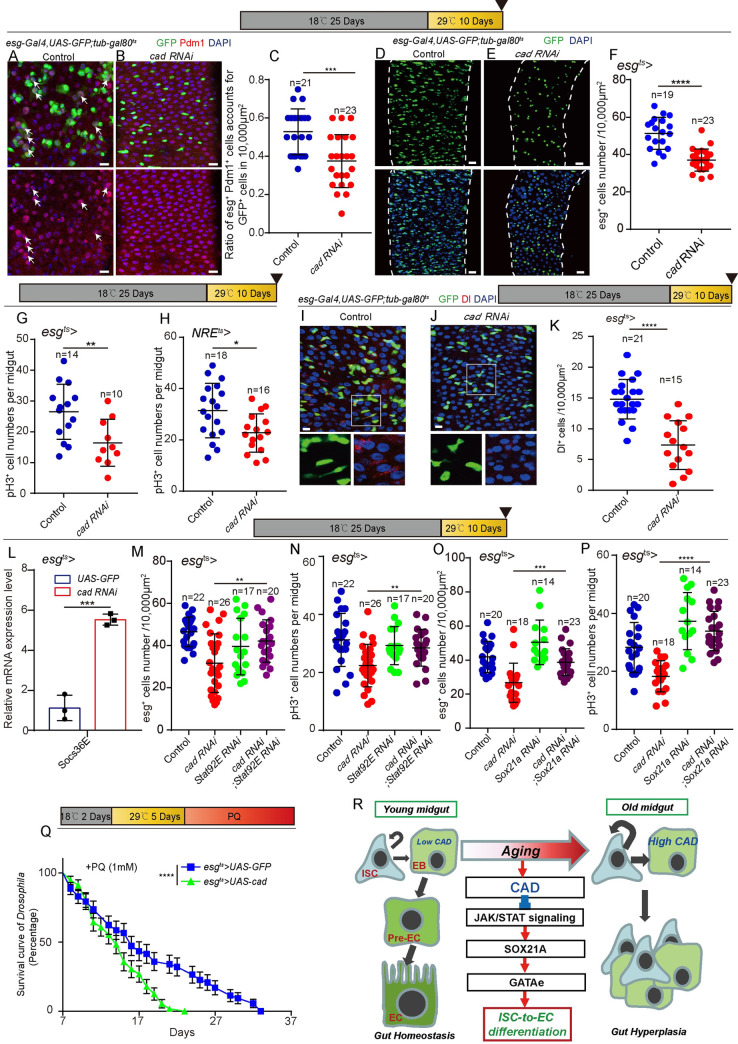
The differentiation efficiency of adult stem cells undergoes a significant decline in aged animals, which is closely related to the decline in organ function and age-associated diseases. However, the underlying mechanisms that ultimately lead to this observed decline of the differentiation efficiency of stem cells remain largely unclear. This study investigated Drosophila midguts and identified an obvious upregulation of caudal (cad), which encodes a homeobox transcription factor. This factor is traditionally known as a central regulator of embryonic anterior-posterior body axis patterning. This study reports that depletion of cad in intestinal stem/progenitor cells promotes quiescent intestinal stem cells (ISCs) to become activate and produce enterocytes in the midgut under normal gut homeostasis conditions. However, overexpression of cad results in the failure of ISC differentiation and intestinal epithelial regeneration after injury. Moreover, this study suggests that cad prevents intestinal stem/progenitor cell differentiation by modulating the Janus kinase/signal transducers and activators of the transcription pathway and Sox21a-GATAe signaling cascade. Importantly, the reduction of cad expression in intestinal stem/progenitor cells restrained age-associated gut hyperplasia in Drosophila. This study identified a function of the homeobox gene cad in the modulation of adult stem cell differentiation and suggested a potential gene target for the treatment of age-related diseases induced by age-related stem cell dysfunction.


Conflict of interest statement

The authors have declared that no competing interests exist.

Figures

Fig 1
Fig 1. Expression of cad dramatically increases in Drosophila intestinal stem cells (ISCs) and progenitor cells upon aging.
(A-B) Expression of endogenous CAD-EGFP protein (green) in esg+ cells (ISCs and EBs; co-stained with esg-LacZ, red) in midguts from the R4 region of 7-day (A) and 30-day-old (B) Drosophila. The enlarged insets show esg-LacZ+ cells (red) with CAD-EGFP (green) staining. Arrows indicate esg-LacZ+ cells. (C-D) Expression of endogenous CAD-EGFP protein (green) in ISCs (labeled by Dl staining, red) in midguts from the R4 region of 7-day (C) and 30-day-old (D) Drosophila. The enlarged insets show ISCs (red) with CAD-EGFP (green) staining. Arrows indicate Dl+ ISCs. (E-F) Expression of endogenous CAD-EGFP protein (green) in ECs (labeled by Pdm1 staining, red) in midguts from the R4 region of 7-day (E) and 30-day-old (F) Drosophila. The enlarged insets show ECs (red) with CAD-EGFP (green) staining. Arrows indicate Pdm1+ ECs. (G-H) Expression of endogenous CAD-EGFP protein (green) in EEs (labeled by Prospero staining, red) in midguts from the R4 region of 7-day (G) and 30-day-old (H) Drosophila. The enlarged insets show EEs (red) with CAD-EGFP (green) staining. Arrows indicate Pros+ EEs. (I) Quantification of fluorescence intensity of CAD-EGFP in esg-LacZ+ cells of 7-day and 30-day-old Drosophila as shown in (A-B). (J) Quantification of fluorescence intensity of CAD-EGFP in Dl+ ISCs of 7-day and 30-day-old Drosophila as shown in (C-D). (K) Quantification of fluorescence intensity of CAD-EGFP in Pdm1+ ECs of 7-day and 30-day-old Drosophila as shown in (E-F). (L) Quantification of fluorescence intensity of CAD-GFP in Pros+ EEs of 7-day and 30-day-old Drosophila as shown in (G-H). (M) Representative images showing the expression pattern of CAD in young Drosophila midgut. The enlarged insets show esg-LacZ+ cells (red) with CAD-GFP (green) staining. Arrows indicate esg-LacZ+ Dl+ cells (ISCs). Arrowheads indicate esg-LacZ+ Dl- cells (EBs). (N) Quantification of fluorescence intensity of CAD-EGFP in ISCs or EBs from per ISC-EB pair as shown in (M). The number n is indicated. Each dot represents one cell. DAPI stained nuclei (blue). Scale bars represent 10μm (in Fig 1A-1H and 1M). Error bars represent SD. Significance was assessed via student’s t-tests: *p < 0.05, **p < 0.01, ***p < 0.001, ****p < 0.0001, and ns (non-significant) represents p > 0.05. See also S1 Fig.
Fig 2
Fig 2. Depletion of cad in ISCs and progenitor cells promotes ISC-to-EC differentiation.
(A-C) Immunofluorescence images of esg-GFP (green) and Pdm1 (red) staining with the midgut section from the R4 region of control Drosophila (A, esgts-Gal4>UAS-GFP) and the cad-depleted Drosophila by esgts-Gal4-driven two different cad RNAi lines (B, cad RNAi #1: BDSC #57546; C, cad RNAi #2: BDSC #34702). esg-GFP (green) represents ISCs and their differentiating cells. Pdm1 staining (red) was used to visualize differentiating ECs. White arrows indicate differentiating pre-ECs (both esg-GFP+ and Pdm1+ cells). esg-GFP+ and Pdm1- cells are ISCs or EBs. esg-GFP- and Pdm1+ cells are mature ECs. (D) Quantification of the ratio of esg-GFP+ and Pdm1+ cells account for GFP+ cells per 10,000 μm2 area of the R4 region midguts as shown in (A-C). The number n represents the ROI in midguts from each experiment. One dot corresponds to one ROI (10,000 μm2 area). (E) Quantification of the average number of cells in each esg-GFP+ cluster in midguts of control flies (esgts>UAS-GFP) and flies knocking down of cad in esg-GFP+ cells. (F) Quantification of the average number of cells in each NRE-GFP+ cluster in midguts of control flies (NREts>UAS-GFP) and flies knocking down of cad in NRE-GFP+ cells. (G-I) Immunofluorescence images of esg-GFP (green) and Dl (red) staining with the midgut section from the R4 region of control Drosophila (G, esgts-Gal4>UAS-GFP) and cad-depleted Drosophila by esgts-Gal4-driven two different cad RNAi lines (H, cad RNAi #1; I, cad RNAi #2). esg-GFP (green) represents ISCs and their differentiating cells. Dl staining (red) was used to visualize ISCs. White arrows indicate Dl+ ISCs. (J-K) Quantification of the numbers of Dl+ ISCs (J) and esg-GFP+ cells (K) in a 10,000 μm2 area of the R4 region midguts from control Drosophila and Drosophila carrying esgts-Gal4>cad RNAi as shown in (G-I). The number n represents the ROI in midguts from each experiment. One dot corresponds to one ROI (10,000 μm2 area). (L) Quantification of the pH3+ number in the whole midgut from control flies (esgts-Gal4-driven UAS-GFP), Drosophila carrying esgts-Gal4-driven cad RNAi, and Drosophila carrying esgts-Gal4-driven UAS-cad-HA in homeostasis. The number n is indicated. Each dot represents one midgut. (M) Quantification of the pH3+ number in the whole midgut from control flies (esgts-Gal4-driven UAS-GFP), Drosophila carrying esgts-Gal4-driven cad RNAi, and Drosophila carrying esgts-Gal4-driven UAS-cad-HA. Flies were treated with PQ for one day, then recovered on normal food for 1 day (hereafter referred to as PQ-REC-1D). The number n is indicated. Each dot represents one midgut. DAPI stained nuclei (blue). Scale bars represent 10 μm (Fig 2A–2C and 2G–2I). Error bars represent SD. Student’s t-tests were used to assess statistical significane as *p < 0.05, **p < 0.01, ***p < 0.001, ****p < 0.0001, while ns (non-significant) represents p > 0.05. See also S2 Fig.
Fig 3
Fig 3. Overexpression of cad in EBs prevents ISCs to produce differentiated ECs.
(A-B) Immunofluorescence images of esg-GFP (green) and Pdm1 (red) staining with the midgut section from the R4 region of control Drosophila (A, esgts-Gal4>UAS-GFP) and Drosophila carrying esgts-Gal4> UAS-cad-HA (B). Drosophila were treated with PQ (PQ-REC-1D). esg-GFP (green) represents ISCs and their differentiating cells. Pdm1 staining (red) was used to visualize differentiating ECs. White arrows indicate differentiating pre-ECs (esg-GFP+ and Pdm1+cells). esg-GFP+ and Pdm1- cells are ISCs or EBs. esg-GFP- and Pdm1+ cells are mature ECs. (C) Quantification of the ratio of esg-GFP+ and Pdm1+ cells in a 10,000 μm2 area of the R4 region of midguts of Drosophila as shown in (A-B). The number n represents the ROI in midguts from each experiment. One dot corresponds to one ROI (10,000 μm2 area). (D-E) Immunofluorescence images of NRE-GFP (green) and Pdm1 (red) staining with the midgut section from the R4 region of 9-day-old (2 days at 18°C, then 7 days at 29°C) control Drosophila (D, NREts-Gal4>UAS-GFP) and cad-depleted Drosophila carrying NREts-Gal4> UAS-cad RNAi (E). NRE-GFP (green) represents EBs. Pdm1 staining (red) was used to visualize differentiating ECs. White arrows indicate differentiating pre-ECs (NRE-GFP+ and Pdm1+ cells). NRE-GFP+ and Pdm1- cells are EBs. NRE-GFP- and Pdm1+ cells are mature ECs. (F) Quantification of the ratio of NRE-GFP+ and Pdm1+ cells in a 10,000 μm2 area of the R4 region of midguts as shown in (D-E). The number n represents the ROI in midguts from each experiment. One dot corresponds to one ROI (10,000 μm2 area). (G-H) Immunofluorescence images of NRE-GFP (green) and Pdm1 (red) staining with the midgut section from the R4 region of control Drosophila (G, NREts-Gal4>UAS-GFP) and Drosophila carrying NREts-Gal4>UAS-cad-HA (H). Drosophila were treated with PQ (PQ-REC-1D). NRE-GFP (green) represents EBs. Pdm1 staining (red) was used to visualize differentiating ECs. White arrows indicate differentiating pre-ECs (NRE-GFP+ and Pdm1+cells). NRE-GFP+ and Pdm1- cells are EBs. NRE-GFP- and Pdm1+ cells are mature ECs. (I) Quantification of the ratio of NRE-GFP+ and Pdm1+ cells account for GFP+ cells in a 10,000 μm2 area of the R4 region midguts as shown in (G-H). The number n represents the ROI in midguts from each experiment. One dot corresponds to one ROI (10,000 μm2 area). (J-L) Immunofluorescence analyses of control (FRT40A, J), cad2 mutant (K), and cad-HA overexpressing (L) mosaic analysis with repressible cell marker (MARCM) clones (green, outlined by white dotted lines) 7 days after clone induction (ACI) of flies. Pdm1 staining (red) was used to visualize ECs. White arrows indicate Pdm1+ polyploid ECs, and white arrowheads indicate Pdm1- diploid cells in (J). (M) Quantification of the ratio of Pdm1+ cells per clone with indicated genotypes of experiments presented in (J-L). Each dot corresponds to one clone. (N) Quantification of the GFP+ cells per clone with indicated genotypes of experiments presented in (J-L). Each dot corresponds to one clone. (O-Q) Immunofluorescence analyses of control (FRT40A, O), cad2 mutant (P), and cad-HA overexpressing (Q) mosaic analysis with repressible cell marker (MARCM) clones (green) 7 days after clone induction (ACI) of flies. Dl staining (red) was used to visualize ISCs. White arrows indicate ISCs in clones. (R) Quantification of the ratio of Dl+ cells per clone with indicated genotypes of experiments presented in (O-Q). Each dot corresponds to one clone. (S) Quantification of the average size of Pdm1+ ECs in control clones (FRT40A) and cad2 mutant clones. The number n represents Pdm1+ ECs in clones. DAPI-stained nuclei (blue). Scale bars represent 10μm (Fig 3A, 3B, 3D, 3E, 3G and 3H), or 5μm (Fig 3J–3L and 3O–3Q). Error bars represent SD. Student’s t-tests were used to assess statistical significance: *p < 0.05, **p < 0.01, ***p < 0.001, ****p < 0.0001, and ns (non-significant), which represents p > 0.05. See also S3 Fig.
Fig 4
Fig 4. Cad regulates ISC-to-EC differentiation by modulating Sox21a expression.
(A) Volcano plots of differentially expressed genes in a pair-wise comparison of cad-depleted Drosophila (esgts-Gal4>cad RNAi) midguts to control Drosophila (esgts-Gal4>UAS- lacZ) midguts. (B) Relative mRNA fold changes of Armadillo, Connectin, GATAe, E-cadherin, pdm1, and Sox21a in sorted esg+ cells from of young (2 days at 18°C then transferred to 29°C for 5 days) genotype control flies’ midguts (blue lines, esgts-Gal4-driven UAS-GFP) and cad-depleted midguts (red lines, esgts-Gal4-driven cad RNAi). The changes of expressions were plotted relative to genotype controls, which was set to 1. Error bars indicate the standard deviation (SD) of three independent experiments. (C-D) Representative images showing the expression of endogenous SOX21A-HA (red) in midguts of Drosophila carrying esgts-Gal4>UAS-GFP (control; C) and midguts carrying esgts-Gal4>cad RNAi (D). The right enlarged insets from (C-D) show the single channel of esg-GFP (green) and SOX21A-HA (red). (E) Quantification of fluorescence intensity of SOX21A-HA with indicated genotypes as shown in (C-D). One dot represents one esg-GFP+ cell. (F-G) Representative images showing the expression of endogenous SOX21A-HA (red) in midguts of Drosophila carrying esgts-Gal4>UAS-GFP (control; F) and midguts carrying esgts-Gal4>UAS-cad (G). Drosophila were treated with PQ (PQ-REC-1D). The right enlarged insets from (F-G) show the single channel of esg-GFP (green) and SOX21A-HA (red). (H) Quantification of fluorescence intensity of SOX21A-HA with indicated genotypes as shown in (F-G). One dot represents one esg-GFP+ cell. (I-L) Immunofluorescence images of esg-GFP (green) and Pdm1 (red) staining with the midgut section from the R4 region of control Drosophila (I; esgts-Gal4>UAS-GFP), Drosophila carrying esgts-Gal4>UAS-cad-HA (J), Drosophila carrying esgts-Gal4>UAS-Sox21a (K), and Drosophila carrying esgts-Gal4-driven UAS-cad-HA and UAS-Sox21a (L). Drosophila were treated with PQ. esg-GFP (green) represents ISCs and their differentiating cells. Pdm1 staining (red) was used to visualize differentiating ECs. White arrows indicate differentiating pre-ECs (esg-GFP+ and Pdm1+ cells). esg-GFP+ and Pdm1- cells are ISCs or EBs. esg-GFP- and Pdm1+ cells are mature ECs. (M) Quantification of the ratio of esg-GFP+ and Pdm1+ cells per 10,000 μm2 area of the R4 region midguts as indicated in (I-L). The number n represents the ROI in midguts from each experiment. One dot corresponds to one ROI (10,000 μm2 area). DAPI stained nuclei (blue). Scale bars represent 10 μm (Fig 4C, 4D, 4F, 4G and 4I–4L). Error bars represent SD. Student’s t-tests were used to assess significance: *p < 0.05, **p < 0.01, ***p < 0.001, ****p < 0.0001, and ns (non-significant), which represents p > 0.05. See also S4 Fig.
Fig 5
Fig 5. GATAe functions downstream of cad to regulate ISC-to-EC differentiation.
(A-D) Immunofluorescence images of esg-GFP (green) and Pdm1 (red) staining with the midgut section from the R4 region of control Drosophila (A, esgts-Gal4>UAS-GFP), Drosophila carrying esgts-Gal4>cad RNAi (B), Drosophila carrying esgts-Gal4>GATAe RNAi (C), and Drosophila carrying esgts-Gal4-driven cad RNAi and GATAe RNAi (D), under normal conditions. esg-GFP (green) represents ISCs and their differentiating cells. Pdm1 staining (red) was used to visualize differentiating ECs. White arrows indicate differentiating pre-ECs (esg-GFP+ and Pdm1+cells). esg-GFP+ and Pdm1- cells are ISCs or EBs. esg-GFP- and Pdm1+ cells are mature ECs. (E) Quantification of the ratio of esg-GFP+ and Pdm1+ cells per 10,000 μm2 area of the R4 region midguts of Drosophila with genotypes as indicated in (A-D). The number n represents the ROI in midguts from each experiment. One dot corresponds to one ROI (10,000 μm2 area). (F-I) Immunofluorescence images of NRE-GFP (green) and Pdm1 (red) staining of the midgut section from the R4 region of control Drosophila (F, NREts-Gal4>UAS-GFP), Drosophila carrying NREts-Gal4>cad RNAi (G), Drosophila carrying NREts-Gal4>GATAe RNAi (H), and Drosophila carrying NREts-Gal4-driven cad RNAi and GATAe RNAi (I), under normal conditions. Pdm1 staining (red) visualizes differentiating ECs. White arrows indicate differentiating pre-ECs (NRE-GFP+ and Pdm1+ cells). NRE-GFP+ and Pdm1- cells are EBs. NRE-GFP- and Pdm1+ cells are mature ECs. (J) Quantification of the ratio of NRE-GFP+ and Pdm1+ cells per 10,000 μm2 area of the R4 region midguts as indicated in (F-I). The number n represents the ROI in midguts from each experiment. One dot corresponds to one ROI (10,000 μm2 area). (K-N) Immunofluorescence images of esg-GFP (green) and Pdm1 (red) staining with the midgut section from the R4 region of control Drosophila (K, esgts-Gal4>UAS-GFP), Drosophila carrying esgts-Gal4>cad RNAi (L), Drosophila carrying esgts-Gal4>Notch RNAi (M), and Drosophila carrying esgts-Gal4-driven cad RNAi and Notch RNAi (N), under normal conditions. esg-GFP (green) represents ISCs and their differentiating cells. Pdm1 staining (red) was used to visualize differentiating ECs. White arrows indicate differentiating pre-ECs (esg-GFP+ and Pdm1+cells). esg-GFP+ and Pdm1- cells are ISCs or EBs. esg-GFP- and Pdm1+ cells are mature ECs. (O) Quantification of the ratio of esg-GFP+ and Pdm1+ cells per 10,000 μm2 area of the R4 region midguts as indicated in (K-N). The number n represents the ROI in midguts from each experiment. One dot corresponds to one ROI (10,000 μm2 area). DAPI stained nuclei (blue). Scale bars represent 10 μm (Fig 5A–5D, 5F–5I and 5K–5N). Error bars represent SD. Student’s t-tests were used to assess statistical significance: *p < 0.05, **p < 0.01, ***p < 0.001, ****p < 0.0001, and NS (non-significant), which represents p > 0.05. See also S5 Fig.
Fig 6
Fig 6. Cad promotes ISC-to-EC differentiation by manipulating the JAK/STAT signaling pathway.
(A-B) Representative images showing the expression of 10xSTAT-GFP (green) in midguts of Drosophila carrying esg-Gal4 only (control; A) and Drosophila carrying esg-Gal4>UAS-cad-HA (B) treated with PQ. Pdm1 (red) staining identifies pre-ECs and matured ECs. (C) Quantification of fluorescence intensity of 10xSTAT-GFP per esg+ cells in midguts with genotypes as indicated in (A-B). The number n represents counted cells. (D-G) Immunofluorescence images of esg-GFP (green) and Pdm1 (red) staining with the midgut section from the R4 region of control Drosophila (D, esgts-Gal4>UAS-GFP), Drosophila carrying esgts-Gal4>UAS-cad-HA (E), Drosophila carrying esgts-Gal4>UAS-hopTUM (F), and Drosophila carrying esgts-Gal4-driven UAS-cad-HA and UAS-hopTUM (G). Drosophila were treated with PQ. esg-GFP (green) identifies ISCs and their differentiating cells. Pdm1 staining (red) was used to visualize differentiating ECs. White arrows indicate differentiating pre-ECs (esg-GFP+ and Pdm1+cells). esg-GFP+ and Pdm1- cells are ISCs or EBs. esg-GFP- and Pdm1+ cells are matured ECs. (H) Quantification of the ratio of esg-GFP+ and Pdm1+ cells per 10,000 μm2 area of the R4 region midguts as indicated in (D-G). The number n represents the ROI in midguts from each experiment. One dot corresponds to one ROI (10,000 μm2 area). (I-L) Immunofluorescence images of esg-GFP (green) and Pdm1(red) staining with the midgut under normal condition. The midgut section from the R4 region of control flies (I, esgts-Gal4-driven UAS-GFP), Drosophila carrying esgts-Gal4-driven cad RNAi (J), Drosophila carrying esgts-Gal4-driven Stat92E RNAi (K), and Drosophila carrying esgts-Gal4-driven cad RNAi and Stat92E RNAi (L). esg-GFP (green) identifies ISCs and their differentiating cells. Pdm1 staining (red) was used to visualize differentiating ECs. White arrows indicate differentiating pre-ECs (esg-GFP+ and Pdm1+cells). esg-GFP+ and Pdm1- cells are ISCs or EBs. esg-GFP- and Pdm1+ cells are mature ECs. (M) Quantification of the ratio of esg-GFP+ and Pdm1+ cells per 10,000 μm2 area of the R4 region midguts as indicated in (I-L). The number n represents the region of interest in midguts from each experiment. One dot corresponds to one region of interest (ROI = 10,000 μm2 area). DAPI stained nuclei are shown in blue. Scale bars represent 10 μm (Fig 6A, 6B, 6D–6G and 6I–6L). Error bars represent SD. Student’s t-tests were used to assess statistical significance: *p < 0.05, **p < 0.01, ***p < 0.001, ****p < 0.0001, and NS (non-significant), which represents p > 0.05.
Fig 7
Fig 7. Reduction of cad expression in ISCs and progenitor cells represses age-associated gut hyperplasia in Drosophila.
(A-B) Immunofluorescence images of esg-GFP (green) and Pdm1 (red) staining with midgut from the PMG in 35-day-old (25 days at 18°C, then 10 days at 29°C) control Drosophila (A, esgts-Gal4>UAS-GFP) and 35-day-old Drosophila carrying esgts-Gal4>cad RNAi (B). esg-GFP (green) represents ISCs and their differentiating cells. Pdm1 staining (red) was used to visualize differentiating ECs. White arrows indicate differentiating pre-ECs (esg-GFP+ and Pdm1+ cells). esg-GFP+ and Pdm1- cells are ISCs or EBs. esg-GFP- and Pdm1+ cells are mature ECs. (C) Quantification of the ratio of esg-GFP+ Pdm1+ cells per 10,000 μm2 area from PMG of control Drosophila with genotypes as indicated in (A-B). The number n is indicated. Each dot represents one midgut. Each dot corresponds to one ROI (10,000 μm2 area). (D-E) Immunofluorescence images of midgut sections from the R4 region in 35-day-old (25 days at 18°C, then 10 days at 29°C) control Drosophila (D, esgts-Gal4>UAS-GFP) and Drosophila carrying esgts-Gal4>cad RNAi (E). esg-GFP (green) indicates ISCs and their differentiating cells. (F) Quantification of esg-GFP+ cell numbers in experiments (D-E). The number n represents the ROI in midguts from each experiment. One dot corresponds to one ROI (10,000 μm2 area). (G-H) Quantification of pH3+ cell numbers in midguts from 35-day-old (25 days at 18°C, then 10 days at 29°C) control Drosophila (esgts-Gal4>UAS-GFP in G and NREts-Gal4>UAS-GFP in H), Drosophila carrying esgts-Gal4>cad RNAi (G), and NREts-Gal4>cad RNAi (H). The number n represents the whole midguts. One dot corresponds to one midgut. (I-J) Immunofluorescence images of midgut sections from the R4 region in 35-day-old (25 days at 18°C, then 10 days at 29°C) control Drosophila (I, esgts-Gal4>UAS-GFP) and Drosophila carrying esgts-Gal4>cad RNAi (J). esg-GFP (green) indicates ISCs and their differentiating cells. Dl (red) staining was used to visualize ISCs. (K) Quantification of Dl+ cell numbers in experiments (I-J). The number n represents the ROI in midguts from each experiment. One dot corresponds to one ROI (10,000 μm2 area). (L) Relative mRNA fold changes of Socs36E in sorted esg+ cells from midguts of aged (25 days at 18°C add 10 days at 29°C) control Drosophila (blue lines, esgts-Gal4>UAS-GFP) and aged Drosophila with cad depleted (red lines, esgts-Gal4>cad RNAi). The changes of expressions were plotted relative to the control Drosophila, which was set to 1. (M-N) Quantification of esg+ (M) or pH3+ (N) cell numbers in midguts from 35-day-old (25 days at 18°C, then 10 days at 29°C) control Drosophila (esgts-Gal4>UAS-GFP), Drosophila carrying esgts-Gal4> cad RNAi, and Drosophila carrying esgts-Gal4> cad RNAi; Stat92E RNAi. The number n represents the whole midguts (N). One dot corresponds to one midgut in N. The number n represents the ROI in midguts from each experiment in M. One dot corresponds to one ROI (10,000 μm2 area) in M. (O-P) Quantification of esg+ (O) or pH3+ (P) cell numbers in midguts from 35-day-old (25 days at 18°C, then 10 days at 29°C) control Drosophila (esgts-Gal4>UAS-GFP), Drosophila carrying esgts-Gal4> cad RNAi, and Drosophila carrying esgts-Gal4-driven cad RNAi and Sox21a RNAi. The number n represents the whole midguts in P. One dot corresponds to one midgut in P. The number n represents the ROI in midguts from each experiment in O. One dot corresponds to one ROI (10,000 μm2 area) in O. (Q) Survival rate of control Drosophila (esgts-Gal4-driven UAS-GFP) and Drosophila carrying esgts-Gal4> UAS-cad under PQ treatment (see methods). (R) Schematic model of the underlying mechanism. In young Drosophila, CAD expresses at a basal level in ISCs and EBs. The basal expressed cad prevents the overexpression of SOX21A and GATAe transcription factors in ISCs and EBs, which prevents the ISCs from producing ECs unless the intestinal epithelia are damaged. CAD represses SOX21A and GATAe expression in ISCs and EBs by inhibiting the activation of JAK/STAT signaling. The expression of CAD increases in ISCs and EBs of Drosophila during aging. Ultimately, this leads to a decrease of differentiation efficiency of ISCs and EBs with age, which, in turn, results in gut hyperplasia as indicated by the continuous accumulation of ISCs and their differentiating progenies (i.e., esg+ polyploid cells) in the midguts of aged Drosophila. DAPI stained nuclei are shown in blue. Scale bars represent 10 μm (Fig 7A, 7B, 7I and 7J) or 20 μm (Fig 7D and 7E). Error bars represent SD. Student’s t-tests were used to assess statistical significance. For the survival test, the log-rank test was used to analyze the statistical significance: *p < 0.05, **p < 0.01, ***p < 0.001, ****p < 0.0001, and NS (non-significant), which represents p > 0.05. See also S7 Fig.

Similar articles

Cited by

References

    1. Otsuki L, Brand AH. Cell cycle heterogeneity directs the timing of neural stem cell activation from quiescence. Science. 2018;360(6384):99–102. Epub 2018/04/07. doi: 10.1126/science.aan8795 ; PubMed Central PMCID: PMC6538531. - DOI - PMC - PubMed
    1. Ambrosi TH, Scialdone A, Graja A, Gohlke S, Jank AM, Bocian C, et al. Adipocyte Accumulation in the Bone Marrow during Obesity and Aging Impairs Stem Cell-Based Hematopoietic and Bone Regeneration. Cell Stem Cell. 2017;20(6):771–84 e6. Epub 2017/03/24. doi: 10.1016/j.stem.2017.02.009 ; PubMed Central PMCID: PMC5459794. - DOI - PMC - PubMed
    1. Gervais L, Bardin AJ. Tissue homeostasis and aging: new insight from the fly intestine. Curr Opin Cell Biol. 2017;48:97–105. Epub 2017/07/19. doi: 10.1016/j.ceb.2017.06.005 . - DOI - PubMed
    1. Stainier DY. No organ left behind: tales of gut development and evolution. Science. 2005;307(5717):1902–4. Epub 2005/03/26. doi: 10.1126/science.1108709 . - DOI - PubMed
    1. Micchelli CA, Perrimon N. Evidence that stem cells reside in the adult Drosophila midgut epithelium. Nature. 2006;439(7075):475–9. Epub 2005/12/13. doi: 10.1038/nature04371 . - DOI - PubMed

Publication types

MeSH terms

LinkOut - more resources