. 2021 Sep 6;220(9):e202105067.
doi: 10.1083/jcb.202105067. Epub 2021 Jul 6.

Label-retention expansion microscopy

Affiliations

Label-retention expansion microscopy

Xiaoyu Shi et al. J Cell Biol. .

Abstract

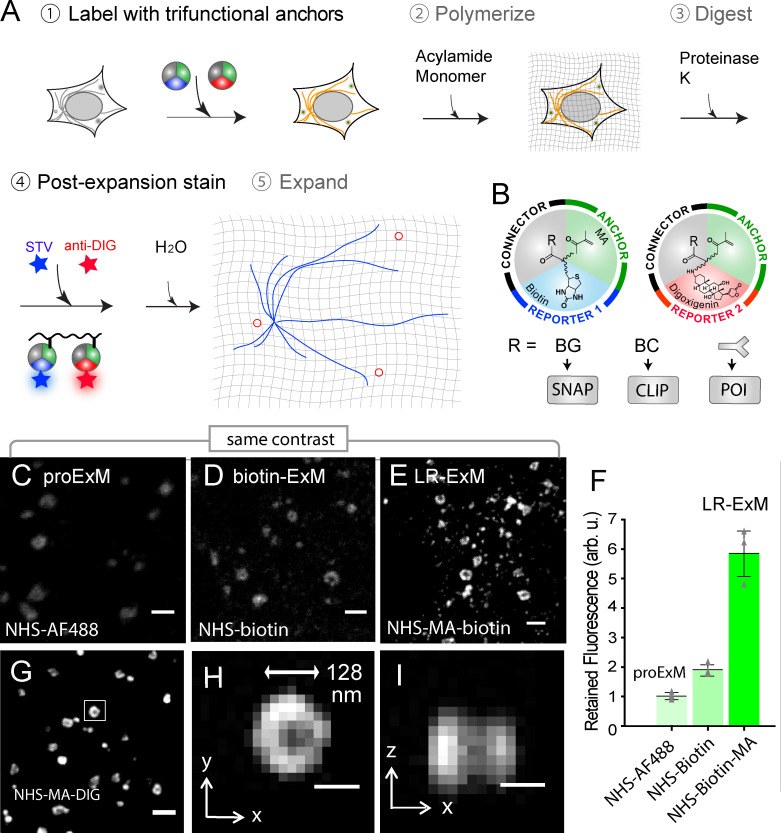
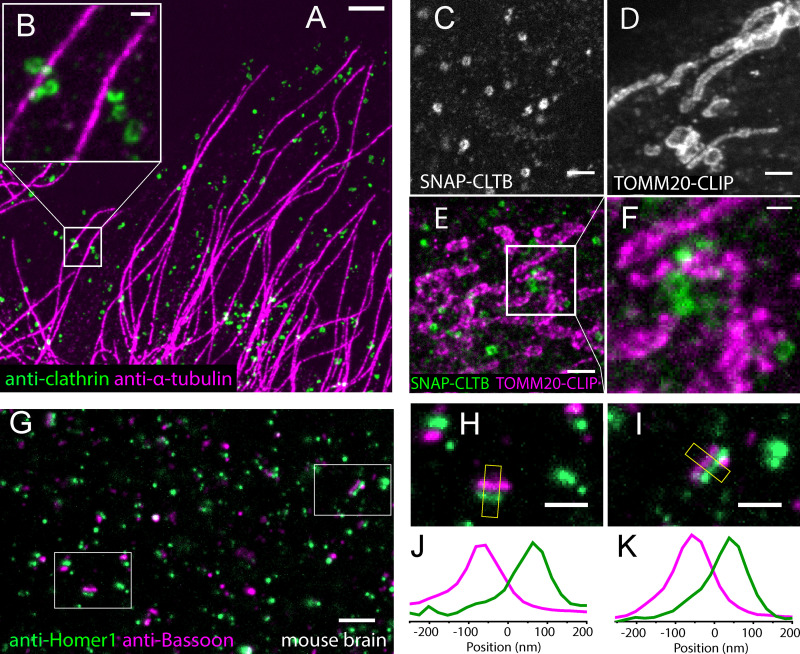
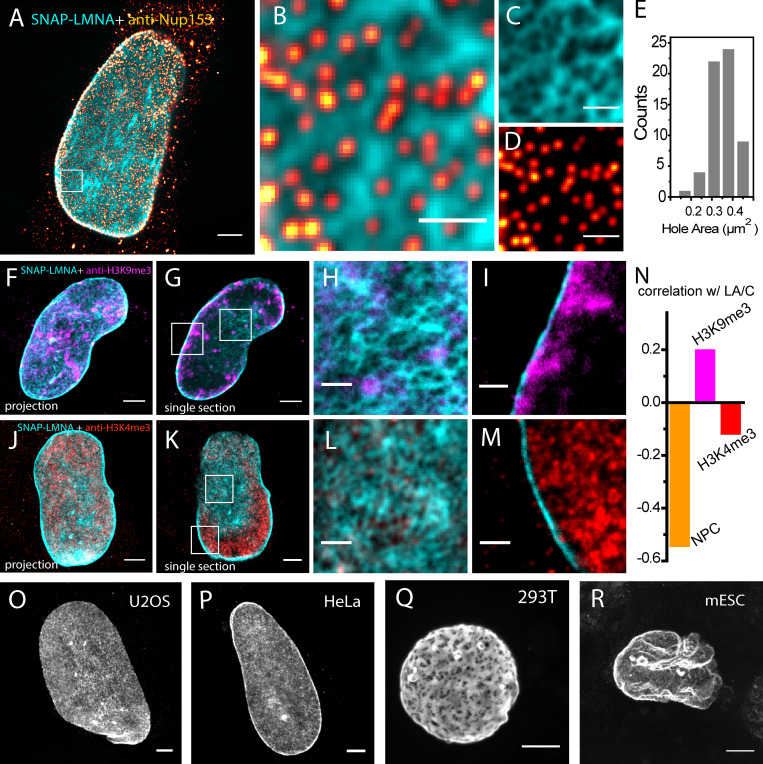
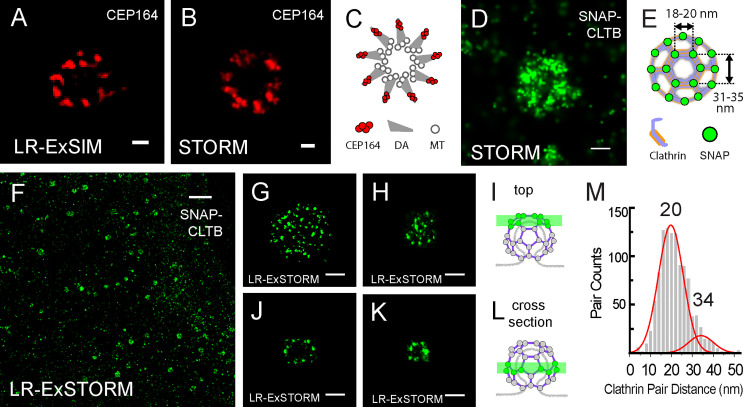
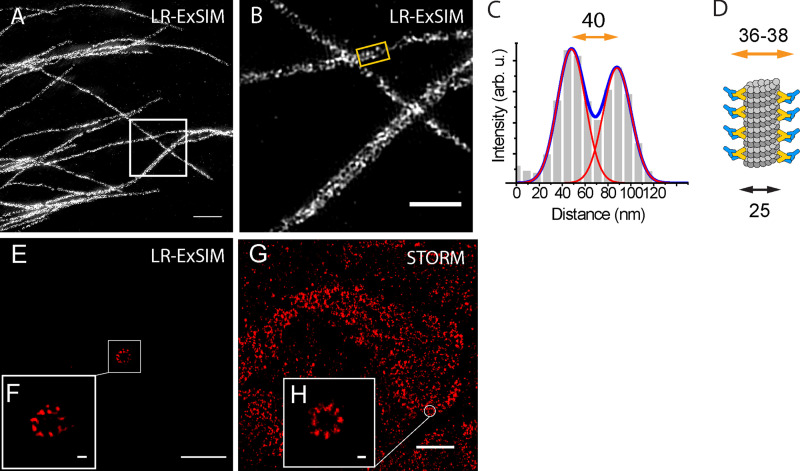
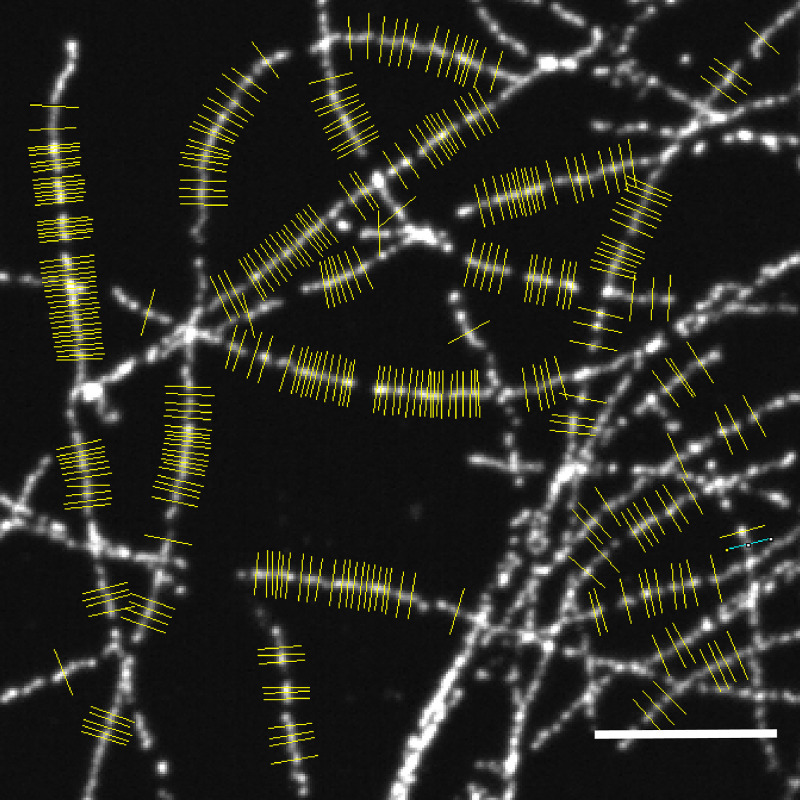
Expansion microscopy (ExM) increases the effective resolving power of any microscope by expanding the sample with swellable hydrogel. Since its invention, ExM has been successfully applied to a wide range of cell, tissue, and animal samples. Still, fluorescence signal loss during polymerization and digestion limits molecular-scale imaging using ExM. Here, we report the development of label-retention ExM (LR-ExM) with a set of trifunctional anchors that not only prevent signal loss but also enable high-efficiency labeling using SNAP and CLIP tags. We have demonstrated multicolor LR-ExM for a variety of subcellular structures. Combining LR-ExM with superresolution stochastic optical reconstruction microscopy (STORM), we have achieved molecular resolution in the visualization of polyhedral lattice of clathrin-coated pits in situ.


Figures

Figure 1.
Figure 1.
Workflow and characterization of LR-ExM.(A) Workflow of LR-ExM. (B) Schematic of trifunctional anchors. (C–E) ExM confocal images of CCPs in U2OS cells indirectly immunostained for clathrin heavy-chain (POI). (C) ProExM using AF488-conjugated secondary antibodies. (D) ExM with postexpansion labeling using biotin-conjugated antibodies. (E) LR-ExM using antibodies conjugated with NHS-MA-biotin trifunctional anchor. Samples in D and E were postexpansion stained with streptavidin-AF488. (F) Intensity quantification of C–E. Error bars represent SD. n = 3 for each case. (G) LR-ExM confocal image of CCPs in U2OS cells immunostained indirectly with secondary antibodies conjugated with NHS-MA-DIG anchor, postexpansion stained with anti-DIG antibody. (H and I) Cross sections of the CCP in the boxed area of G. The length expansion ratios for images in C, D,E, and G–I are 4.3, 4.5, 4.6, and 4.3, respectively. The length expansion ratio for the samples used in plot F is 4.5 ± 0.2. Scale bars, 500 nm (C–E and G) and 100 nm (H and I). All scale bars are in preexpansion units. arb. u., arbitrary units; STV, streptavidin.
Figure 2.
Figure 2.
Structures of trifunctional anchors. HOOC/NHS-MA-biotin, HOOC/NHS-MA-DIG, BG-MA-biotin, BG-MA-DIG, and BC-MA-DIG.
Figure S1.
Figure S1.
Synthetic schemes of trifunctional anchors. (A) Synthetic routes of HOOC-biotin-MA and SNAP-biotin-MA. (B) Synthetic route of HOOC-DIG-MA. (C) Synthetic routes of SNAP-DIG-MA and CLIP-DIG-MA.
Figure S2.
Figure S2.
Comparison of fluorescence intensities resulting from different ExM methods.(A–D) Images of microtubules prepared with proExM with AF488-labeled secondary antibody (A), biotin-ExM with the biotin-NHS–labeled secondary antibody (B), LR-ExM with biotin-NHS and MA-NHS–colabeled secondary antibody (C), and LR-ExM with biotin-MA-NHS–labeled secondary antibody (D). Images A–D have the same contrast to show the relative brightness of the stain achieved in each case. Samples were processed side by side with the same immunostaining, digestion, and imaging conditions. (E–H) The microtubules in A–D are tracked and marked in yellow and red in E–H by a Fiji plugin JFilament, respectively. (I) Histogram of retained fluorescence represented in A–D. n = 3 for each case. The retained fluorescence was normalized by the total length of microtubules in each image and the ratios of AF488/Ab, biotin/Ab, and AF488/streptavidin. All samples were digested by incubating in 8 U/ml proteinase K for 16 h at room temperature. Scale bars, 2 µm.
Figure 3.
Figure 3.
Two-color LR-ExM images using immunostaining and protein tag approaches.(A) Two-color LR-ExM confocal image of microtubules labeled with NHS-MA-biotin–conjugated secondary antibodies (magenta) and CCPs labeled with NHS-MA-DIG–conjugated secondary antibodies (green) in a U2OS cell. (B) Magnified view. (C–E) LR-ExM confocal images of CCPs and/or mitochondria in HeLa cells labeled using SNAP tag–labeled clathrin (C), CLIP tag–labeled TOMM20 (D), and two-color imaging (E). (F) Magnified view. (G) LR-ExM confocal image of mouse brain slice indirectly immunostained for the presynaptic marker Bassoon (magenta) and the postsynaptic marker Homer1 (green). (H and I) Zoomed-in images of synapses. (J and K) Transverse intensity profiles along the yellow box long axes. Bassoon is labeled with NHS-MA-DIG–conjugated secondary antibodies, and Homer1 is labeled with NHS-MA-biotin–conjugated secondary antibodies. All samples are postexpansion stained with streptavindin-AF488 and or anti-Digoxin-AF594. The length expansion ratios for images in A and B; C; D; E and F; and G–I are 4.7, 4.4, 4.4, 4.5, and 4.2, respectively. Scale bars, 1 µm (A and G), 200 nm (B, F, H, and I), and 500 nm (C–E). All scale bars are in preexpansion units.
Figure 4.
Figure 4.
LR-ExM reveals subcellular protein organizations.(A) Two-color confocal LR-ExM of SNAP-tagged lamin A/C (cyan) and immunostained NPC (red hot) of a HeLa cell. (B) Magnified view. (C and D) Views of individual channels of B. Note the cytoplasmic background in A is caused by the anti-NUP153 antibody. (E) Histogram of lamin hole area in the boxed region. (F–I) Two-color confocal LR-ExM of SNAP-tagged lamin A/C (cyan) and immunostained H3K9me3 (magenta) of a HeLa cell, with a maximum intensity project of a z stack covering the bottom half of the nucleus (F), a single section of the nucleus (G), and magnified views of the boxed regions in G (H and I). (J–M) Two-color confocal LR-ExM of SNAP-tagged lamin A/C (cyan) and immunostained H3K4me3 (red), with a maximum intensity projection of a z stack covering the bottom half of the nucleus (J), a single section of the nucleus (K), and magnified views (L and M) of the boxed regions in K. (N) Correlation coefficients of NPC with lamin A/C, H3K9me3 with lamin A/C, and H3K4me3 with lamin A/C. (O–R) Confocal LR-ExM of lamin A/C in U2OS (O), HeLa (P), HEK 293T (Q), and mouse embryonic stem cells (mESC; R) showing maximum intensity projections over the bottom half of a nucleus. The length expansion ratios for images in A–D, F–I, J–M, O, P, Q, and R are 4.5, 4.5, 4.3, 4.2, 4.3, 4.6, and 4.4, respectively. Scale bars, 2 µm (A, F, G, J, K, and O–R) and 500 nm (B–D, H, I, L, and M). All scale bars are in preexpansion units.
Figure 5.
Figure 5.
LR-ExSIM and LR-ExSTORM reveal subcellular protein organization.(A) LR-ExSIM image of Cep164 in distal appendages of a primary cilium indirectly immunostained with NHS-MA-biotin secondary antibodies. (B) STORM image of Cep164 distal appendages of unexpanded cilium. (C) Schematic of the structure of distal appendages (DA) of the primary cilium. MT, microtubule. (D) STORM image of an unexpanded HeLa cell overexpressing SNAP-CLTB and stained with BG-AF647. (E) Schematic of the structure of a CCP with SNAP tag–labeled CLTB. (F) LR-ExSTORM image of a HeLa cell overexpressing SNAP-CLTB, stained with BG-MA-biotin, and postexpansion labeled with streptavidin-AF647. (G and H) Images of x-y cross sections at the top of single CCPs as illustrated in I. (JL) Images of x-y cross sections in the middle of single CCPs (J and K) as illustrated in L. Images in G–K are different CCPs. (M) Nearest cluster distance analysis of 134 CCPs imaged with LR-STORM. The length expansion ratios for images in A, F, G, H, J, and K are 4.2, 3.3, 3.3, 3.1, 3.1, and 3.1, respectively. The length expansion ratio for samples used in plot M is 3.2 ± 0.2. Scale bars, 100 nm (A, B, and G–K), 200 nm (D), and 2 µm (F). All scale bars in LR-ExM images are in preexpansion units.
Figure S3.
Figure S3.
3D-printed chamber for drift reduction of the hydrogel.
Figure S4.
Figure S4.
LR-ExSIM of microtubules.(A) LR-ExSIM image of microtubules in a U2OS cell stained with antibody conjugated with NHS-MA-DIG anchors. (B) Magnification of A. (C) The transverse profile of the microtubule in the gold box in B. (D) Schematic of the structure of an immunostained microtubule. By fitting the peaks to Gaussian functions, we calculated the resolution (FWHM) of LR-ExSIM to be 34 nm. (E) LR-ExSIM image of Cep164 in distal appendages of a primary cilium of an expanded mouse embryonic fibroblast indirectly immunostained with NHS-MA-biotin secondary antibodies. The length expansion ratio is 4.2. (F) Magnified view of E. (G) STORM image of Cep164 in distal appendages of motile cilia of an unexpanded multiciliated mouse tracheal epithelial cell. (H) Magnified view of G. LR-ExSIM (E and F) and STORM (G and H) reveal structure of distal appendages with similar super resolution. The same primary antibody was used for both images. Scale bars, 1 µm (A), 500 nm (B), 2 µm (E and G), and 100 nm (F and H).
Figure S5.
Figure S5.
Resolution measurement for LR-ExM confocal images. The transverse profiles of the microtubule cross sections marked in yellow were used to measure the resolution of LR-ExM using a confocal microscope. Scale bar, 2 µm.
Scheme 1.
Scheme 1.
Azide 4 ( McLaughlin et al., 2003 ).
Scheme 2.
Scheme 2.
Click product 6.
Scheme 3.
Scheme 3.
Methyl ester 7.
Scheme 4.
Scheme 4.
Carboxylic acid 8.
Scheme 5.
Scheme 5.
Trifunctional anchor 9.
Scheme 6.
Scheme 6.
MA 10.
Scheme 7.
Scheme 7.
Carboxylic acid 11.
Scheme 8.
Scheme 8.
Trifunctional anchor 12.
Scheme 9.
Scheme 9.
Trifunctional anchor 13.

References

    1. Bates, M., Huang B., and Zhuang X.. 2008. Super-resolution microscopy by nanoscale localization of photo-switchable fluorescent probes. Curr. Opin. Chem. Biol. 12:505–514. 10.1016/j.cbpa.2008.08.008 - DOI - PMC - PubMed
    1. Cahoon, C.K., Yu Z., Wang Y., Guo F., Unruh J.R., Slaughter B.D., and Hawley R.S.. 2017. Superresolution expansion microscopy reveals the three-dimensional organization of the Drosophila synaptonemal complex. Proc. Natl. Acad. Sci. USA. 114:E6857–E6866. 10.1073/pnas.1705623114 - DOI - PMC - PubMed
    1. Chang, J.B., Chen F., Yoon Y.G., Jung E.E., Babcock H., Kang J.S., Asano S., Suk H.J., Pak N., Tillberg P.W., et al. . 2017. Iterative expansion microscopy. Nat. Methods. 14:593–599. 10.1038/nmeth.4261 - DOI - PMC - PubMed
    1. Chen, F., Tillberg P.W., and Boyden E.S.. 2015. Optical imaging. Expansion microscopy. Science. 347:543–548. 10.1126/science.1260088 - DOI - PMC - PubMed
    1. Chen, F., Wassie A.T., Cote A.J., Sinha A., Alon S., Asano S., Daugharthy E.R., Chang J.B., Marblestone A., Church G.M., et al. . 2016. Nanoscale imaging of RNA with expansion microscopy. Nat. Methods. 13:679–684. 10.1038/nmeth.3899 - DOI - PMC - PubMed

Publication types

MeSH terms