

Mass Spectrometry Imaging of Lipids with Isomer Resolution Using High-Pressure Ozone-Induced Dissociation
- PMID: 34228922
- PMCID: PMC8295983
- DOI: 10.1021/acs.analchem.1c01377
Mass Spectrometry Imaging of Lipids with Isomer Resolution Using High-Pressure Ozone-Induced Dissociation
Abstract
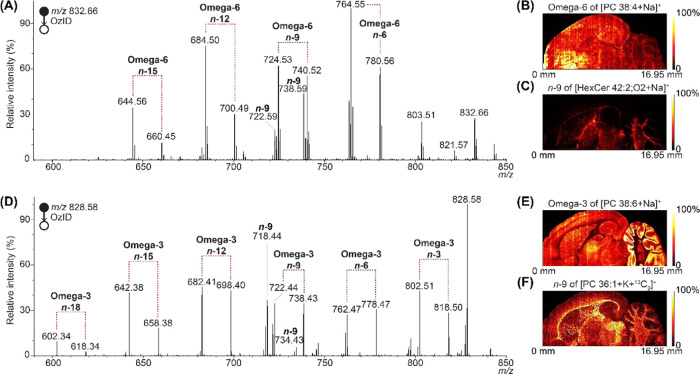
Mass spectrometry imaging (MSI) of lipids within tissues has significant potential for both biomolecular discovery and histopathological applications. Conventional MSI technologies are, however, challenged by the prevalence of phospholipid regioisomers that differ only in the location(s) of carbon-carbon double bonds and/or the relative position of fatty acyl attachment to the glycerol backbone (i.e., sn position). The inability to resolve isomeric lipids within imaging experiments masks underlying complexity, resulting in a critical loss of metabolic information. Herein, ozone-induced dissociation (OzID) is implemented on a mobility-enabled quadrupole time-of-flight (Q-TOF) mass spectrometer capable of matrix-assisted laser desorption/ionization (MALDI). Exploiting the ion mobility region in the Q-TOF, high number densities of ozone were accessed, leading to ∼1000-fold enhancement in the abundance of OzID product ions compared to earlier MALDI-OzID implementations. Translation of this uplift into imaging resulted in a 50-fold improvement in acquisition rate, facilitating large-area mapping with resolution of phospholipid isomers. Mapping isomer distributions across rat brain sections revealed distinct distributions of lipid isomer populations with region-specific associations of isomers differing in double bond and sn positions. Moreover, product ions arising from sequential ozone- and collision-induced dissociation enabled double bond assignments in unsaturated fatty acyl chains esterified at the noncanonical sn-1 position.
Conflict of interest statement
The authors declare no competing financial interest.
Figures


References
-
- Soteriou C.; Kalli A. C.; Connell S. D.; Tyler A. I. I.; Thorne J. L. Advances in understanding and in multi-disciplinary methodology used to assess lipid regulation of signalling cascades from the cancer cell plasma membrane. Prog. Lipid Res. 2020, 81, 101080 10.1016/j.plipres.2020.101080. - DOI - PubMed
-
- Dautel S. E.; Kyle J. E.; Clair G.; Sontag R. L.; Weitz K. K.; Shukla A. K.; Nguyen S. N.; Kim Y. M.; Zink E. M.; Luders T.; Frevert C. W.; Gharib S. A.; Laskin J.; Carson J. P.; Metz T. O.; Corley R. A.; Ansong C. Lipidomics reveals dramatic lipid compositional changes in the maturing postnatal lung. Sci. Rep. 2017, 7, 40555 10.1038/srep40555. - DOI - PMC - PubMed
-
- Jové M.; Pradas I.; Naudi A.; Rovira-Llopis S.; Banuls C.; Rocha M.; Portero-Otin M.; Hernandez-Mijares A.; Victor V. M.; Pamplona R. Lipidomics reveals altered biosynthetic pathways of glycerophospholipids and cell signaling as biomarkers of the polycystic ovary syndrome. Oncotarget 2018, 9, 4522–4536. 10.18632/oncotarget.23393. - DOI - PMC - PubMed
-
- Tyurina Y. Y.; St Croix C. M.; Watkins S. C.; Watson A. M.; Epperly M. W.; Anthonymuthu T. S.; Kisin E. R.; Vlasova I. I.; Krysko O.; Krysko D. V.; Kapralov A. A.; Dar H. H.; Tyurin V. A.; Amoscato A. A.; Popova E. N.; Bolevich S. B.; Timashev P. S.; Kellum J. A.; Wenzel S. E.; Mallampalli R. K.; Greenberger J. S.; Bayir H.; Shvedova A. A.; Kagan V. E. Redox (phospho)lipidomics of signaling in inflammation and programmed cell death. J. Leukocyte Biol. 2019, 106, 57–81. 10.1002/JLB.3MIR0119-004RR. - DOI - PMC - PubMed
Publication types
MeSH terms
Substances
Grants and funding
LinkOut - more resources
Full Text Sources
Medical
