. 2021 Jul 14;21(13):5697-5705.
doi: 10.1021/acs.nanolett.1c01421. Epub 2021 Jul 6.

Size-Controlled and Shelf-Stable DNA Particles for Production of Lentiviral Vectors

Affiliations

Size-Controlled and Shelf-Stable DNA Particles for Production of Lentiviral Vectors

Yizong Hu et al. Nano Lett. .

Abstract

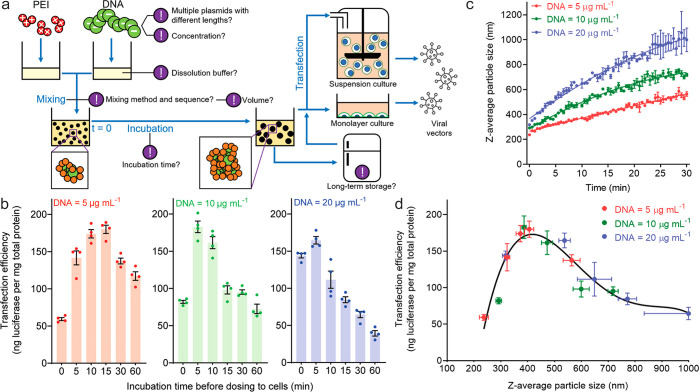
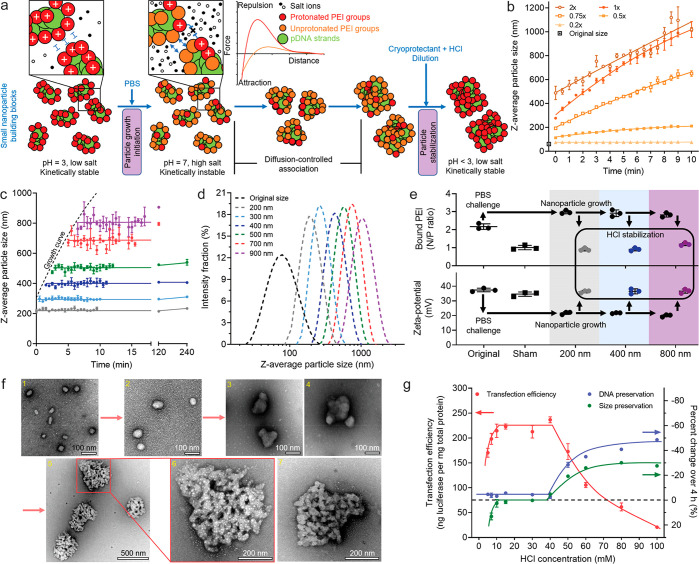
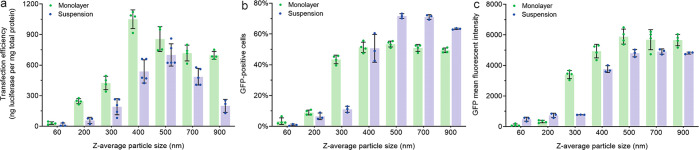
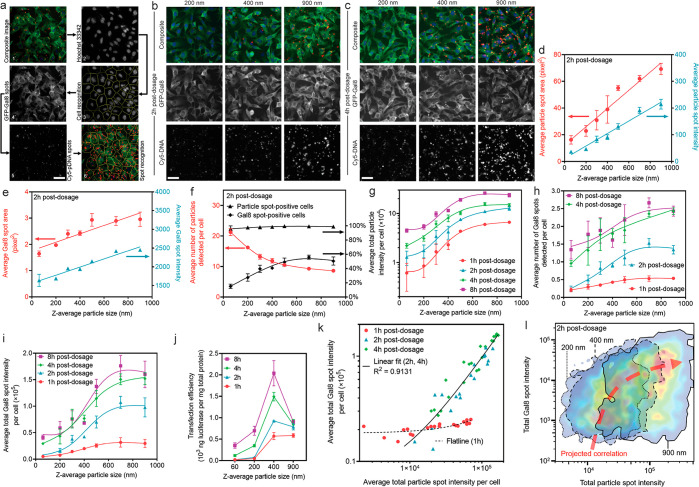
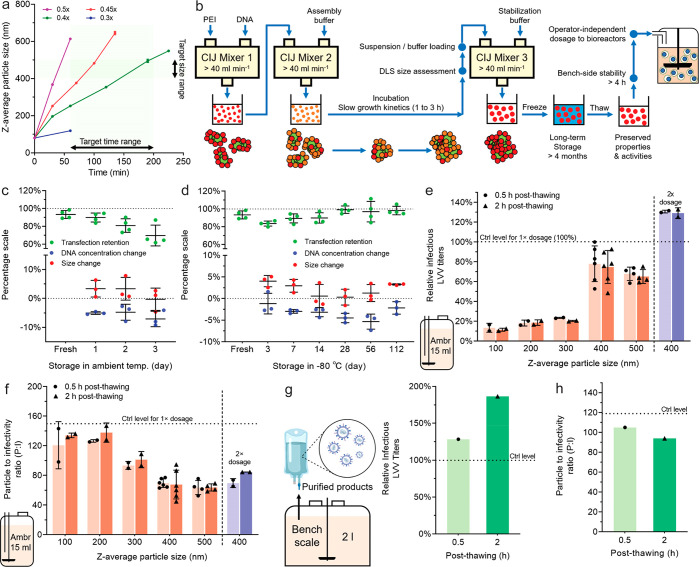
Polyelectrolyte complex particles assembled from plasmid DNA (pDNA) and poly(ethylenimine) (PEI) have been widely used to produce lentiviral vectors (LVVs) for gene therapy. The current batch-mode preparation for pDNA/PEI particles presents limited reproducibility in large-scale LVV manufacturing processes, leading to challenges in tightly controlling particle stability, transfection outcomes, and LVV production yield. Here we identified the size of pDNA/PEI particles as a key determinant for a high transfection efficiency with an optimal size of 400-500 nm, due to a cellular-uptake-related mechanism. We developed a kinetics-based approach to assemble size-controlled and shelf-stable particles using preassembled nanoparticles as building blocks and demonstrated production scalability on a scale of at least 100 mL. The preservation of colloidal stability and transfection efficiency was benchmarked against particles generated using an industry standard protocol. This particle manufacturing method effectively streamlines the viral manufacturing process and improves the production quality and consistency.

Keywords: kinetic growth; lentiviral vector production; particle size; plasmid DNA; poly(ethylenimine); transfection.


Conflict of interest statement

The authors declare the following competing financial interest(s): Y.H., Y.Z., and H.-Q.M. are inventors on patents and patent applications filed through and managed by Johns Hopkins Technology Ventures. N.D.S. is a Scientist in Process Development at bluebird bio, Inc. and holds company stocks. S.K.R. and H.-Q.M. are co-founders and equity holders of SpaceTime Therapeutics LLC.

Figures

Figure 1
Figure 1
Size of pDNA/PEI particles dictates their transfection efficiency in LVV production cells. (a) Schematic of preparation of pDNA/PEI particles and transfection process for production of LVVs. Each exclamation mark indicates a critical process control parameter influencing transfection outcomes. (b) Transfection efficiencies, characterized as transgene expression levels of the luciferase reporter, in a monolayer culture of HEK293T cells as a function of pDNA concentration at the mixing step and incubation time (10 s to 60 min) before dosage. For the group of mixing at a DNA concentration of 5, 10, or 20 μg/mL, the particles were diluted 5, 10, or 20 times, respectively, to 1 μg/mL to dose cells. (c) Growth in the average size (z-average diameter given by dynamic light scattering, DLS) of pDNA/PEI particles following mixing of pDNA and PEI solutions in Opti-MEM. The growth kinetics is dependent on the concentration of pDNA. The error bars were derived from three independent experiments, demonstrating reproducibility and predictability under the experimental conditions used. (d) Direct correlation between transfection efficiency and the z-average particle size based on data points from all experiments from (b) and (c) with varying pDNA concentrations and incubation times.
Figure 2
Figure 2
Process for production of size-controlled pDNA/PEI particles in the range of 60–1000 nm through controlling the assembly kinetics and surface charge. (a) Schematic of the stepwise kinetic growth and quenching. (b) Predicable size growth induced under different concentrations of PBS. (c) The particle size growth was arrested by dilution with 20 mM HCl in 19% (w/w) trehalose solution at different time points along the growth curve in 1× PBS. (d) The z-average diameter distributions measured by DLS of a series of stabilized particles with distinct sizes. (e) The ζ potential, and bound PEI content (measured by N/P ratio) changed along with the growth and stabilization steps. The particles in the sham control were treated with premixed 1× PBS and 20 mM HCl solutions, and the size stayed unchanged (66 nm) after the treatment. (f) TEM images of the particles obtained under the conditions of (1) original 66 nm nanoparticles as the building blocks, (2) stabilized particles with an average size of 120 nm, (3, 4) stabilized particles with an average size of 180 nm, (5, 6) stabilized 400 nm particles with an enlarged view of one of the particles, and (7) another enlarged 400 nm particle with less salt precipitation (white speckles) in the negatively stained region. (g) Effect of HCl concentration used in the quenching step on size stability, DNA protection, and transfection efficiency of the 400 nm particles. Note that the percentage axis is inverted to spread data points, showing that a high HCl concentration resulted in size shrinkage and loss of pDNA. In (b) and (c) the error bars were derived from three independent experiments, demonstrating the predictability and reproducibility of the process. In (g) the error bars were derived from three replicates within a single experiment.
Figure 3
Figure 3
Transfection efficiencies of stabilized particles with controlled sizes ranging from 60 to 1000 nm. (a) Efficiency of transgene expression of luciferase as a reporter. (b, c) The efficiency of transgene expression of GFP is shown in (b) for the percentage of GFP-positive cells and (c) for the mean fluorescent intensity in the population of GFP-positive cells. For a monolayer culture of HEK293T cells, the cells were harvested and lysed at 24 h post-transfection, and the error bars present the standard deviation from four replicates in a single experiment; for the suspension culture of HEK293F cells, the cells were harvested and lysed at 48 h post-transfection, and the error bars present the standard deviation of three or four independent experiments (each was conducted in a single well of a 12-well plate).
Figure 4
Figure 4
Quantitative Cellomics high-content analysis (HCA) of cellular uptake and endosomal escape by particles with different sizes. (a) The image analysis modality to analyze fixed cells directly in the tissue culture plates. Representative images are shown in (b) at 2 h and (c) at 4 h after incubation with particles of different sizes. Quantitative results are presented in terms of (d) particle spot characteristics (area and intensity), directly suggesting successful size control during particle–cell interactions. (e) Gal8 spot characteristics (area and intensity) indicating the formation of larger endosomal vesicles by larger particles. (f) Frequency of detected particles and Gal8 spots in cells at 2 h. (g) Average total particle intensity per cell at all time points as a representative measure of total particle uptake quantity. (h) Average number of Gal8 spots per cell at all time points as an indication of endosomal escape level, serving as a predictive index for transfection efficiency according to previous reports using this assay. (i) Quantitative measure of overall endosomal escape degree, i.e., average total Gal8 spot intensity per cell, due to different Gal8 spot characteristics observed for different particle sizes. (j) Transfection efficiencies (luciferase reporter expression level) as a result of incubation with particles at different sizes for different periods of time, which correlated well with the trends of total cellular uptake and endosomal escape levels. (k) Regardless of the particle size, fitting the overall endosomal escape level (Y axis) of all plate well-averaged data points against the overall cellular uptake level (X axis) shows a strong positive correlation at 2–4 h postdosage. In the figure, n = 21 wells for the fitted line of 1 h and n = 42 wells for the fitted line of 2 and 4 h. (l) Fitting the endosomal escape level in a single cell (Y axis) of all cells assessed in the same well of the group of 200 nm (n = 5400 cells), 400 nm (n = 4693 cells), and 900 nm (n = 4336 cells), against the cellular uptake level in the same single cell (X axis), shows a strong positive correlation. The figure was generated by overlapping the FlowJo-generated pseudocolor heat maps showing the cell distribution density with an arbitrary correlation curve plotted. In (a–c), all figures share the same scale bar of 50 μm.
Figure 5
Figure 5
Scale-up production of pDNA/PEI particles with controlled sizes and validation of transfection efficiency for LVV production in bioreactors. (a) Tunable particle size growth kinetics as a function of ionic strength of the particle growth medium (i.e., PBS concentration, 0.3×, 0.4×, 0.45×, and 0.5× of the full ionic strength). (b) Schematic of the scale-up production process enabled by conducting the mixing steps in CIJ mixers at a flow rate of higher than 40 mL/min. (c) Stability of the 400 nm particles at ambient temperature. (d) Stability of the 400 nm particles at different time points during storage at −80 °C. Particle suspension samples were thawed at ambient temperature before testing. (e, f) Effect of pDNA/PEI particle size on the infectious titers (e) and P:I ratios (f) of the LVVs produced in the 15 mL small bioreactors (ambr 15). A 1× dosage level represents 1 μg of pDNA/mL in the suspension cultures. The data power of each size group differed in the experimental design and is fully indicated by the individual data points shown in the figures. (g, h) The infectious titers (g) and P:I ratios (h) of LVVs produced in a 2 L bioreactor using the 400 nm pDNA/PEI particles, at a dosage level of 1 μg of pDNA/mL. n = 1 bioreactor for each condition. In (e–h), the control level represents the optimal results from the standardized in-house procedures to prepare pDNA/PEI particles manually immediately before the transfection experiments.

References

    1. Milone M. C.; O’Doherty U. Clinical use of lentiviral vectors. Leukemia 2018, 32, 1529–1541. 10.1038/s41375-018-0106-0. - DOI - PMC - PubMed
    1. Wang D.; Tai P. W. L.; Gao G. Adeno-associated virus vector as a platform for gene therapy delivery. Nat. Rev. Drug Discovery 2019, 18, 358–378. 10.1038/s41573-019-0012-9. - DOI - PMC - PubMed
    1. Merten O.-W.; Hebben M.; Bovolenta C. Production of lentiviral vectors. Mol. Ther.--Methods Clin. Dev. 2016, 3, 16017.10.1038/mtm.2016.17. - DOI - PMC - PubMed
    1. Pear W. S.; Nolan G. P.; Scott M. L.; Baltimore D. Production of high-titer helper-free retroviruses by transient transfection. Proc. Natl. Acad. Sci. U. S. A. 1993, 90, 8392–8396. 10.1073/pnas.90.18.8392. - DOI - PMC - PubMed
    1. Dalby B.; et al. Advanced transfection with Lipofectamine 2000 reagent: primary neurons, siRNA, and high-throughput applications. Methods 2004, 33, 95–103. 10.1016/j.ymeth.2003.11.023. - DOI - PubMed

Publication types