. 2021 Jul 6;18(1):153.
doi: 10.1186/s12974-021-02199-8.

Chronic colitis exacerbates NLRP3-dependent neuroinflammation and cognitive impairment in middle-aged brain

Affiliations

Chronic colitis exacerbates NLRP3-dependent neuroinflammation and cognitive impairment in middle-aged brain

Xiao-Fei He et al. J Neuroinflammation. .

Erratum in

Abstract

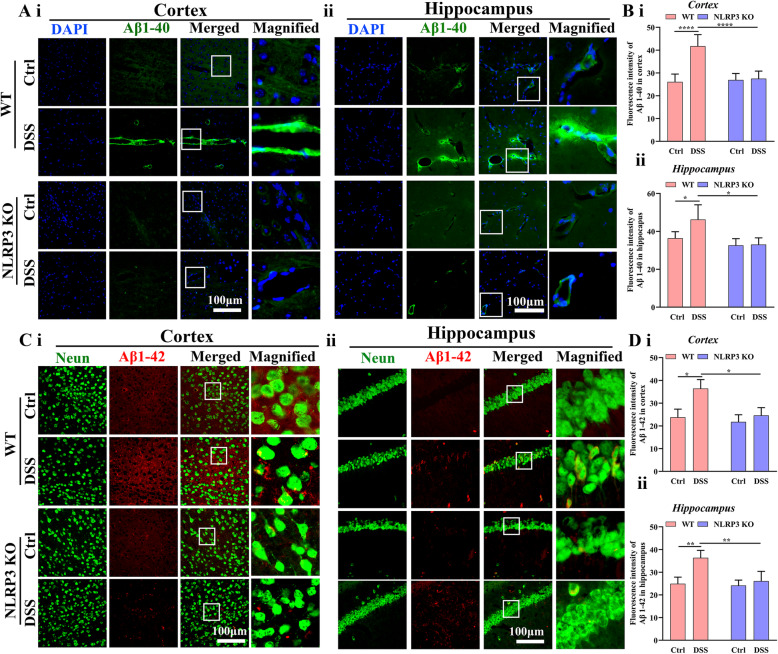
Background: Neuroinflammation is a major driver of age-related brain degeneration and concomitant functional impairment. In patients with Alzheimer's disease, the most common form of age-related dementia, factors that enhance neuroinflammation may exacerbate disease progression, in part by impairing the glymphatic system responsible for clearance of pathogenic beta-amyloid. Inflammatory bowel diseases (IBDs) induce neuroinflammation and exacerbate cognitive impairment in the elderly. The NACHT-LRR and pyrin (PYD) domain-containing protein 3 (NLRP3) inflammasome has been implicated in neuroinflammation. Therefore, we examined if the NLRP3 inflammasome contributes to glymphatic dysfunction and cognitive impairment in an aging mouse model of IBD.

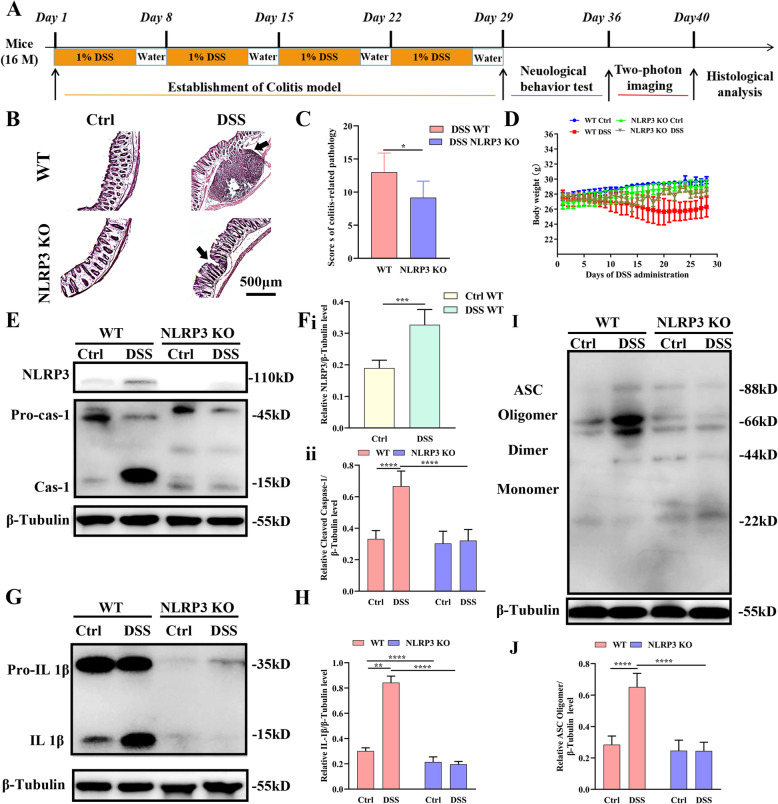
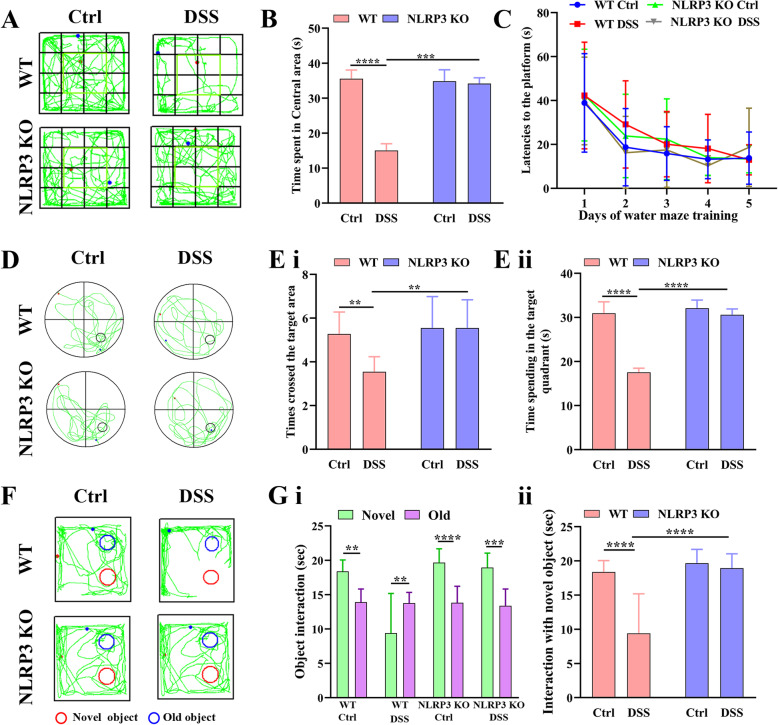
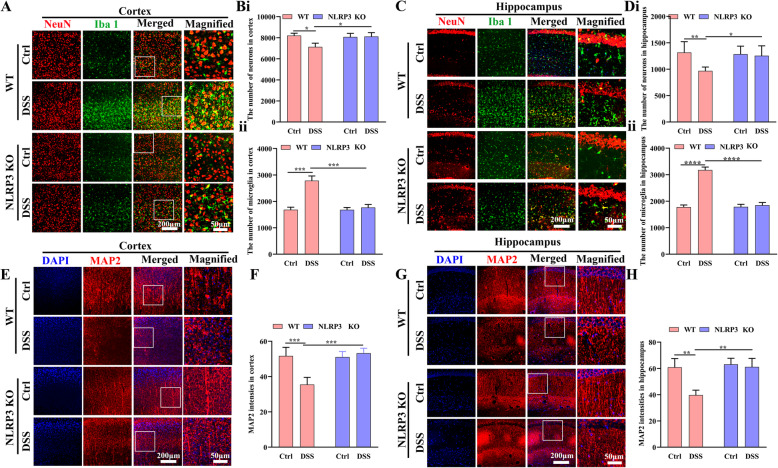
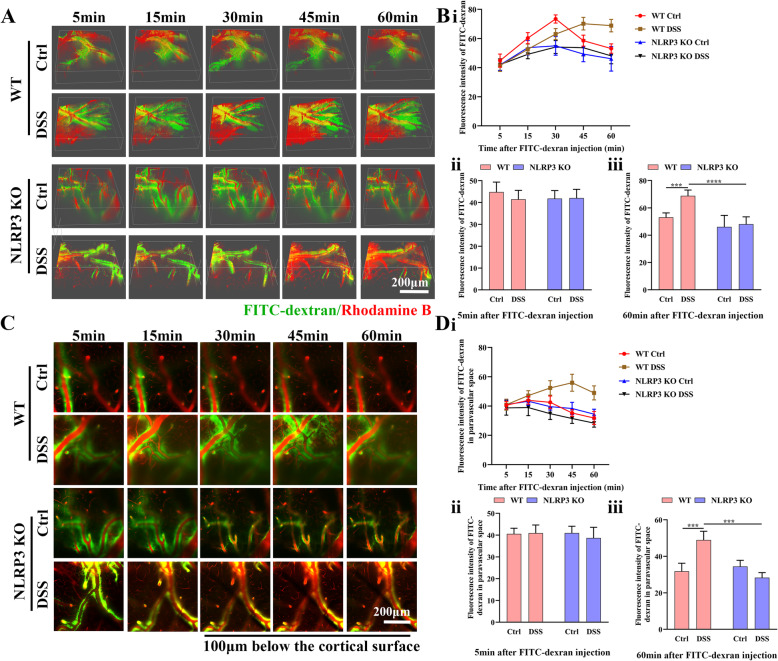
Methods: Sixteen-month-old C57BL/6J and NLRP3 knockout (KO) mice received 1% wt/vol dextran sodium sulfate (DSS) in drinking water to model IBD. Colitis induction was confirmed by histopathology. Exploratory behavior was examined in the open field, associative memory by the novel-object recognition and Morris water maze tests, glymphatic clearance by in vivo two-photon imaging, and neuroinflammation by immunofluorescence and western blotting detection of inflammatory markers.

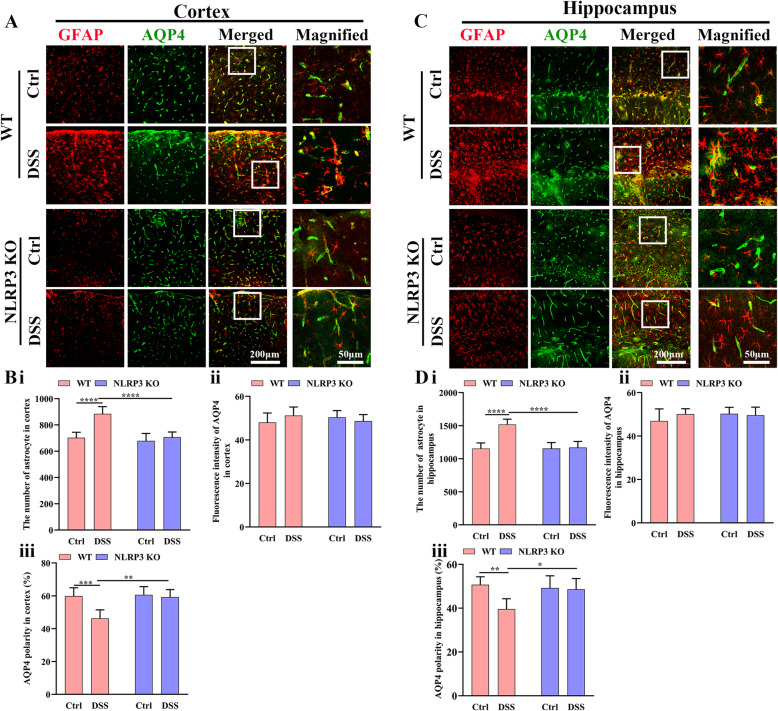
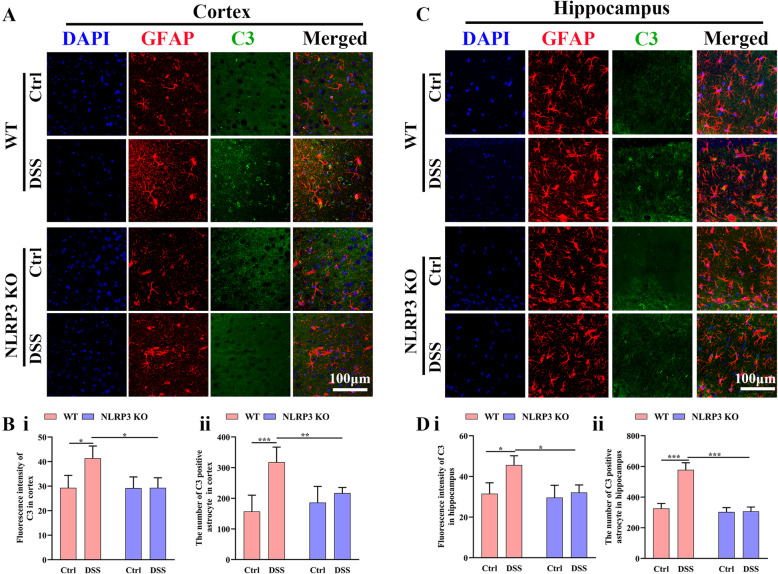
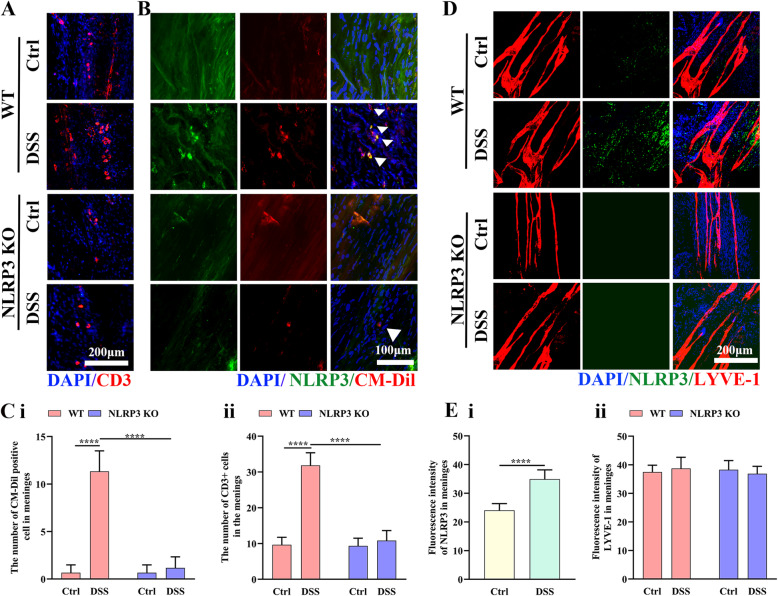
Results: Administration of DSS induced colitis, impaired spatial and recognition memory, activated microglia, and increased A1-like astrocyte numbers. In addition, DSS treatment impaired glymphatic clearance, aggravated amyloid plaque accumulation, and induced neuronal loss in the cortex and hippocampus. These neurodegenerative responses were associated with increased NLRP3 inflammasome expression and accumulation of gut-derived T lymphocytes along meningeal lymphatic vessels. Conversely, NLRP3 depletion protected against cognitive dysfunction, neuroinflammation, and neurological damage induced by DSS.

Conclusions: Colitis can exacerbate age-related neuropathology, while suppression of NLRP3 inflammasome activity may protect against these deleterious effects of colitis.

Keywords: Cognition; Glymphatic clearance; Inflammatory bowel disease; NLRP3 inflammasome; T cell.


Conflict of interest statement

The authors have declared that no competing interests exist.

Figures

Fig. 1
Fig. 1
Addition of dextran sodium sulfate (DSS) to drinking water (1% vol/vol) for 4 weeks induced colitis and increased NLRP3 activation in the brain of WT mice. A Schematic diagram of the experimental design. B Hematoxylin and eosin (H&E) staining showing more severe damage in the colon of DSS-fed WT mice compared to DSS-fed NLRP3 KO mice. C Comparison of colitis-related pathology scores among WT, DSS-fed WT, NLRP3 KO, and DSS-fed NLRP3 KO mice. D Line diagram showing changes in DSS-fed WT mouse body weight during the establishment of colitis. E Chemiluminescence imaging of western blots showing that DSS feeding increased NLRP3 and caspase-1 expression levels in the brains of WT mice compared to untreated control (Ctrl) WT mice but not in NLRP3 KO mouse brain. F Comparisons of NLRP3/β-tubulin (i) and cleaved caspase 1/β-tubulin (ii) ratios among control WT, DSS-fed WT, control NLRP3 KO, and DSS-fed NLRP3 KO mice. G Chemiluminescence images of western blots showing increased brain expression of IL-1β by DSS-fed WT mice compared to Ctrl WT mice but not DSS-fed NLRP3 KO mice. H Comparisons of IL-1β/β-tubulin ratio among treatment groups. I Chemiluminescence image of ASC and β-tubulin immunoexpression by western blot showing that DSS feeding increased ASC oligomer expression in the brains of WT mice but not NLRP3 KO mice. J Comparisons of ASC oligomer/β-tubulin ratio among treatment groups. Each dataset is expressed as mean ± SD. *P ≤ 0.05; **P ≤ 0.01; ***P ≤ 0.001; ****P ≤ 0.0001. n = 6 mice
Fig. 2
Fig. 2
Induction of colitis by addition of DSS to drinking water (1% vol/vol) for 4 weeks altered spontaneous motor behavior and impaired spatial and recognition memory in aged (16-month-old) wild-type (WT) mice but not age-matched NLRP3 KO mice. A Representative movement tracks in the open field test showing less time spent in the central area by DSS-fed WT mice compared to untreated control (Ctrl) WT mice but no difference between DSS-fed and control NLRP3 KO mice. B Comparison of time spent in the central area of the open field by all 4 treatment groups. C Comparison of latency to the platform during the 5 days of Morris water maze training. D Representative swim paths during the probe trial for spatial memory showing that DSS-fed WT mice made fewer crossings over the former platform location and spent less swim time in the target quadrant than control WT mice, indicating spatial memory impairment, while these values did not differ between DSS-fed and control NLRP3 KO mice. E Comparison of times crossing the former target area (i) and time spent in the target quadrant in the probe trial (ii). F Representative movement tracks in the novel object test showing that DSS-fed WT mice spent equal time contacting the familiar and novel objects, while mice in other treatment groups spent more time in contact with the novel object. G Comparison of the time spent in contact with the novel and familiar objects by all 4 treatment groups (i) and comparison of the time spent in contact with the novel object among the four groups (ii). Each dataset is expressed as mean ± SD. *P ≤ 0.05; **P ≤ 0.01; ***P ≤ 0.001; ****P ≤ 0.0001. n = 12 mice
Fig. 3
Fig. 3
NLPR3 knockout protected against neuroinflammation and neurodegeneration from DSS administration. A Immunofluorescence staining of neurons and microglia in the cortex (25× water immersion objective). B Comparison of neuronal (i) and microglia (ii) numbers among control WT, DSS-fed WT, NLRP3 KO, and DSS-fed NLRP3 KO mice (average of four fields/slice, five slices per mouse, 6 mice per group). C Immunofluorescence staining of neurons and microglia in the hippocampus (CA1 area, 25× water immersion objective). D Comparison of neuronal (i) and microglial (ii) number among treatment groups (CA1 area, average of two fields/slice, five slices per mouse, 6 mice per group). E Immunofluorescence staining of MAP2 (25× water immersion objective) in the cortex. F Comparison of MAP2 immunostaining intensity in the cortex among treatment groups (average of four fields/slice, five slices per mouse, 6 mice per group). G Immunofluorescence staining of MAP2 in the hippocampus (CA1 area, 25× water immersion objective). H Comparison of MAP2 staining intensity in the hippocampus among treatment groups (average four fields/slice, five slices per mouse, 6 mice per group). Each dataset is expressed as mean ± SD. *P ≤ 0.05; **P ≤ 0.01; ***P ≤ 0.001; ****P ≤ 0.0001. n = 6 mice
Fig. 4
Fig. 4
Colitis increased Aβ accumulation in WT mice but not NLRP3 KO mice. A Representative images of Aβ1–40 fragment immunoexpression in the cortex (i) and hippocampus (ii) (Left 3 rows: 40× objective; right row: expanded images (3×) of regions in the white boxes). B Comparison of Aβ1–40 expression intensity in the cortex (i) and hippocampus (ii) among control WT, DSS-fed WT, NLRP3 KO, and DSS-fed NLRP3 KO mice. C Representative images of Aβ1–42 fragment immunoexpression and neurons in the cortex (i) and hippocampus (ii) (Left 3 rows: 40× objective; right row: expanded images (3×) of regions in the white boxes). D Comparison of Aβ1–42 expression intensity in the cortex and hippocampus among treatment groups. Each dataset is expressed as mean ± SD. *P ≤ 0.05; **P ≤ 0.01; ***P ≤ 0.001; ****P ≤ 0.0001. n = 6 mice
Fig. 5
Fig. 5
Colitis disrupted the polarity of astrocytic AQP4 distribution in WT but not NLRP3 KO mice. A Representative images of astrocytes and AQP4 expression in the cortex (Left 3 rows: 25× water immersion objective; right row: expanded images (3×) of regions in the white boxes). B Comparison of astrocyte number (i), AQP4 expression intensity (ii), and AQP4 polarity (iii) in the cortex among control WT, DSS-fed WT, NLRP3 KO, and DSS-fed NLRP3 KO mice. C Representative images of astrocytes and AQP4 expression in the hippocampus (Left three rows: 25× water immersion objective; right row: expanded images (3×) of regions in the white boxes). D Comparison of astrocyte number (i), AQP4 expression intensity (ii), and AQP4 polarity (iii) in the hippocampus among treatment groups. Each dataset is expressed as mean ± SD. *P ≤ 0.05; **P ≤ 0.01; ***P ≤ 0.001; ****P ≤ 0.0001. n = 6 mice
Fig. 6
Fig. 6
Colitis promoted transformation to the A1-like astrocyte phenotype in WT mice but not NLRP3 KO mice. A Representative images of C3 immunoexpression and astrocytes in the cortex (63× oil immersion objective). B Comparison of C3 immunofluorescence intensity (i) and C3-positive (A1-like) astrocyte number (ii) in the cortex among control WT, DSS-fed WT, NLRP3 KO, and DSS-fed NLRP3 KO mice. C Representative images of C3 immunoexpression and astrocytes in the hippocampus (63× oil immersion objective). D Comparison of C3 immunofluorescence intensity (i) and C3-positive (A1-like) astrocyte number (ii) in the hippocampus among treatment groups. Each dataset is expressed as mean ± SD. *P ≤ 0.05; **P ≤ 0.01; ***P ≤ 0.001; ****P ≤ 0.0001. n = 6 mice
Fig. 7
Fig. 7
Colitis impaired glymphatic clearance in WT mice but not NLRP3 KO mice. A Representative three-dimensional images at 5, 15, 30, 45, and 60 min after infusion of FITC-dextran into the cisterna magna (25× water immersion objective). B Linear (i) and histogram (ii and iii) analyses of overall FITC-dextran intensity at different time points after infusion among control WT, DSS-fed WT, control NLRP3 KO mice, and DSS-fed NLRP3 KO mice. C Representative two-dimensional images 100 μm below the cortical surface at 5, 15, 30, 45, and 60 min after infusion of FITC-dextran into the cisterna magna (25× water immersion objective). D Linear (i) and histogram (ii and iii) analyses of FITC-dextran intensity in the paravascular space at different time points among control WT, DSS-fed WT, control NLRP3 KO, and DSS-fed NLRP3 KO mice. Each dataset is expressed as mean ± SD. *P ≤ 0.05; **P ≤ 0.01; ***P ≤ 0.001; ****P ≤ 0.0001. n = 6 mice
Fig. 8
Fig. 8
Colitis increased NLRP3 inflammasome expression and accumulation of gut-derived cells in the meninges of WT mice but not NLRP3 KO mice. A Representative images of CD3 immunoexpression in the meninges (25× water immersion objective). B Representative images of CM-Dil-positive (gut-derived) cells and NLRP3 expression in the meninges (25× water immersion objective, magnified 3×). C Comparison of CD3-positive cell number (i) and CM-Dil-positive cell number (ii) in the meninges of WT and NLRP3 KO mice. D Representative images of NLRP3 inflammasome and LYVE-1 immunoexpression in the meninges (25× water immersion objective). E Comparison of NLRP3 inflammasome (i) and LYVE1 intensities (ii) in the meninges of WT and NLRP3 KO mice. Each dataset is expressed as mean ± SD. *P ≤ 0.05; **P ≤ 0.01; ***P ≤ 0.001; ****P ≤ 0.0001. n = 6 mice

References

    1. Heneka MT, Kummer MP, Latz E. Innate immune activation in neurodegenerative disease. Nat Rev Immunol. 2014;14(7):463–477. doi: 10.1038/nri3705. - DOI - PubMed
    1. Sochocka M, Donskow-Łysoniewska K, Diniz BS, et al. The gut microbiome alterations and inflammation-driven pathogenesis of Alzheimer’s disease-a critical review. Mol Neurobiol. 2019;3(56):1841–1851. doi: 10.1007/s12035-018-1188-4. - DOI - PMC - PubMed
    1. Hardy J, Selkoe DJ. The amyloid hypothesis of Alzheimer’s disease: progress and problems on the road to therapeutics. Science. 2002;297(5580):353–356. doi: 10.1126/science.1072994. - DOI - PubMed
    1. Wildsmith KR, Holley M, Savage JC, et al. Evidence for impaired amyloid β clearance in Alzheimer's disease. Alzheimers Res Ther. 2013;5(4):33. doi: 10.1186/alzrt187. - DOI - PMC - PubMed
    1. Iliff JJ, Wang M, Liao Y, et al. A paravascular pathway facilitates CSF flow through the brain parenchyma and the clearance of interstitial solutes, including amyloid β. Sci Transl Med. 2012;4(147):147ra111. doi: 10.1126/scitranslmed.3003748. - DOI - PMC - PubMed

Substances