. 2021 Dec 1;11(12):3090-3105.
doi: 10.1158/2159-8290.CD-20-1741.

Pharmacologic Activation of p53 Triggers Viral Mimicry Response Thereby Abolishing Tumor Immune Evasion and Promoting Antitumor Immunity

Affiliations

Pharmacologic Activation of p53 Triggers Viral Mimicry Response Thereby Abolishing Tumor Immune Evasion and Promoting Antitumor Immunity

Xiaolei Zhou et al. Cancer Discov. .

Abstract

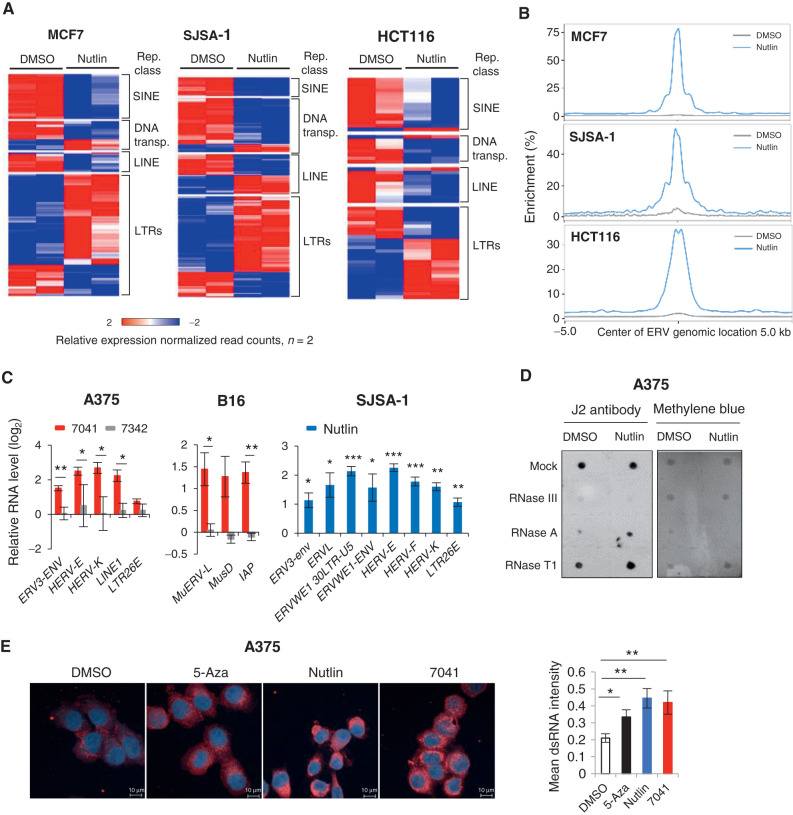
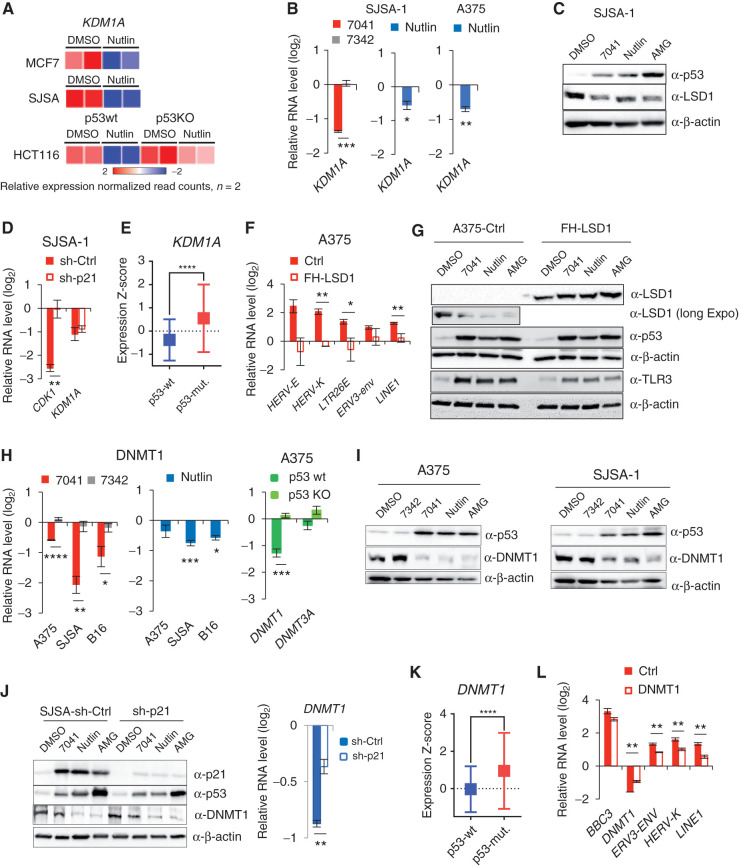
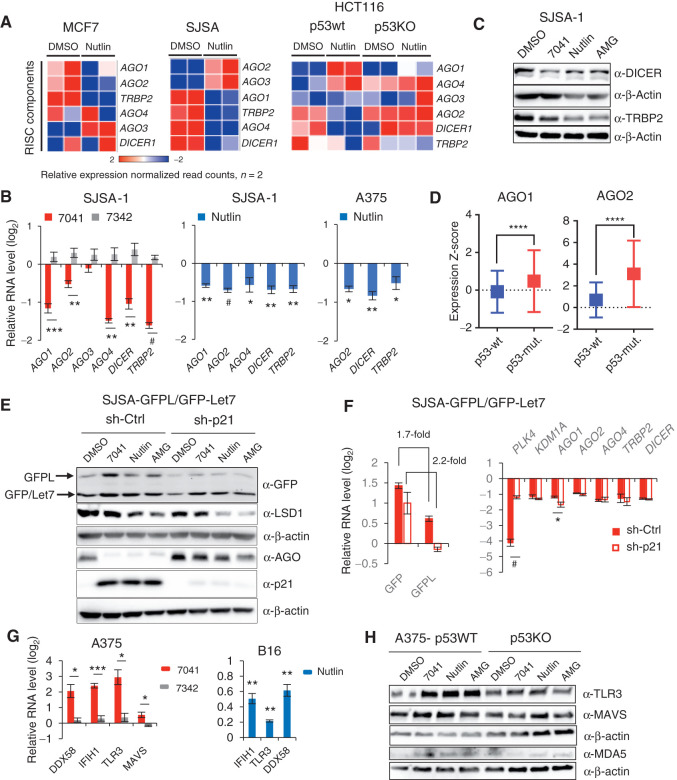
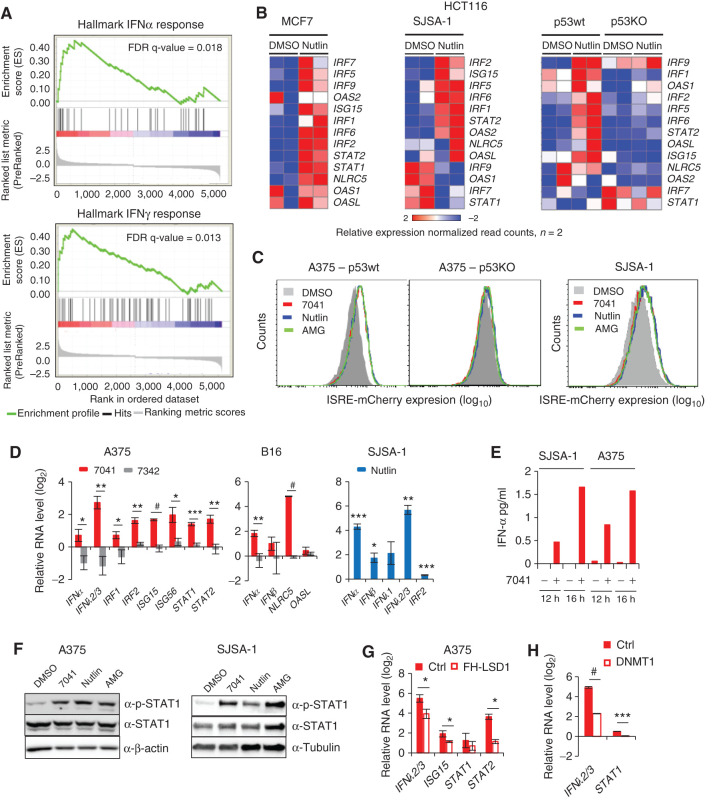
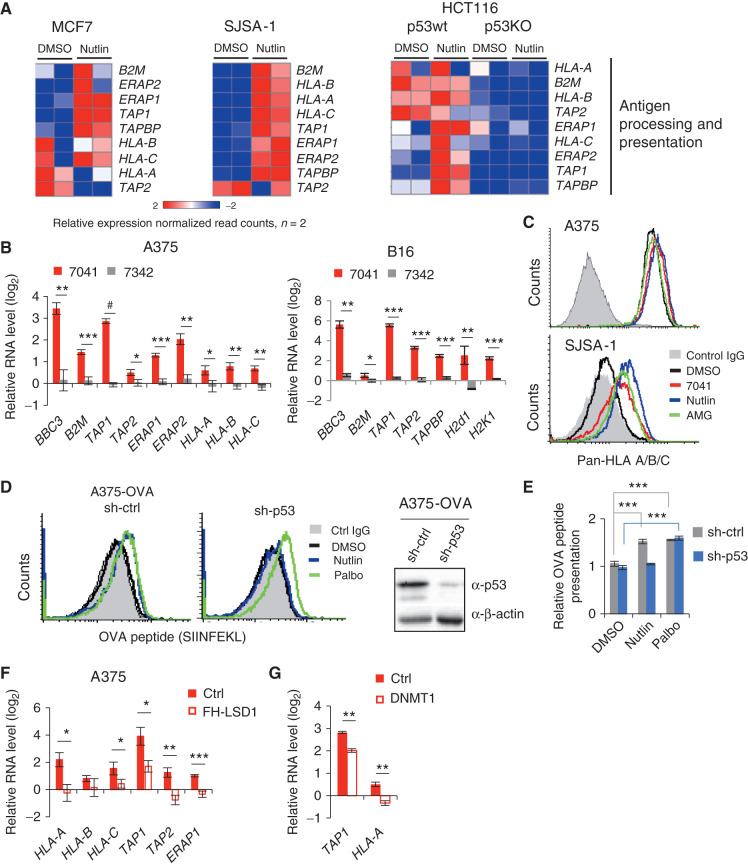
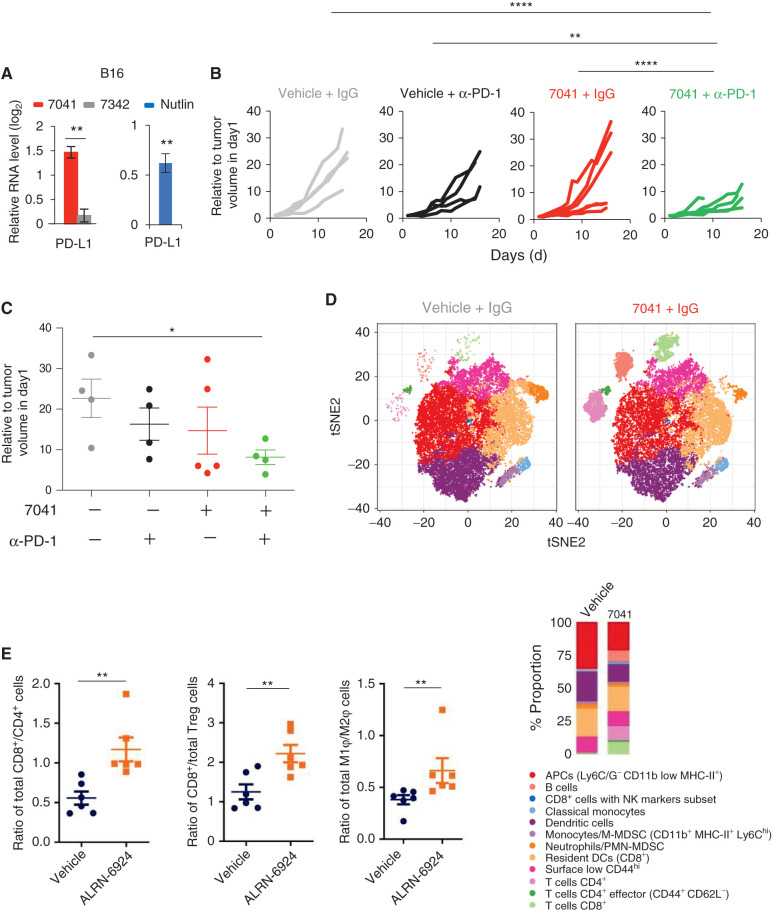
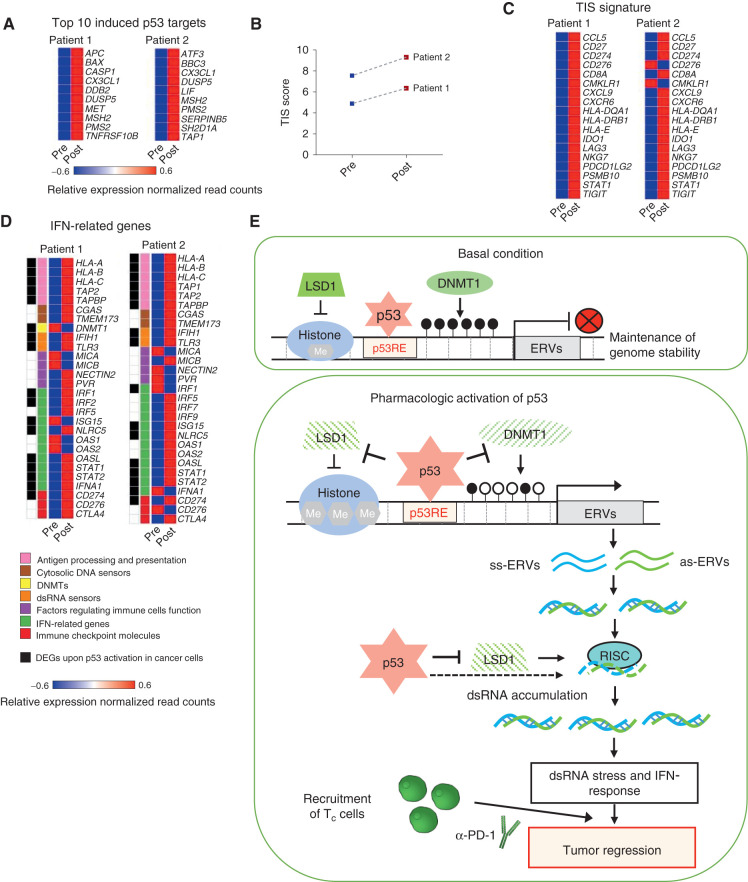
The repression of repetitive elements is an important facet of p53's function as a guardian of the genome. Paradoxically, we found that p53 activated by MDM2 inhibitors induced the expression of endogenous retroviruses (ERV) via increased occupancy on ERV promoters and inhibition of two major ERV repressors, histone demethylase LSD1 and DNA methyltransferase DNMT1. Double-stranded RNA stress caused by ERVs triggered type I/III interferon expression and antigen processing and presentation. Pharmacologic activation of p53 in vivo unleashed the IFN program, promoted T-cell infiltration, and significantly enhanced the efficacy of checkpoint therapy in an allograft tumor model. Furthermore, the MDM2 inhibitor ALRN-6924 induced a viral mimicry pathway and tumor inflammation signature genes in patients with melanoma. Our results identify ERV expression as the central mechanism whereby p53 induction overcomes tumor immune evasion and transforms tumor microenvironment to a favorable phenotype, providing a rationale for the synergy of MDM2 inhibitors and immunotherapy.

Significance: We found that p53 activated by MDM2 inhibitors induced the expression of ERVs, in part via epigenetic factors LSD1 and DNMT1. Induction of IFN response caused by ERV derepression upon p53-targeting therapies provides a possibility to overcome resistance to immune checkpoint blockade and potentially transform "cold" tumors into "hot." This article is highlighted in the In This Issue feature, p. 2945.

Trial registration: ClinicalTrials.gov NCT02264613.


Figures

Figure 1. p53 activation induces ERV expression and dsRNA formation. A, Heat maps show the differential expression of repetitive elements upon p53 activation by nutlin in three different cancer cell lines, as accessed by RNA-seq. B, Increased p53 occupancy on ERVs promoters depicted as average p53 binding score profile mapped onto induced ERVs genome location summits in three different cancer cell lines, as assessed by ChIP-seq. C, ERVs are induced upon p53 activation by 7041 (red bars) and nutlin (blue bars), but not negative control 7342 (gray bars) in A375, B16 and SJSA-1 cells, as assessed by qPCR, n = 3. D and E, dsRNA was induced upon p53 activation by nutlin treatment as detected by dsRNA specific J2 antibody using dot blot (D) or fluorescence microscopy (E). Total RNA was treated with mock, RNase T1, RNase III, or RNase A and blotted on Hybond-N+ membrane. Equal loading visualized by methylene blue staining (D). DMSO was used as a negative control and 500 nmol/L 5-Azacytidine (5-Aza) served as a positive control (E). Student t tests (C, E). Error bars, SD. *, P < 0.05; **, P < 0.01; ***, P < 0.001.
Figure 1.
p53 activation induces ERV expression and dsRNA formation. A, Heat maps show the differential expression of repetitive elements upon p53 activation by nutlin in three different cancer cell lines, as accessed by RNA-seq. B, Increased p53 occupancy on ERVs promoters depicted as average p53 binding score profile mapped onto induced ERVs genome location summits in three different cancer cell lines, as assessed by ChIP-seq. C, ERVs are induced upon p53 activation by 7041 (red bars) and nutlin (blue bars), but not negative control 7342 (gray bars) in A375, B16 and SJSA-1 cells, as assessed by qPCR, n = 3. D and E, dsRNA was induced upon p53 activation by nutlin treatment as detected by dsRNA specific J2 antibody using dot blot (D) or fluorescence microscopy (E). Total RNA was treated with mock, RNase T1, RNase III, or RNase A and blotted on Hybond-N+ membrane. Equal loading visualized by methylene blue staining (D). DMSO was used as a negative control and 500 nmol/L 5-Azacytidine (5-Aza) served as a positive control (E). Student t tests (C, E). Error bars, SD. *, P < 0.05; **, P < 0.01; ***, P < 0.001.
Figure 2. Inhibition of KDM1A (LSD1) and DNMT1 by p53 mediates the induction of ERVs. A, Heat map shows the inhibition of expression of KDM1A gene encoding LSD1 upon treatment with nutlin in three wtp53, but not in p53-null, cell lines, as detected by RNA-seq. B and C, Inhibition of KDM1A upon p53 activation by compounds on mRNA (A) and protein (B) levels, as assessed by qPCR (A) and immunoblotting (B). D, Depletion of p21 by shRNA does not prevent the inhibition of KDM1A expression by p53, as assessed by qPCR in cells transfected by control shRNA and p21 shRNA and treated with 7041. CDK1 is used as positive control of p21-dependent gene. E, Box plots depict higher levels of expression of KDM1A gene in breast tumors harboring mutant p53 compared with wild-type ones. RNA-seq data are from TCGA. Relative expression values are presented as mRNA expression Z-scores (Mann–Whitney test; ****, P ≤ 0.0001). F and G, Overexpression of LSD1 prevented the induction of repetitive elements by p53 as assessed by qPCR (F) in cells transfected with control vector and FH-LSD1 encoding vector (protein level shown in G), upon treatment with 7041. H and I, Inhibition of DNMT1 upon p53 activation by 7041 (red), nutlin (blue), or AMG232 (green) on mRNA (H) and protein (I) levels, as assessed by qPCR (H) and immunoblotting (I). J, Repression of DNMT1 upon p53 activation by MDM2 inhibitors is largely p21-independent, as detected upon p21 depletion by shRNA in SJSA-1 cells by immunoblot (left) and qPCR (right). K, Box plots depict higher levels of expression of DNMT1 in breast tumors harboring mutant p53 compared with wild-type ones. For the analysis RNA-seq data from TCGA was used. Relative expression values are presented as mRNA expression Z-scores, (Mann–Whitney test; ****, P ≤ 0.0001). L, Partial rescue of p53-dependent induction of ERVs in A375 cells overexpressing DNMT1 upon treatment with 7041. B, D, F, H, J, L, Student t tests. Error bars, SD. *, P < 0.05; **, P < 0.01; ***, P < 0.001; #, P < 0,0001, n = 3.
Figure 2.
Inhibition of KDM1A (LSD1) and DNMT1 by p53 mediates the induction of ERVs. A, Heat map shows the inhibition of expression of KDM1A gene encoding LSD1 upon treatment with nutlin in three wtp53, but not in p53-null, cell lines, as detected by RNA-seq. B and C, Inhibition of KDM1A upon p53 activation by compounds on mRNA (A) and protein (B) levels, as assessed by qPCR (A) and immunoblotting (B). D, Depletion of p21 by shRNA does not prevent the inhibition of KDM1A expression by p53, as assessed by qPCR in cells transfected by control shRNA and p21 shRNA and treated with 7041. CDK1 is used as positive control of p21-dependent gene. E, Box plots depict higher levels of expression of KDM1A gene in breast tumors harboring mutant p53 compared with wild-type ones. RNA-seq data are from TCGA. Relative expression values are presented as mRNA expression Z-scores (Mann–Whitney test; ****, P ≤ 0.0001). F and G, Overexpression of LSD1 prevented the induction of repetitive elements by p53 as assessed by qPCR (F) in cells transfected with control vector and FH-LSD1 encoding vector (protein level shown in G), upon treatment with 7041. H and I, Inhibition of DNMT1 upon p53 activation by 7041 (red), nutlin (blue), or AMG232 (green) on mRNA (H) and protein (I) levels, as assessed by qPCR (H) and immunoblotting (I). J, Repression of DNMT1 upon p53 activation by MDM2 inhibitors is largely p21-independent, as detected upon p21 depletion by shRNA in SJSA-1 cells by immunoblot (left) and qPCR (right). K, Box plots depict higher levels of expression of DNMT1 in breast tumors harboring mutant p53 compared with wild-type ones. For the analysis RNA-seq data from TCGA was used. Relative expression values are presented as mRNA expression Z-scores, (Mann–Whitney test; ****, P ≤ 0.0001). L, Partial rescue of p53-dependent induction of ERVs in A375 cells overexpressing DNMT1 upon treatment with 7041. B, D, F, H, J, L, Student t tests. Error bars, SD. *, P < 0.05; **, P < 0.01; ***, P < 0.001; #, P < 0,0001, n = 3.
Figure 3. Inhibition of dsRNA processing genes and RNA-silencing complex (RISC) activity and induction of dsRNA sensors upon p53 activation. A, Heat maps demonstrating downregulation of RISC genes upon p53 activation by nutlin in three cancer cell lines, as assessed by RNA-seq. B, Immunoblot analysis depicts downregulation of DICER and TRBP2 after p53 activation by 7041, nutlin, or AMG-232 in SJSA-1 cells. C, Genes encoding RISC components are repressed after p53 activation by 7041 (red bars) and nutlin (blue bars) in SJSA-1 and A375 cells, as assessed by qPCR (n = 3). D, Box plots depict higher levels of expression of AGO1 and AGO2 genes in breast tumors harboring mutant TP53 compared with wild-type ones. RNA-seq data are from TCGA. Relative expression values are presented as mRNA expression Z-scores (Mann–Whitney test; ****, P ≤ 0.0001). E and F, Inhibition of RISC activity upon p53 activation by nutlin, 7041, and AMG-232 is largely p21-independent. The expression of GFPL and GFP was measured by immunoblot (E) and real-time qPCR (F) in SJSA-1 cells stably expressing dual reporters GFPL/GFP-let-7 and transduced with scrambled shRNA or p21 shRNA. E, Immunoblotting of LSD1 and AGO proteins (detected by pan-AGO antibody) upon p53 activation in the presence or absence of p21. F, p21-independent repression of RISC genes after p53 reactivation by 7041 (red bars), as assessed by qPCR (n = 3). G, dsRNA receptors are induced upon p53 activation by 7041 (red bars) and nutlin (blue bars) in A375 and B16 cells, as assessed by qPCR, n = 3. H, Induction of TLR3, MDA5, and MAVS in a p53-dependent manner in A375 cells after p53 activation by three MDM2 inhibitors, as detected by immunoblot. β-Actin was used as loading control. B, F, G, Student t tests. Error bars, SD. *, P < 0.05; **, P < 0.01; ***, P < 0.001; #, P < 0,0001, n = 3.
Figure 3.
Inhibition of dsRNA processing genes and RNA-silencing complex (RISC) activity and induction of dsRNA sensors upon p53 activation. A, Heat maps demonstrating downregulation of RISC genes upon p53 activation by nutlin in three cancer cell lines, as assessed by RNA-seq. B, Immunoblot analysis depicts downregulation of DICER and TRBP2 after p53 activation by 7041, nutlin, or AMG-232 in SJSA-1 cells. C, Genes encoding RISC components are repressed after p53 activation by 7041 (red bars) and nutlin (blue bars) in SJSA-1 and A375 cells, as assessed by qPCR (n = 3). D, Box plots depict higher levels of expression of AGO1 and AGO2 genes in breast tumors harboring mutant TP53 compared with wild-type ones. RNA-seq data are from TCGA. Relative expression values are presented as mRNA expression Z-scores (Mann–Whitney test; ****, P ≤ 0.0001). E and F, Inhibition of RISC activity upon p53 activation by nutlin, 7041, and AMG-232 is largely p21-independent. The expression of GFPL and GFP was measured by immunoblot (E) and real-time qPCR (F) in SJSA-1 cells stably expressing dual reporters GFPL/GFP-let-7 and transduced with scrambled shRNA or p21 shRNA. E, Immunoblotting of LSD1 and AGO proteins (detected by pan-AGO antibody) upon p53 activation in the presence or absence of p21. F, p21-independent repression of RISC genes after p53 reactivation by 7041 (red bars), as assessed by qPCR (n = 3). G, dsRNA receptors are induced upon p53 activation by 7041 (red bars) and nutlin (blue bars) in A375 and B16 cells, as assessed by qPCR, n = 3. H, Induction of TLR3, MDA5, and MAVS in a p53-dependent manner in A375 cells after p53 activation by three MDM2 inhibitors, as detected by immunoblot. β-Actin was used as loading control. B, F, G, Student t tests. Error bars, SD. *, P < 0.05; **, P < 0.01; ***, P < 0.001; #, P < 0,0001, n = 3.
Figure 4. Induction of IFNs and IFN pathway by p53 is LSD1- and DNMT1-dependent. A, GSEA reveals induction of IFNα and IFNγ response genes upon p53 activation by nutlin. B, Heat maps show the induction of IFN regulatory transcription factors (IRF) and IFN-stimulated genes in MCF7, SJSA-1, and p53WT, but not in p53KO HCT116 cells after nutlin treatment, as assessed by RNA-seq. C, IFN reporter gene (ISRE)-mCherry expressed under control of IFN-sensitive response element is induced after p53 activation by three MDM2 inhibitors in p53-proficient but not in p53-deficient cells. D, IFNs, IRFs, and ISGs are induced upon p53 activation by 7041 (red bars) and nutlin (blue bars) in A375, B16, and SJSA-1 cells, as assessed by qPCR, n = 3. E, Induction of IFNα after p53 activation by stapled peptide 7041 in SJSA-1 and A375 cells, as detected by ELISA. F, Induction of phospho-STAT1 levels after p53 activation by three MDM2 inhibitors in A375 and SJSA-1 cells, as assessed by immunoblotting. G and H, Overexpression of LSD1 (G) or DNMT1 (H) partially rescues the induction of IFN pathway genes by p53, as assayed by qPCR in cells transfected with FH-LSD1 or DNMT1 expressing vectors upon treatment with 7041. D, G, H, Student t tests. Error bars, SD. *, P < 0.05; **, P < 0.01; ***, P < 0.001; #, P < 0.0001.
Figure 4.
Induction of IFNs and IFN pathway by p53 is LSD1- and DNMT1-dependent. A, GSEA reveals induction of IFNα and IFNγ response genes upon p53 activation by nutlin. B, Heat maps show the induction of IFN regulatory transcription factors (IRF) and IFN-stimulated genes in MCF7, SJSA-1, and p53WT, but not in p53KO HCT116 cells after nutlin treatment, as assessed by RNA-seq. C, IFN reporter gene (ISRE)-mCherry expressed under control of IFN-sensitive response element is induced after p53 activation by three MDM2 inhibitors in p53-proficient but not in p53-deficient cells. D, IFNs, IRFs, and ISGs are induced upon p53 activation by 7041 (red bars) and nutlin (blue bars) in A375, B16, and SJSA-1 cells, as assessed by qPCR, n = 3. E, Induction of IFNα after p53 activation by stapled peptide 7041 in SJSA-1 and A375 cells, as detected by ELISA. F, Induction of phospho-STAT1 levels after p53 activation by three MDM2 inhibitors in A375 and SJSA-1 cells, as assessed by immunoblotting. G and H, Overexpression of LSD1 (G) or DNMT1 (H) partially rescues the induction of IFN pathway genes by p53, as assayed by qPCR in cells transfected with FH-LSD1 or DNMT1 expressing vectors upon treatment with 7041. D, G, H, Student t tests. Error bars, SD. *, P < 0.05; **, P < 0.01; ***, P < 0.001; #, P < 0.0001.
Figure 5. Activation of p53 in cancer cells enhances antigen processing and presentation. A, Heat maps show the induction of APP genes in MCF7, SJSA-1, and HCT116 cells, as assessed by RNA-seq. Absence of induction of APP genes in HCT116 p53KO cells confirms p53 dependency. B, qPCR shows the induction of APP genes in melanoma cells A375 (left) and B16 (right) upon treatment with p53-activating stapled peptide 7041 (red bars), but not control peptide 7342 (gray bars). Results shown are the mean ± SD from three independent experiments performed in triplicate (comparison between peptides vs. DMSO treatment). C, Flow cytometry shows an increased cell surface expression of HLA-A/B/C upon treatment with three MDM2 inhibitors in A375 (top) and SJSA-1 cells (bottom). Shown is propidium iodide–negative (PI−) population. D and E, p53-dependent enhanced presentation of heterologous OVA peptide-SIINFEKL on the cell surface of A375-OVA cells upon nutlin treatment, as assessed by flow cytometry (n = 3). DMSO was used as a negative control, palbociclib (Palbo) served as a positive control. F, Overexpression of FH-LSD1 prevented the induction of APP genes upon p53 activation, as assessed by qPCR in A375 cells transfected with FH-LSD1 expression vector and treated with 7041 versus control vector-transfected cells. G, Partial rescue of APP genes induction upon by ectopic expression of DNMT1, assessed as in F. B, E, F, G, Student t tests. Error bars, SD. *, P < 0.05; **, P < 0.01; ***, P < 0.001; #, P < 0.0001.
Figure 5.
Activation of p53 in cancer cells enhances antigen processing and presentation. A, Heat maps show the induction of APP genes in MCF7, SJSA-1, and HCT116 cells, as assessed by RNA-seq. Absence of induction of APP genes in HCT116 p53KO cells confirms p53 dependency. B, qPCR shows the induction of APP genes in melanoma cells A375 (left) and B16 (right) upon treatment with p53-activating stapled peptide 7041 (red bars), but not control peptide 7342 (gray bars). Results shown are the mean ± SD from three independent experiments performed in triplicate (comparison between peptides vs. DMSO treatment). C, Flow cytometry shows an increased cell surface expression of HLA-A/B/C upon treatment with three MDM2 inhibitors in A375 (top) and SJSA-1 cells (bottom). Shown is propidium iodide–negative (PI) population. D and E, p53-dependent enhanced presentation of heterologous OVA peptide-SIINFEKL on the cell surface of A375-OVA cells upon nutlin treatment, as assessed by flow cytometry (n = 3). DMSO was used as a negative control, palbociclib (Palbo) served as a positive control. F, Overexpression of FH-LSD1 prevented the induction of APP genes upon p53 activation, as assessed by qPCR in A375 cells transfected with FH-LSD1 expression vector and treated with 7041 versus control vector-transfected cells. G, Partial rescue of APP genes induction upon by ectopic expression of DNMT1, assessed as in F. B, E, F, G, Student t tests. Error bars, SD. *, P < 0.05; **, P < 0.01; ***, P < 0.001; #, P < 0.0001.
Figure 6. Pharmacologic reactivation of p53 enhanced T-cell infiltration and overcame tumor resistance to PD-1 blockade in vivo. A, Upregulation of PD-L1 expression upon p53 activation by 7041 or nutlin in B16 melanoma, as assayed by qPCR (n = 3). B and C, Tumor growth (B) and endpoint tumor volume (C) of B16 tumors grown in immunocompetent mice treated with vehicle, 7041, anti–PD-1 antibody, or 7041/anti–PD-1 combination. D, tSNE plot depicting 12 identified immune cell populations (panel below). Each plot represents the merged population of two different tumors per treatment. Bar plots are showing the differential proportion of each cell population in tumors treated with vehicle or 7041. E, Increased infiltration of cytotoxic CD8+ T cells and tumor-suppressive M1 macrophages in vivo in colon carcinoma model Colon26 upon treatment with stapled peptide MDM2 inhibitor ALRN-6924, as assessed by flow cytometry. Data are presented as a ratio representing total cell counts where Student t tests (A, E) and one-way ANOVA with Bonferroni correction (C). Error bars, SD. *, P < 0.05; **, P < 0.01.
Figure 6.
Pharmacologic reactivation of p53 enhanced T-cell infiltration and overcame tumor resistance to PD-1 blockade in vivo. A, Upregulation of PD-L1 expression upon p53 activation by 7041 or nutlin in B16 melanoma, as assayed by qPCR (n = 3). B and C, Tumor growth (B) and endpoint tumor volume (C) of B16 tumors grown in immunocompetent mice treated with vehicle, 7041, anti–PD-1 antibody, or 7041/anti–PD-1 combination. D, tSNE plot depicting 12 identified immune cell populations (panel below). Each plot represents the merged population of two different tumors per treatment. Bar plots are showing the differential proportion of each cell population in tumors treated with vehicle or 7041. E, Increased infiltration of cytotoxic CD8+ T cells and tumor-suppressive M1 macrophages in vivo in colon carcinoma model Colon26 upon treatment with stapled peptide MDM2 inhibitor ALRN-6924, as assessed by flow cytometry. Data are presented as a ratio representing total cell counts where Student t tests (A, E) and one-way ANOVA with Bonferroni correction (C). Error bars, SD. *, P < 0.05; **, P < 0.01.
Figure 7. Induction of IFN pathway and immune-related genes in patients with melanoma enrolled in ALRN-6924 clinical trial. A, Heat map showing top 10 induced p53 target genes in tumor biopsies of patients with melanoma enrolled in ALRN-6924 clinical trial, as assessed by NanoString. B, Dot plot depicting the induction of Tumor Inflammation Score (TIS) in patient tumors upon treatment with ALRN-6924. C, Heat map showing the induction of expression of the 18 TIS genes in tumor biopsies from patients pre- and post-ALRN-6924 treatment. D, Heat map representing the differentially expressed IFN- and immune-related genes in patient tumors pre- and posttreatment with ALRN-6924. The colored bars indicate functional categories, as shown in the panel below. Genes labeled in black correspond to the set of IFN pathway genes which were induced in a p53-dependent manner upon treatment of cancer cell lines with different MDM2 inhibitors. Only those genes are shown which are included in PanCancer IO360 Gene Expression Panel. E, Model: top, at basal condition p53 binds to its response elements (RE) in ERVs and cooperates with DNMT1 and LSD1 to repress them. Bottom, upon pharmacologic p53 activation, p53 inhibits the expression of DNMT1 and LSD1, abrogating epigenetic silencing of ERVs. Furthermore, p53 binding to ERVs is increased along with p53 accumulation in cells. This is probably followed by the recruitment of transcriptional activators, replacing DNMT1 and LSD1. Together, these lead to the activation of expression of ERVs and generation of dsRNA. Active p53 downregulates RISC genes, contributing to dsRNA accumulation and dsRNA stress, induction of dsRNA sensors, and unleashing of viral mimicry response, thus potentiating anticancer immune response and synergy with immune checkpoint therapy.
Figure 7.
Induction of IFN pathway and immune-related genes in patients with melanoma enrolled in ALRN-6924 clinical trial. A, Heat map showing top 10 induced p53 target genes in tumor biopsies of patients with melanoma enrolled in ALRN-6924 clinical trial, as assessed by NanoString. B, Dot plot depicting the induction of Tumor Inflammation Score (TIS) in patient tumors upon treatment with ALRN-6924. C, Heat map showing the induction of expression of the 18 TIS genes in tumor biopsies from patients pre- and post-ALRN-6924 treatment. D, Heat map representing the differentially expressed IFN- and immune-related genes in patient tumors pre- and posttreatment with ALRN-6924. The colored bars indicate functional categories, as shown in the panel below. Genes labeled in black correspond to the set of IFN pathway genes which were induced in a p53-dependent manner upon treatment of cancer cell lines with different MDM2 inhibitors. Only those genes are shown which are included in PanCancer IO360 Gene Expression Panel. E, Model: top, at basal condition p53 binds to its response elements (RE) in ERVs and cooperates with DNMT1 and LSD1 to repress them. Bottom, upon pharmacologic p53 activation, p53 inhibits the expression of DNMT1 and LSD1, abrogating epigenetic silencing of ERVs. Furthermore, p53 binding to ERVs is increased along with p53 accumulation in cells. This is probably followed by the recruitment of transcriptional activators, replacing DNMT1 and LSD1. Together, these lead to the activation of expression of ERVs and generation of dsRNA. Active p53 downregulates RISC genes, contributing to dsRNA accumulation and dsRNA stress, induction of dsRNA sensors, and unleashing of viral mimicry response, thus potentiating anticancer immune response and synergy with immune checkpoint therapy.

Comment in

  • doi: 10.1158/2159-8290.CD-11-12-ITI

References

    1. Martins CP, Brown-Swigart L, Evan GI. Modeling the therapeutic efficacy of p53 restoration in tumors. Cell 2006;127:1323–34. - PubMed
    1. Ventura A, Kirsch DG, McLaughlin ME, Tuveson DA, Grimm J, Lintault Let al. . Restoration of p53 function leads to tumour regression in vivo. Nature 2007;445:661–5. - PubMed
    1. Xue W, Zender L, Miething C, Dickins RA, Hernando E, Krizhanovsky Vet al. . Senescence and tumour clearance is triggered by p53 restoration in murine liver carcinomas. Nature 2007;445:656–60. - PMC - PubMed
    1. Sanz G, Singh M, Peuget S, Selivanova G. Inhibition of p53 inhibitors: progress, challenges and perspectives. J Mol Cell Biol 2019;11:586–99. - PMC - PubMed
    1. Chang YS, Graves B, Guerlavais V, Tovar C, Packman K, To KHet al. . Stapled alpha-helical peptide drug development: a potent dual inhibitor of MDM2 and MDMX for p53-dependent cancer therapy. Proc Natl Acad Sci U S A 2013;110:E3445–54. - PMC - PubMed

Publication types

Substances

Associated data