. 2021 Jul 6;14(690):eabe5040.
doi: 10.1126/scisignal.abe5040.

Long-chain polyphosphates impair SARS-CoV-2 infection and replication

Affiliations

Long-chain polyphosphates impair SARS-CoV-2 infection and replication

Veronica Ferrucci et al. Sci Signal. .

Abstract

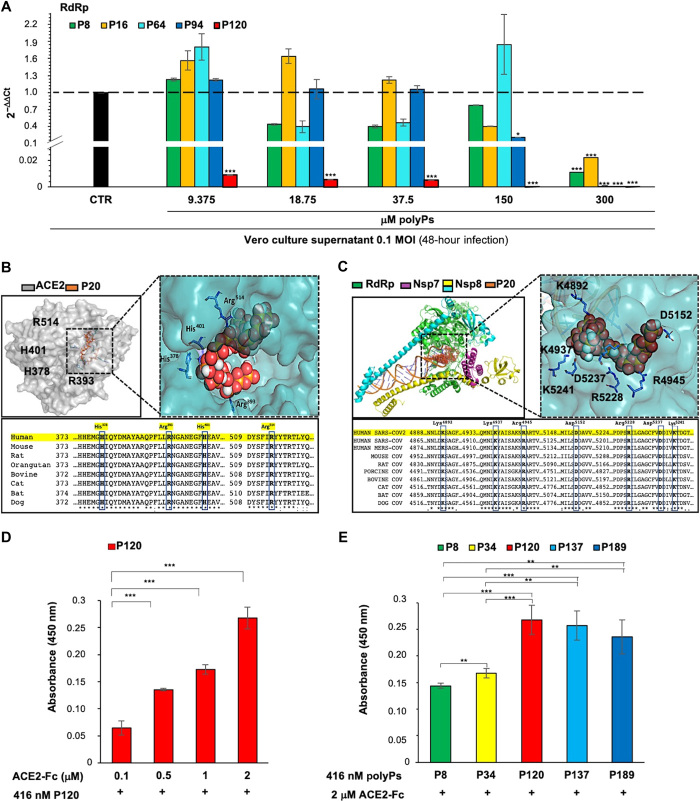
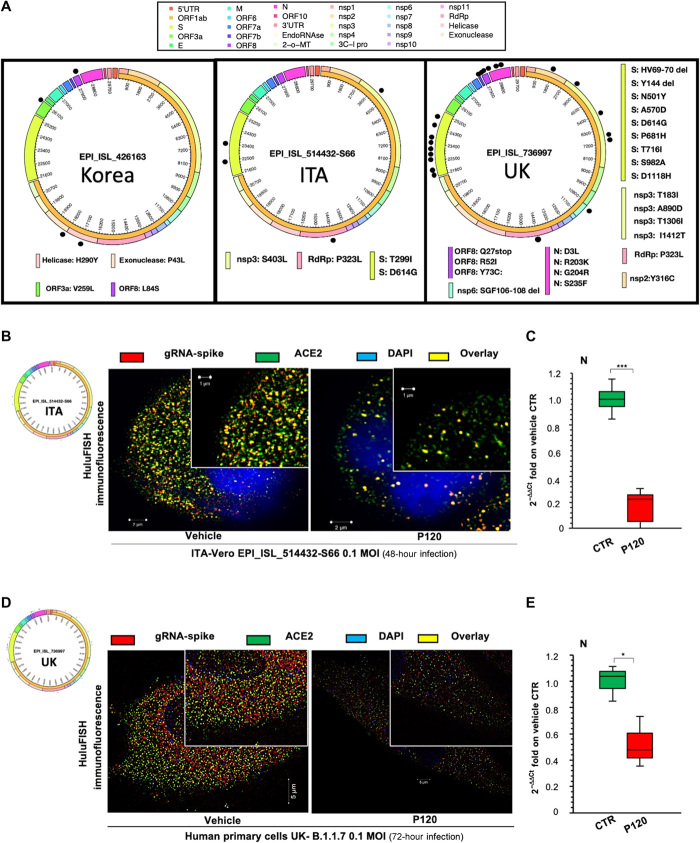
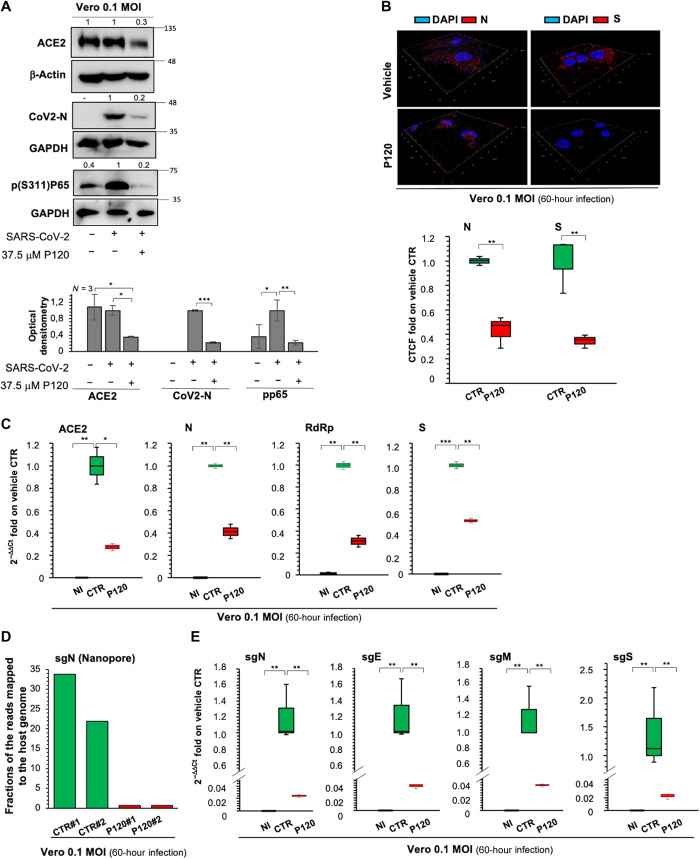
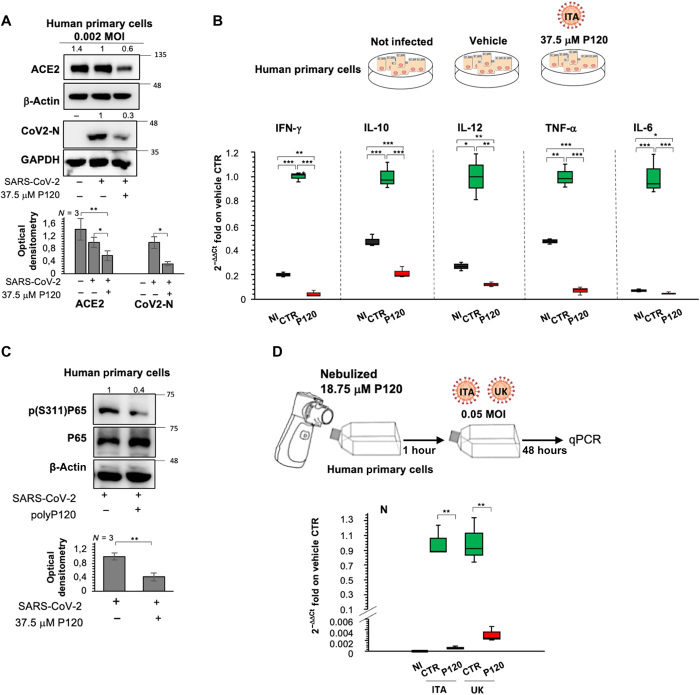
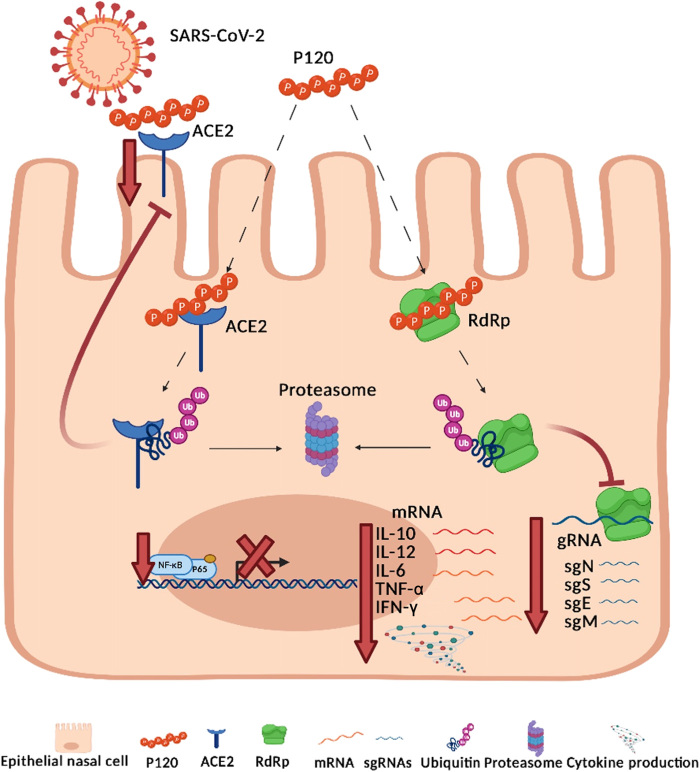
Inorganic polyphosphates (polyPs) are linear polymers composed of repeated phosphate (PO4 3-) units linked together by multiple high-energy phosphoanhydride bonds. In addition to being a source of energy, polyPs have cytoprotective and antiviral activities. Here, we investigated the antiviral activities of long-chain polyPs against severe acute respiratory syndrome coronavirus 2 (SARS-CoV-2) infection. In molecular docking analyses, polyPs interacted with several conserved amino acid residues in angiotensin-converting enzyme 2 (ACE2), the host receptor that facilitates virus entry, and in viral RNA-dependent RNA polymerase (RdRp). ELISA and limited proteolysis assays using nano- LC-MS/MS mapped polyP120 binding to ACE2, and site-directed mutagenesis confirmed interactions between ACE2 and SARS-CoV-2 RdRp and identified the specific amino acid residues involved. PolyP120 enhanced the proteasomal degradation of both ACE2 and RdRp, thus impairing replication of the British B.1.1.7 SARS-CoV-2 variant. We thus tested polyPs for functional interactions with the virus in SARS-CoV-2-infected Vero E6 and Caco2 cells and in primary human nasal epithelial cells. Delivery of a nebulized form of polyP120 reduced the amounts of viral positive-sense genomic and subgenomic RNAs, of RNA transcripts encoding proinflammatory cytokines, and of viral structural proteins, thereby presenting SARS-CoV-2 infection in cells in vitro.


Figures

Fig. 1
Fig. 1. The antiviral effects of polyPs are due to their binding to ACE2 and RdRp.
(A) Viral RdRp expression was measured by RT-PCR analysis of viral RNA extracted from the culture medium of Vero E6 cells (4 × 10⁵) that were infected with SARS-CoV-2 for 24 hours and then treated with increasing concentrations of polyPs (9.375, 18.75, 37.5, 150, and 300 μM) of different chain lengths (P8, polyP8; P16, polyP16; P64, polyP64; P94, polyP94; P120, polyP120) for an additional 24 hours. The qRT-PCR analysis was performed with primer-probe sets that targeted the RdRp region of SARS-CoV-2 virus. Note that ΔCt was calculated as the difference between the Ct for RdRp expression in SARS-CoV-2–infected cells treated with polyPs and the Ct for RdRp expression in SARS-CoV-2–infected cells without polyPs. The quantity of viral RNA (ct) was also expressed as PFU equivalents (fig. S1B). Data are means ± SD. *P < 0.05 and ***P < 0.001 [by unpaired two-tailed Student’s t test; RdRp versus untreated Vero E6 cells (black column); n = 3 independent experiments per group]. (B) Top: Molecular docking of polyP20 on the SARS-CoV-2 ACE2 domain (PDB structure: 6M0J, chain A). Left: ACE2. The transparent molecular surface is colored according to electrostatic potential, as −10 kT/e (red) to +10 kT/e (blue). The orange sticks represent polyP20. Right: Magnified view of the ACE2 receptor as a cyan transparent surface to indicate the binding interface. Bottom: Alignment analysis of ACE2 protein regions with potential binding sites for polyP20. The amino acid residues mainly responsible for the interactions between ACE2 and polyP20 are shown as blue boxes (His378, Arg393, His401, and Arg514). (C) Top: Molecular docking of polyP20 (P20) on SARS-CoV-2 RdRp (PDB structure: 6 M71). Left: RdRp. The molecular surface is colored according to electrostatic potential, from −10 kT/e (red) to +10kT/e (blue). The red balls represent polyP20. Right: Magnified view of RdRp as a cyan transparent surface to indicate the binding interface. Bottom: Alignment analysis of the RdRp protein (nsp12) region that contains the potential binding sites for polyP20. The amino acid residues mainly responsible for interactions between RdRp and polyP20 are shown in blue boxes (Lys4892, Lys4937, Arg4945, Asp5152, Arg5228, Asp5237, and Arg5241). (D) ELISAs of increasing concentrations (0.1 to 2.0 μM) of human ACE2-Fc chimera protein in 96-well plates coated with 416 nM polyP120. Absorbance at 450 nm was measured after a 1-hour incubation at 25°C. Comparison among the different ACE2-Fc concentrations compared with the lowest concentration (0.1 μM) for binding to polyP120 was evaluated. Data are means ± SD. ***P < 0.001 by unpaired two-tailed Student’s t test; n = 3 independent experiments per group. (E) ELISAs of 2 μM human ACE2-Fc chimera protein and 416 nM polyPs of the indicated chain lengths coated on 96-well plates. Absorbance at 450 nm was measured after a 1-hour incubation at 25°C. Comparison among the different polyPs for the binding to ACE2-Fc was evaluated comparing them to polyP8 and polyP34 (P34) (e.g., polyP120 versus polyP8: P = 9.4 × 10⁻⁵; unpaired two-tailed t test, adjusted with the Bonferroni method). Data are means ± SD. **P < 0.01 and ***P < 0.001 by unpaired two-tailed Student’s t test; n = 3 independent experiments per group.
Fig. 2
Fig. 2. PolyP120 stimulates the proteasome-mediated degradation of ACE2 and RdRp.
(A and B) Real-time cell proliferation analysis for the cell index (i.e., the cell sensor impedance was expressed every 2 min as a unit called cell index). Vero E6 cells (3 × 10⁴) (A) and primary human epithelial cells from nasal brushing (3 × 10⁴) (B) were plated and treated with the indicated concentrations of polyP120 (4.16 to 112 μM); vehicle-treated cells were the negative control. Impedance was measured every 2 min over 24 hours. The IC50 values were calculated through nonlinear regression analysis performed with GraphPad Prism 9 {[inhibitor] versus response (three parameters)}. Data are means ± SD of three independent experiments. 5′UTR, 5′ untranslated region. (C to H) Representative Western blotting analysis of primary human epithelial cells (C), Vero E6 cells (D), and HEK293T cells (E to H) that were treated as indicated. All experiments were performed in triplicate, and Western blotting was performed with antibodies against the indicated proteins. Double-distilled water was used as vehicle control for all conditions. β-Actin or α-tubulin was used as a loading control. Densitometry analyses were performed with blots from three independent experiments. Data are means ± SD. *P < 0.05, **P < 0.01, and ***P < 0.001 by unpaired two-tailed Student’s t test; n = 3 independent experiments per group. N.S., not significant. The treatments were as follows. (C) Cells were treated without or with polyP120 at 4.16, 12.5, 37.5, and 112 μM, for 24 hours. (D) Cells treated without or with 37.5 μM polyPs (polyP8, polyP34, polyP94, or polyP120), for 24 hours. Negative controls in (C) and (D) were vehicle-treated cells. (E) Cells were treated without and with 10 μM MG-132 (proteasome inhibitor) alone or in combination with 37.5 μM polyP120 for 12, 24, and 48 hours. Negative controls: untreated cells and MG-132–treated cells. (F) Cells were treated without and with the protein synthesis inhibitor cycloheximide (CHX; 50 μg/ml), alone or in combination with 37.5 μM polyP120, for 12, 24, and 48 hours. Negative controls: untreated cells and CHX-treated cells. (G) Cells were transiently transfected with plasmids expressing WT ACE2 or mutant ACE2 protein (MUT: H378S, R393Q, H401S, and R514Q). Forty-eight hours later, the cells were then treated without or with 37.5 μM polyP120 for a further 24 hours. Negative controls: cells transfected with empty vector (EV) and vehicle-treated cells. For a longer exposure for ACE2 band density acquisition and the densitometric values for the EV condition, see fig. S2G. (H) Cells were transiently transfected with plasmids expressing WT RdRp or mutant RdRp protein (MUT: K4892S, K4937S, R4945Q, R5228Q, and K5241S). Forty-eight hours later, the cells were treated with 10 μM MG-132 alone or in combination with 37.5 μM polyP120 for a further 24 hours. Negative controls: cells transfected with EV, untreated cells, and MG-132–treated cells.
Fig. 3
Fig. 3. polyP120 exerts antiviral action against SARS-CoV-2 variants belonging to 20A and 20I/501Y.V1 (B.1.1.7) clades.
(A) Circos plot showing missense variations among 19A clade (EPI_ISL_426163), 20A clade (EPI_ISL_514432-S66), and 20I/501Y.V1 (B.1.1.7) clade (EPI_ISL_736997) SARS-CoV-2 variants used in this work. Each black dot represents a missense mutation in the viral genomes. (B to D) HuluFISH analyses. (B and D) HuluFISH analysis with a pan–SARS-CoV-2 probe against the S gene (red) coupled to immunofluorescence (IF) staining with an antibody against the ACE2 protein (green). (B) Vero E6 cells were infected with Italian SARS-CoV-2 particles (MOI, 0.1) for 24 hours and then were treated with 37.5 μM polyP120 for additional 24 hours. (D) Primary human epithelial cells from nasal brushing were pretreated with 37.5 μM polyP120 for 1 hour and then infected with Italian SARS-CoV-2 particles (MOI, 0.1) for 72 hours. SARS-CoV-2–infected cells treated with vehicle (CTR) were used as negative controls in (B) and (D). The SIM image was acquired with Elyra 7 and processed with Zeiss ZEN software (blue edition). Magnification, ×63. (C and E) Quantification of mRNA abundance relative to that in the CTR (2−ΔΔCt) of genomic viral RNAs (N gene) from RT-PCR analysis of total RNA extracted from Vero E6 cells infected with Italian SARS-CoV-2 (EPI_ISL_514432-S66) (C) or primary human epithelial cells from nasal brushing infected with B.1.1.7 SARS-CoV-2 (UK) (EPI_ISL_736997) (E). SARS-CoV-2–infected cells treated with vehicle (CTR) were used as controls. Data are means ± SD. *P < 0.05 and ***P < 0.001 by unpaired two-tailed Student’s t test, adjusted with the Bonferroni method; n = 3 independent experiments per group. DAPI, 4′,6-diamidino-2-phenylindole.
Fig. 4
Fig. 4. Antiviral action of polyP120 in Vero E6 cells.
(A) Top: Representative Western blotting analysis (with antibodies against the indicated proteins) of Vero E6 cells (8 × 10⁵) infected with Italian SARS-CoV-2 viral particles (MOI, 0.1) for 24 hours and then treated with 37.5 μM polyP120 or vehicle for a further 36 hours. All experiments were performed in triplicate. Bottom: Densitometry analysis of the indicated band intensities on blots from three independent experiments. Data are means ± SD. *P < 0.05, **P < 0.01, and ***P < 0.001 by unpaired two-tailed Student’s t test; n = 3 independent experiments per group. Negative controls: noninfected (NI) cells and SARS-CoV-2–infected cells treated with vehicle (CTR). GAPDH, glyceraldehyde-3-phosphate dehydrogenase. (B) Representative three-dimensional IF reconstruction (top) and its quantification (bottom) with antibodies against the SARS-CoV-2 N and S proteins for cells treated as described for (A). Magnification, ×63. Fluorescence intensity was measured in each cell and compared with that in the vehicle control. More than 50 cells were counted. Quantification is presented as the corrected total cell fluorescence (CTCF) intensity. (C) Quantification of mRNA abundance relative to that in CTR cells (2−ΔΔCt) for ACE2 and genomic viral RNAs (N, RdRp, and S) from RT-PCR analysis with SYBR Green of total RNA extracted from cells treated as described for (A). Noninfected and SARS-CoV-2–infected cells treated with vehicle (CTR) were used as controls. Data are means ± SD. *P < 0.05, **P < 0.01, and ***P < 0.001 by unpaired two-tailed Student’s t test, adjusted with the Bonferroni method; n = 3 independent experiments per group. (D) Quantification of direct RNA sequencing reads (through Nanopore technology) assigned to the sgN transcript expressed as fractions of reads mapped to the host genome. Two independent experiments are shown (#1 and #2; SRA data accession: PRJNA688696). (E) Quantification of mRNA abundance relative to that in CTR cells (2−ΔΔCt) of subgenomic (sg) viral RNAs from the RT-PCR analysis with SYBR Green of cells treated as described for (A). Noninfected cells and SARS-CoV-2–infected cells treated with vehicle (CTR) were used as controls. Data are means ± SD. **P < 0.01 by unpaired two-tailed Student’s t test, adjusted with the Bonferroni method; n = 3 independent experiments per group.
Fig. 5
Fig. 5. Antiviral actions of polyP120 in human cell lines result in decreased cytokine production.
(A) Top: Representative Western blotting analysis (using antibodies against the indicated proteins) of human epithelial cells (4.25 × 10³) infected with Italian SARS-CoV-2 (MOI, 0.002) for 24 hours and then treated with 37.5 μM polyP120 or vehicle for a further 36 hours. All experiments were performed in triplicate. Bottom: Densitometry analysis of the indicated band intensities on blots from three independent experiments. Data are means ± SD. *P < 0.05 and **P < 0.01 by unpaired two-tailed Student’s t test; n = 3 independent experiments per group. Negative controls: noninfected cells and SARS-CoV-2–infected cells treated with vehicle (CTR). (B) Quantification of mRNA abundance relative to that in CTR cells (2−ΔΔCt) for IFN-γ, IL-10, IL-12, tumor necrosis factor–α (TNF-α), and IL-6 from RT-PCR analysis with SYBR Green of RNA extracted from cells treated as described for (A). Noninfected cells and SARS-CoV-2–infected cells treated with vehicle (CTR) were used as controls. Data are means ± SD. *P < 0.05, **P < 0.01, and ***P < 0.001 by unpaired two-tailed Student’s t test, adjusted with the Bonferroni method; n = 3 independent experiments per group. (C) Top: Representative Western blotting of the primary human epithelial cells from nasal brushing treated as described for (A) with antibodies against the indicated proteins. All experiments were performed in triplicate. Bottom: Densitometry analysis of the indicated band intensities on blots from three independent experiments. Data are means ± SD. **P < 0.01 by unpaired two-tailed Student’s t test; n = 3 independent experiments per group. (D) Top: Experimental plan. Primary human epithelial cells from nasal brushing were plated in flasks and treated with nebulized 18.75 μM polyP120. After 1 hour, the cells were infected with 20A (EPI_ISL_514432-S66) or 20I/501Y.V1 (B.1.1.7) (UK) (EPI_ISL_736997) SARS-CoV-2 viral particles (MOI, 0.05), and noninfected cells were used as the negative control for infection. After 48 hours, the cells were lysed and their RNA was extracted. Bottom: Quantification of mRNA abundance relative to that in CTR cells (2−ΔΔCt) of N from RT-PCR analysis with SYBR Green. Noninfected cells and SARS-CoV-2–infected cells treated with vehicle (CTR) were used as controls. Data are means ± SD. **P < 0.01 by unpaired two-tailed Student’s t test, adjusted with the Bonferroni method; n = 3 independent experiments per group. qPCR, quantitative PCR.
Fig. 6
Fig. 6. Antiviral mechanisms of action of polyP120.
Cartoon representation to illustrate our hypothesis for the antiviral actions of polyP120 in primary human epithelial cells. PolyP120 can stimulate the proteasome-mediated degradation of ACE2 and RdRp, thus reducing the expression of the SARS-CoV-2 gRNAs and sgRNAs. Thus, polyP120 can act extracellularly through direct interactions with the host cell ACE2, which is the receptor for the S protein of SARS-CoV-2, and intracellularly through its interactions with the RdRp protein of SARS-CoV-2. PolyP120 also led to the reduced expression of the genes encoding IL-10, IL-12, IL-6, IFN-γ, and TNF-α by decreasing the phosphorylation of the NF-κB protein p65. These cytokines are typically responsible for the cytokine storm observed in patients with COVID-19.

References

    1. Tay M. Z., Poh C. M., Renia L., MacAry P. A., Ng L. F. P., The trinity of COVID-19: Immunity, inflammation and intervention. Nat. Rev. Immunol. 20, 363–374 (2020). - PMC - PubMed
    1. Wang Y., Zhang D., Du G., Du R., Zhao J., Jin Y., Fu S., Gao L., Cheng Z., Lu Q., Hu Y., Luo G., Wang K., Lu Y., Li H., Wang S., Ruan S., Yang C., Mei C., Wang Y., Ding D., Wu F., Tang X., Ye X., Ye Y., Liu B., Yang J., Yin W., Wang A., Fan G., Zhou F., Liu Z., Gu X., Xu J., Shang L., Zhang Y., Cao L., Guo T., Wan Y., Qin H., Jiang Y., Jaki T., Hayden F. G., Horby P. W., Cao B., Wang C., Remdesivir in adults with severe COVID-19: A randomised, double-blind, placebo-controlled, multicentre trial. Lancet 395, 1569–1578 (2020). - PMC - PubMed
    1. Andersen K. G., Rambaut A., Lipkin W. I., Holmes E. C., Garry R. F., The proximal origin of SARS-CoV-2. Nat. Med. 26, 450–452 (2020). - PMC - PubMed
    1. Huang C., Wang Y., Li X., Ren L., Zhao J., Hu Y., Zhang L., Fan G., Xu J., Gu X., Cheng Z., Yu T., Xia J., Wei Y., Wu W., Xie X., Yin W., Li H., Liu M., Xiao Y., Gao H., Guo L., Xie J., Wang G., Jiang R., Gao Z., Jin Q., Wang J., Cao B., Clinical features of patients infected with 2019 novel coronavirus in Wuhan, China. Lancet 395, 497–506 (2020). - PMC - PubMed
    1. Guan W.-j., Ni Z.-y., Hu Y., Liang W.-h., Ou C.-q., He J.-x., Liu L., Shan H., Lei C.-l., Hui D. S. C., Du B., Li L.-j., Zeng G., Yuen K.-Y., Chen R.-c., Tang C.-l., Wang T., Chen P.-y., Xiang J., Li S.-y., Wang J.-l., Liang Z.-j., Peng Y.-x., Wei L., Liu Y., Hu Y.-h., Peng P., Wang J.-m., Liu J.-y., Chen Z., Li G., Zheng Z.-j., Qiu S.-q., Luo J., Ye C.-j., Zhu S.-y., Zhong N.-s.; China Medical Treatment Expert Group for Covid-19 , Clinical characteristics of coronavirus disease 2019 in China. N. Engl. J. Med. 382, 1708–1720 (2020). - PMC - PubMed

Publication types

MeSH terms