. 2021 Jul 6;14(690):eabf8483.
doi: 10.1126/scisignal.abf8483.

Kynurenic acid may underlie sex-specific immune responses to COVID-19

Affiliations

Kynurenic acid may underlie sex-specific immune responses to COVID-19

Yuping Cai et al. Sci Signal. .

Abstract

Coronavirus disease 2019 (COVID-19) has poorer clinical outcomes in males than in females, and immune responses underlie these sex-related differences. Because immune responses are, in part, regulated by metabolites, we examined the serum metabolomes of COVID-19 patients. In male patients, kynurenic acid (KA) and a high KA-to-kynurenine (K) ratio (KA:K) positively correlated with age and with inflammatory cytokines and chemokines and negatively correlated with T cell responses. Males that clinically deteriorated had a higher KA:K than those that stabilized. KA inhibits glutamate release, and glutamate abundance was lower in patients that clinically deteriorated and correlated with immune responses. Analysis of data from the Genotype-Tissue Expression (GTEx) project revealed that the expression of the gene encoding the enzyme that produces KA, kynurenine aminotransferase, correlated with cytokine abundance and activation of immune responses in older males. This study reveals that KA has a sex-specific link to immune responses and clinical outcomes in COVID-19, suggesting a positive feedback between metabolites and immune responses in males.


Figures

Fig. 1
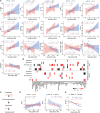
Fig. 1. Tryptophan pathway metabolites and immune responses.
(A) Correlation between KA ion intensities and immune markers in male patients with COVID-19 (Pt. M, n = 17) and female patients with COVID-19 (Pt. F, n = 22). Ninety-five percent confidence intervals (CIs) for the correlation coefficients are indicated as shaded areas colored according to patient sex. (B) Heatmap showing the correlation between tryptophan metabolites and immune markers in males and females with COVID-19. Spearman correlations >0.5 or <−0.5 are displayed; P < 0.05. (C) Tryptophan (T) metabolism pathway schematic. (D) Correlation between age and KA:K ratio in patients with COVID-19 and in HCWs. (E) Correlation between KYAT3 expression (averaged within each age group) and age in GTEx samples (n = 729 males, n = 1914 females). Metabolites are displayed as log10-transformed ion intensities. Cytokines and chemokines are displayed as log10-transformed concentrations in the plasma (in picograms per milliliter), T cell subsets are given as a percentage of CD3+ T cells, and T cell numbers are given as 106 cells/ml, and these values were used for the correlation analysis. In the heatmap (B), correlations between tryptophan metabolites and percentages of B cells, NK cells, and total and classical monocytes (TotalMono and cMono, respectively) in live PBMCs are also included.
Fig. 2
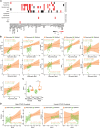
Fig. 2. Tryptophan metabolites, immune markers, and disease severity.
(A) Heatmap of the correlations between metabolites in the tryptophan pathway and immune markers by disease severity. Spearman correlations >0.5 or <−0.5 are displayed with P < 0.05. (B) Correlations between KA ion intensities and immune markers by disease severity. Ninety-five percent CIs for the correlation coefficients are indicated in the shaded areas colored according to disease progression status. (C) Comparison of the KA:K ratio by disease severity stratified by sex. Patients were classified as stabilized (females, n = 16; males, n = 11) or deteriorated (females, n = 6; males, n = 6). Nonparametric Kruskal-Wallis rank sum tests with pairwise Wilcoxon Mann-Whitney U tests were performed, and P values were adjusted for FDR (Benjamini-Hochberg). **P < 0.01; NS, not significant. (D) Correlation between the KA:K ratio and CXCL9 and CCL1 abundances stratified by disease severity and sex. Metabolites, cytokines and chemokines, T cell subsets, T cell numbers, and subsets of PBMCs are displayed and analyzed as described for Fig. 1A.
Fig. 3
Fig. 3. Glutamate, immune markers, and disease severity.
(A) Comparison of glutamate abundance in stablized patients and deteriorated patients (left) and stratified by sex (right). The numbers of the different patient groups are as follows: Stabilized patients (n = 27), deteriorated patients (n = 12), stabilized females (n = 16), deteriorated females (n = 6), stabilized males (n = 11), and deteriorated males (n = 6). Nonparametric Kruskal-Wallis rank sum tests with pairwise Wilcoxon Mann-Whitney U tests were performed, and P values were adjusted for FDR (Benjamini-Hochberg). **P < 0.01. (B) Correlation between glutamate ion intensities and the amounts of eotaxin2, IL-5, and IL-6, as well as the numbers of CD4+ T cells, CD4+ rnTreg cells, CD8+ T cells, and GzB+CD8+ T cells in stabilized patients and deteriorated patients, as indicated. (C) Correlation between glutamate ion intensities and the amounts of eotaxin2, IL-5, and IL-6, as well as the numbers of CD4+ T cells, CD8+ T cells, and GzB+CD8+ T cells in stabilized patients and deteriorated patients stratified by sex. Ninety-five percent CIs for the correlation coefficients were indicated as the shadowed areas colored according to progression status. Metabolites, cytokines and chemokines, T cell subsets, T cell numbers, and subsets of PBMCs are displayed and analyzed as described for Fig. 1A.

Update of

References

    1. Takahashi T., Ellingson M. K., Wong P., Israelow B., Lucas C., Klein J., Silva J., Mao T., Oh J. E., Tokuyama M., Lu P., Venkataraman A., Park A., Liu F., Meir A., Sun J., Wang E. Y., Casanovas-Massana A., Wyllie A. L., Vogels C. B. F., Earnest R., Lapidus S., Ott I. M., Moore A. J., Yale I. R. T., Shaw A., Fournier J. B., Odio C. D., Farhadian S., Dela Cruz C., Grubaugh N. D., Schulz W. L., Ring A. M., Ko A. I., Omer S. B., Iwasaki A., Sex differences in immune responses that underlie COVID-19 disease outcomes. Nature 588, 315–320 (2020). - PMC - PubMed
    1. Ganeshan K., Chawla A., Metabolic regulation of immune responses. Annu. Rev. Immunol. 32, 609–634 (2014). - PMC - PubMed
    1. O’Neill L. A., Kishton R. J., Rathmell J., A guide to immunometabolism for immunologists. Nat. Rev. Immunol. 16, 553–565 (2016). - PMC - PubMed
    1. Song J.-W., Lam S. M., Fan X., Cao W. J., Wang S. Y., Tian H., Chua G. H., Zhang C., Meng F. P., Xu Z., Fu J. L., Huang L., Xia P., Yang T., Zhang S., Li B., Jiang T. J., Wang R., Wang Z., Shi M., Zhang J. Y., Wang F. S., Shui G., Omics-driven systems interrogation of metabolic dysregulation in COVID-19 pathogenesis. Cell Metab. 32, 188–202.e5 (2020). - PMC - PubMed
    1. Wirthgen E., Hoeflich A., Rebl A., Günther J., Kynurenic acid: The Janus-faced role of an immunomodulatory tryptophan metabolite and its link to pathological conditions. Front. Immunol. 8, 1957 (2018). - PMC - PubMed

Publication types

MeSH terms